


Maintenance and Experimental Use of Mouse Lines for Cortical Organoid Research
Keywords: mouse line maintenance, cortical organoids, mouse embryonic stem cells, MADM clones, scRNA-seq, Emx1-cre, blastocyst culture, neurodevelopment research
Animal Welfare, Mouse Housing and Experimental Design
All animal procedures were approved by the Austrian Federal Ministry of Women, Science and Research in accordance with Austrian and European Union animal welfare legislation. The relevant licenses were BMWF-66.018/0007-II/3b/2012, BMWFW-66.018/0006-WF/V/3b/2017, GZ: 2020-0.579.989 and GZ: 2025-0.597.515.
Experimental mice were bred and maintained under regulations approved by the institutional animal care and use committee, the institutional ethics committee and the preclinical facility (PCF) at ISTA. Mice were maintained under specific-pathogen-free conditions in accordance with FELASA recommendations57.
Animals were housed at a room temperature of 21 ± 1 °C, with a relative humidity of 40–55% and a 12 h light:12 h dark cycle. Food (V1126, Ssniff Spezialitäten) and tap water were provided ad libitum.
Previously described mouse lines carrying MADM cassettes on chromosome 1158, Emx1-cre59, Emx1-creER60 and the mTmG reporter61 were used to generate experimental animals and organoids. All mouse lines were maintained on a mixed C57BL/6 and CD1 genetic background.
Mice used for routine breeding were 2–8 months old. Female mice used for blastocyst collection were 2–4 months old, while mice used for in vivo clonal analysis were examined at postnatal day 21 (P21). Animal numbers were minimized wherever possible in accordance with the principles of replacement, reduction and refinement (3Rs).
Timed Breeding and Superovulation for Genetically Defined Blastocysts
MADM blastocysts: MADM-11TG/TG and MADM-11GT/GT;Emx1cre/+ stock mice were crossed to generate MADM-11GT/TG;Emx1cre/+ blastocysts. To generate inducible MADM blastocysts, MADM-11TG/TG mice were crossed with MADM-11GT/GT;Emx1-creER+/− mice, producing MADM-11GT/TG;Emx1-creER+/− embryos.
mTmG blastocysts: mTmG reporter mice were crossed with Emx1-cre+/− mice to generate mTmG;Emx1-cre+/+ or mTmG;Emx1-cre+/− blastocysts for single-cell RNA sequencing (scRNA-seq).
Superovulation was performed according to the ISTA Preclinical Facility protocol. To synchronize the oestrous cycle and induce superovulation, females received 0.1 ml of pregnant mare serum gonadotropin (PMSG; 5 IU; Sigma) by intraperitoneal injection between 16:00 and 18:00 on day −3 before ovulation. On day −1, 46–48 h after PMSG administration, females received 0.1 ml of human chorionic gonadotropin (5 IU; Sigma) by intraperitoneal injection and were immediately placed with males.
Lyophilized PMSG and human chorionic gonadotropin were reconstituted in Dulbecco’s phosphate-buffered saline (PBS; Sigma), aliquoted and stored at −20 °C until use.
Derivation and Culture of Mouse Embryonic Stem Cells
Blastocysts were collected at embryonic day 3.5 (E3.5), and mouse embryonic stem cells (mESCs) were derived from individually cultured blastocysts as previously described62. Blastocysts were flushed from the uterine horns with M2 medium (Sigma) using a syringe, collected with a micropipette and washed in 1 ml of M2 medium.
Blastocysts were cultured for up to 24 h in KSOM medium (Sigma), until blastocoel expansion and/or hatching was observed. Each blastocyst was then transferred to an individual well of a 96-well plate prepared one day earlier with mouse embryonic fibroblasts (MEFs; Thermo Fisher Scientific) at a density of 1.5 × 10⁴ cells per well.
mESCs were cultured in KO-DMEM containing 15% knockout serum replacement, 1 mM sodium pyruvate, 0.1 mM non-essential amino acids, 0.1 mM 2-mercaptoethanol, 2 mM GlutaMAX, 50 U ml−1 penicillin/streptomycin, 2i inhibitors consisting of 1 µM PD0325901 and 3 µM CHIR99021, and batch-tested LIF at 1–2 ng ml−1. All reagents were obtained from Thermo Fisher Scientific or Sigma unless otherwise indicated.
When large outgrowths were visible, typically after approximately seven days, cells were passaged for the first time. mESCs were subsequently maintained on MEFs in medium containing ES-qualified fetal bovine serum (FBS) and LIF, with passaging approximately every three days.
Two passages before organoid generation, mESCs were removed from MEFs and cultured on EmbryoMax 0.01% gelatin-coated wells in FBS/LIF/2i medium63. Cells were maintained for a maximum of 10 passages. Cultures were routinely tested for mycoplasma using the LookOut Mycoplasma PCR Detection Kit (Sigma).
All cell cultures were maintained at 37 °C with 5% CO2. Early-passage cells (P3–P8) were frozen in liquid nitrogen using ES-qualified FBS containing 20% DMSO. These early-passage stocks were used for all experiments, with the final passage used to generate organoids ranging from P8 to P15.
Methanol Fixation and Karyotyping of mESC Lines
Methanol fixation was performed according to the protocol provided by Cell Guidance Systems’ karyotyping service. mESC cultures in six-well plates were incubated with medium containing 10 µg µl−1 KaryoMAX colcemid solution (Thermo Fisher Scientific) for 30 min at 37 °C.
After removing the medium, colonies were dissociated with 400 µl pre-warmed 0.05% Trypsin-EDTA for 5 min at 37 °C. Trypsin was neutralized with 800 µl warm medium. Cells were transferred to a 15 ml conical tube and centrifuged for 5 min at 200g.
The supernatant was removed, and the cell pellet was loosened by flicking the tube 20 times. Cells were treated dropwise with 2 ml warm 0.075 M KCl, followed by a further 2 ml added slowly down the side of the tube. Samples were mixed by inversion and incubated for 15 min at 37 °C.
Ten drops of freshly prepared, ice-cold fixative consisting of three parts methanol to one part acetic acid by volume were added using a 1 ml Pasteur pipette. Samples were mixed gently by inversion, centrifuged for 5 min at 150g and resuspended in 4 ml cold fixative. This washing step was repeated, after which cells were resuspended in 1.5 ml fixative and shipped to Cell Guidance Systems for karyotyping.
Chromosome 8 and chromosome 11 abnormalities have previously been reported in mESC lines64,65.
Metaphase Spreads and Chromosome Counting
Cells used for metaphase chromosome spreads were fixed as described above. Superfrost glass slides were cooled at −20 °C for 5 min before use. A 100 µl aliquot of fixed cell suspension was dropped onto each slide from a height of 10–15 cm.
Slides were air dried, and coverslips were mounted using Mowiol 4-88, 1,4-diazabicyclooctane and DAPI (4′,6-diamidino-2-phenylindole; Thermo Fisher Scientific; 1:5,000 dilution).
Metaphase spreads were imaged using a Plan-Apochromat 40×/1.2 water-immersion objective on an inverted LSM 800 series confocal microscope (Zeiss). Images were processed with Zeiss ZEN Blue software versions 2.3 and 2.6. Chromosomes were counted manually using ZEN Blue 2.6, and data were plotted in GraphPad Prism 10.2.2 (Dotmatics).
Generation of Mouse Cortical Organoids
mESCs were plated at high density so that colonies covered approximately half of the well surface after two days. Medium was changed 1–2 h before dissociation. Cells were dissociated using StemPro Accutase or CTS TrypLE for 5 min at 37 °C.
Cell viability was assessed with Trypan blue using an automated cell counter. Only cultures with more than 90% viable cells were used. Cells were centrifuged for 5 min at 200g, resuspended in Solution 1 and seeded at 3,500 cells per microwell in 24-well AggreWell plates (Stem Cell Technologies).
Solution 1 consisted of G-MEM, 10% knockout serum replacement, 1 mM sodium pyruvate, 0.1 mM non-essential amino acids, 0.1 mM 2-mercaptoethanol, 2 mM GlutaMAX, 50 U ml−1 penicillin/streptomycin and 3 µM IWR1, a Wnt inhibitor. SMAD inhibitors were not used because they were not required for cortical differentiation in mouse organoids66.
Embryoid bodies formed by day 1 and were transferred to 10 cm dishes containing fresh Solution 1 supplemented with 2% growth factor-reduced Matrigel (Corning). On day 5, organoids were gently pipetted to remove Matrigel and transferred to Solution 2.
Solution 2 contained DMEM/F12, 1% N2 supplement, 0.1 mM non-essential amino acids, 2 mM GlutaMAX, 50 U ml−1 penicillin/streptomycin, 1% chemically defined lipid concentrate and 1 µg ml−1 heparin.
On day 7, organoids were transferred to six-well plates and placed on an orbital shaker at 50 rpm to prevent fusion. From day 9 onward, organoids were cultured in a 50:50 mixture of DMEM/F12 and Neurobasal containing 0.5% N2, 1% B27, 0.5 mM non-essential amino acids, 2 mM GlutaMAX, 50 U ml−1 penicillin/streptomycin, 1% chemically defined lipid concentrate and 50 µM 2-mercaptoethanol.
Medium was replaced every 2–3 days as required. Orbital shaker speed was increased to 80 rpm after day 9. Fused organoids and organoids that failed to grow were removed from the experiment. Standard culture conditions of 37 °C and 5% CO2 were used throughout.
Induction of MADM Clones in Cortical Organoids
4-Hydroxytamoxifen (4-OHT; Sigma) stock solutions were prepared in 100% ethanol at a concentration 1,000-fold higher than the working concentration, corresponding to 20–80 µM. Concentrations were titrated to generate approximately one MADM clone per organoid on average.
The maximum working concentrations were 80 nM on day 8, 40 nM on days 9–12, 60 nM on day 13 and 80 nM on day 15. When treatment was performed on a day without a scheduled medium change, the medium was removed from the relevant wells, transferred to a tube, supplemented with 4-OHT and returned to the organoids.
After 24 h, the medium was completely replaced and organoids were washed once with PBS. Organoids were collected on day 20 for MADM clonal analysis. Astrocyte analysis additionally included organoids collected on day 25.
For each clone-initiation time point, clones were obtained from three cell lines and three independent differentiations, except for days 9, 11 and 12, which used two cell lines and four differentiations. The observed clone frequencies were as follows:
- D8–D20: 109 clones from 100 organoids, or 1.09 clones per organoid
- D9–D20: 46 clones from 49 organoids, or 0.94 clones per organoid
- D10–D20: 93 clones from 165 organoids, or 0.56 clones per organoid
- D11–D20: 50 clones from 67 organoids, or 0.75 clones per organoid
- D12–D20: 61 clones from 50 organoids, or 1.22 clones per organoid
- D13–D20: 68 clones from 133 organoids, or 0.51 clones per organoid
- D15–D20: 40 clones from 63 organoids, or 0.63 clones per organoid
- D8–D25: 39 clones from 92 organoids, or 0.42 clones per organoid
Induction of MADM Clones In Vivo
In vivo MADM clone induction was performed as previously described56,58. Experimental MADM-11GT/TG;Emx1-creER+/− mice were generated by crossing MADM-11GT/GT;Emx1-creER+/− mice with MADM-11TG/TG mice.
Timed pregnant females received 2 mg tamoxifen (Sigma) dissolved in corn oil by intraperitoneal injection at E10 to induce MADM recombination. Live embryos were recovered by caesarean section at E18–E19 and fostered until P21. Both male and female specimens were included.
Overall, 30 MADM clones were obtained from 37 brains, corresponding to an average of 0.81 clones per brain.
Tissue Collection, Fixation and Cryosectioning
Organoids were fixed for 4 h or overnight in 4% paraformaldehyde (Sigma). Mouse tissue collection was performed using established protocols56. Mice were deeply anaesthetized by intraperitoneal injection of ketamine and xylazine at 65 mg kg−1 and 13 mg kg−1 body weight, respectively. Lack of responsiveness was confirmed by paw pinch.
Mice were perfused with ice-cold PBS followed by ice-cold 4% paraformaldehyde in PBS using a peristaltic pump at 4–6 ml min−1. Brains were fixed overnight in 4% paraformaldehyde and washed with PBS.
Organoids and mouse brains were cryoprotected in 30% sucrose in PBS for one and 2–3 days, respectively. Samples were embedded in Tissue-Tek O.C.T. (Sakura) and stored at −20 °C or −80 °C. All samples were cryosectioned using a CryoStar NX70 cryostat.
Mouse brains were sectioned coronally at 45 µm and collected in PBS before mounting onto glass slides in sequential order. Organoids were sectioned at 40 µm and mounted directly onto Superfrost glass slides. Mounted sections were air dried in the dark and processed immediately for mouse tissue analysis or stored at −20 °C until organoid analysis.
Immunostaining of Mouse Brain and Cortical Organoid Sections
Mounted cryosections were rehydrated in PBS for 15 min at room temperature. Antigen retrieval was performed for PAX6, TBR2, CTIP2, SATB2, OCT3/4, NANOG and GFAP by incubating samples in citrate buffer containing 10 mM citric acid and 0.05% Tween-20 at pH 6.0 for 25 min at 85 °C.
After cooling and three PBS washes, sections were blocked for 2 h at room temperature in PBS containing 0.5% Triton X-100 and 10% donkey serum. Primary antibodies were diluted in blocking solution and applied for 16–72 h at 4 °C.
Sections were washed three times for 15 min in PBS and incubated with diluted secondary antibodies for 2–24 h at room temperature. Following three additional PBS washes, nuclei were stained with DAPI for 15 min. Sections were mounted with Mowiol 4-88, 1,4-diazabicyclooctane and stored at 4 °C until imaging.
Primary Antibodies
- Chicken anti-GFP, Aves GFP1020, 1:1,000
- Goat anti-tdTomato, SICgen ab8181-200, 1:1,000
- Rabbit anti-PAX6, Cell Signaling 60433S, 1:500
- Rat anti-TBR2, Thermo Fisher Scientific 14-4875-82, 1:400
- Rat anti-CTIP2, ab18465, 1:400
- Mouse anti-SATB2, Abcam ab51502, 1:200
- Rabbit anti-NANOG, Abcam ab80892, 1:500
- Mouse anti-OCT3/4, Santa Cruz sc5279, 1:200
- Rabbit anti-GFAP, DAKO Z0334, 1:1,000
- Rabbit anti-NEUROD2, ab109406, 1:200
- Rabbit anti-CASPASE3, Cell Signaling 9661S, 1:400
Secondary Antibodies
- Donkey anti-chicken-Alexa Fluor 488, Jackson Immuno 703-545-155, 1:1,000
- Donkey anti-goat-Alexa Fluor 568, Invitrogen A11057, 1:1,000
- Donkey anti-goat-CY3, Jackson Immuno 705-165-147, 1:1,000
- Donkey anti-rat-Alexa Fluor 594, Life Technologies A21205, 1:1,000
- Donkey anti-mouse-Alexa Fluor 647, Life Technologies A32787, 1:1,000
- Donkey anti-rabbit-Alexa Fluor 647, Life Technologies A31573, 1:1,000
For MADM clones stained for GFAP, donkey anti-chicken-Alexa Fluor 488 and donkey anti-goat-Alexa Fluor 568 were used to label MADM-expressing cells. For clones stained for SATB2 and CTIP2, donkey anti-chicken-Alexa Fluor 488 and donkey anti-goat-CY3 were used.
Confocal Imaging and MADM Clone Analysis
Immunostained samples were first screened for MADM clones using a Zeiss Axioscope Axio Imager equipped with a CoolLED p300 SB light source and Plan-Apochromat 10×/0.45 and 20×/0.8 objectives. Green and red fluorescence was visualized with an HC dual-band GFP/DsRed filter.
Organoid and mouse brain clones were imaged using a Plan-Apochromat 20×/0.8 objective on an inverted LSM 800 confocal microscope. Z-stack and tiled images were acquired using 405, 488, 561 and 640 nm excitation lasers. Images were processed with Zeiss ZEN Blue software versions 2.3 and 2.6.
Five-channel imaging for DAPI, GFP, tdTomato, CTIP2 and SATB2 was performed using a Leica Stellaris 5 confocal microscope with an HC PL APO 20×/0.75 CS objective. A white-light laser was optimized for Alexa Fluor 488, CY3, Alexa Fluor 594 and Alexa Fluor 647, while DAPI was excited using a 405 nm laser. Images were processed with LAS X 2.5.7.23225.
Images were imported into ImageJ/Fiji, and MADM-labelled cells were counted manually according to marker expression. Clone architecture was reconstructed using published methods29:
- Proliferative clones: both red and green subclones contained at least four cells.
- Asymmetric neurogenic clones: one subclone contained at least four cells and the other contained fewer than four cells.
- Small neurogenic clones: both subclones contained three or fewer cells.
Laminar Positioning of MADM Clones
For the in vivo data shown in Fig. 3l, laminar positioning was determined using DAPI staining for two of 263 MADM clones induced at E10–E121 and nine of 106 clones induced at E129. Laminar-specific immunostaining was available for none of 17 MADM clones induced at E10–E121.
Clearing, Immunolabelling and Imaging of Cortical Organoids
Organoid Delipidation
Organoids were fixed as described above, except that the sucrose dehydration step was omitted. Fixed organoids were embedded in 1.5% agarose to provide structural support during clearing.
The clearing protocol was adapted from established tissue-clearing methods67–69. Organoids were first washed in a 50% solution of a 1:1 mixture of CUBIC-L and CUBIC-R1a diluted in distilled water for up to 16 h at 37 °C and 300 rpm.
CUBIC-L contained 10% w/v N-butyldiethanolamine and 10% w/v Triton X-100. CUBIC-R1a contained 5% w/v N,N,N′,N′-tetrakis, 10% w/v urea, 10% w/v Triton X-100 and a 1:200 dilution of 5 M NaCl in distilled water.
Organoids were then incubated twice in 100% 1:1 CUBIC-L:CUBIC-R1a for 2 h per incubation at 37 °C and 300 rpm. Samples were washed twice in PBS for 2 h and once overnight, each at 37 °C and 300 rpm.
Immunolabelling of Cleared Organoids
Cleared organoids were incubated overnight at 37 °C and 300 rpm with chicken anti-GFP and goat anti-tdTomato antibodies, each at 1:500, in 0.2% PBST.
Samples were washed three times for 1 h in PBS at 37 °C and 300 rpm, then incubated overnight under the same conditions with donkey anti-chicken-Alexa Fluor 488 and donkey anti-goat-Alexa Fluor 568, each at 1:1,000 in 0.2% PBST. Organoids were washed twice for 1 h in PBS.
Refractive Index Matching
Organoids were transferred through increasing concentrations of CUBIC-R+(N), consisting of 30% nicotinamide and 45% antipyrine in distilled water. Samples were incubated for 1 h each in 25%, 50%, 75% and 100% CUBIC-R+(N). After the final step, the 100% solution was replaced and samples were stored overnight before imaging.
Three-Dimensional Imaging and Analysis
Whole cleared organoids embedded in agarose were imaged using an Andor Dragonfly 505 spinning-disk system with a 20× Lambda/NA 0.75/working-distance 1.00 mm objective and 488 and 561 nm excitation lasers. Organoids were immersed in fresh CUBIC-R+(N) or mineral oil with a refractive index of 1.52.
Nikon ND2 files were converted and stitched using IMARIS File Converter and IMARIS Stitcher. Stitched files were opened in IMARIS v9.9.1, where organoid surfaces were reconstructed using the Surface tool. Sphericity and volume were calculated automatically.
Generation of mTmG;Emx1-cre+/+ Organoids for scRNA-seq
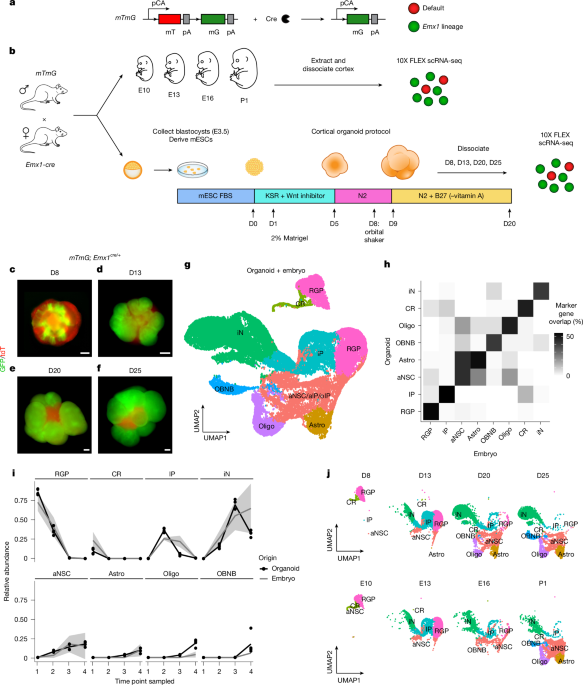
mESC lines carrying the mTmG;Emx1-cre+/+ genotype and the corresponding cortical organoids were generated using the procedures described above. Two mESC lines, A and B, were used. Two batches were generated from consecutive passages of each line, producing four biological replicates per time point: A1, A2, B1 and B2.
Large organoid batches were generated so that organoids from all four time points could be collected from the same batch for each replicate.
Generation of mTmG;Emx1-cre+/+ Embryos for scRNA-seq
Cortical tissue was prepared according to previously published methods70. Embryos were collected from timed-pregnant females that had been euthanized by cervical dislocation. Pups were separated from their mothers, and all embryos and pups were euthanized by decapitation.
Whole heads or extracted brains were maintained in ice-cold HBSS. Using a dissection microscope, the cortex was removed and placed in fresh ice-cold HBSS. Cortical samples, or telencephalic vesicles at E10.5, were dissected free of meninges and medial and ventral structures, pooled and processed.
Preparation and Fixation of Single-Cell Suspensions
Between 106 and 2 × 10⁶ fixed cells were collected for each replicate. Appropriate numbers of organoids or embryos were pooled before dissociation.
For embryonic samples, 40, 30, 10 and 4 brains were pooled from 8, 4, 2 and 2 litters for E10, E13, E16 and P1, respectively. For organoid samples, approximately 800 D8 organoids from 4–5 AggreWells, 300 D13 organoids, 80 D20 organoids and 60 D25 organoids were used.
Organoids and embryonic tissue were dissociated using a previously published protocol with modifications71. Samples were incubated in Earle’s balanced salt solution containing papain and DNase I for 20 min at 37 °C for D8 and D13 samples or 25 min for later samples, with gentle shaking at 150 rpm.
Tissue was gently triturated three times with a P1000 pipette tip. Ovomucoid inhibitor and albumin were added, and the suspension was briefly dissociated mechanically. Following centrifugation at 1,000 rpm for 10 min at room temperature, the pellet was resuspended and further dissociated by pipetting up to 20 times.
The suspension was passed through a 70 µm filter and centrifuged at 1,500 rpm for 10 min. Debris was removed by resuspending the pellet in cold Debris Removal Solution (Miltenyi Biotec), carefully overlaying the suspension with cold PBS and centrifuging at 3,000g for 10 min at 4 °C.
The PBS and debris layers were aspirated. The cleaned suspension was recovered by centrifugation at 1,000g for 10 min at 4 °C. After manual Trypan blue counting, 106–2 × 10⁶ cells were collected and fixed using the Chromium Fixed RNA Profiling kit and protocol (10X Genomics, CG000478, RevD).
Cell pellets were resuspended in 4% formaldehyde and 1× Fix and Perm Buffer and stored at 4 °C for 22 h. Cells were then pelleted and resuspended in 1× quenching buffer, counted and mixed with Enhancer solution and glycerol. Fixed samples were stored at −80 °C until processing.
Sample Collection for MADM-CloneSeq
Organoids containing MADM clones induced on day 13 were collected on day 20 for MADM-CloneSeq. Sample collection was adapted from a published protocol72.
Organoids were maintained in Millicell cell culture membranes in oxygenated artificial cerebrospinal fluid containing 118 mM NaCl, 2.5 mM KCl, 1.25 mM NaH2PO4, 1.5 mM MgSO4, 1 mM CaCl2, 10 mM glucose, 3 mM myo-inositol, 30 mM sucrose and 30 mM NaHCO3. ACSF was prepared with ultrapure water, adjusted to pH 7.4 and maintained at 35 °C under 95% O2 and 5% CO2.
Work surfaces and equipment were cleaned with RNase Away before use. Individual organoids were transferred to an LNscope 240XY microscope and superfused with ACSF at 0.5 ml min−1 at room temperature. Clones were visualized using a 20× objective and ImageJ. Fluorescence was observed using a CoolLED source.
Autoclaved glass pipettes were pulled using a P1000 pipette puller to produce openings of approximately 3–5 µm. Each pipette was filled with 3.5 µl RNase inhibitor at 1.95% in RNase-free PBS filtered through a 0.22 µm filter.
Red or green fluorescent neurons were approached under positive pressure to minimize contamination. After contacting the cell membrane, a tight seal was formed under infrared differential interference contrast visualization. Cell bodies were aspirated using gentle, steady suction while monitoring fluorescence. Aspiration typically required 5–10 s.
Negative pressure was released immediately after collection, and the pipette was withdrawn carefully from the acute slice. The contents were transferred directly into individual PCR tubes and stored at −80 °C until cDNA library preparation.
cDNA Library Preparation and Sequencing
10X Genomics experiments were performed by the Next Generation Sequencing Facility at Vienna BioCenter Core Facilities. Single-cell libraries were prepared using the 10X Genomics Flex workflow according to the manufacturer’s instructions (CG000527).
To detect GFP and tdTomato transcripts, custom probes were designed according to 10X Genomics Technical Note CG000621 and ordered from Integrated DNA Technologies. Four probe pools were generated, one for each FLEX barcode sequence (BC001–BC004). Custom probes were combined with the mouse probe set PN-100496 according to the manufacturer’s instructions. Custom probe sequences are provided in Supplementary Table 1.
MADM-CloneSeq cDNA libraries were prepared from individual cells using the Smart-seq3 protocol73 across three 96-well plate batches. Libraries were sequenced at VBCF-NGS on an Illumina NovaSeq X platform.
Bioinformatic Analysis of 10X Flex scRNA-seq Data
Initial Organoid Data Processing
All bioinformatic analyses were performed using an in-house pipeline74. FASTQ files were processed with the mm10 reference dataset, refdata-cellranger-mm10-3.0.0, using Cell Ranger v8.0.0. GFP and tdTomato sequences were added to the Chromium Mouse Transcriptome Probe Set v1.0.1 mm10-2020-A.csv file.
Filtered feature matrices in HDF5 format were analysed in R v4.3.2 using Seurat v5.0.175. High-quality cells were initially filtered using the following criteria: nFeature_RNA > 1,000, nFeature_RNA < 8,000, nCount_RNA < 40,000 and mitochondrial transcript percentage <5%.
Cell clusters were identified with FindNeighbors using dimensions 1–25 and FindClusters at a resolution of 0.3. GFP-positive clusters were identified using differential GFP expression.
Stressed cells were identified using granular functional filtering (Gruffi)76. Gene Ontology gene sets were obtained from org.Mm.eg.db v3.18.0. Stress-related terms included canonical glycolysis (GO:0061621) and response to endoplasmic reticulum stress (GO:0034976). Because radial glial progenitors and glial cells showed high scores for these pathways, non-stressed gene sets were also included: gliogenesis (GO:0042063), forebrain generation of neurons (GO:0021872) and forebrain neuroblast division (GO:0021873).
Before Gruffi analysis, clusters were recalculated using FindNeighbors with principal-component dimensions 1–30 and FindClusters at a resolution of 2.
Initial Processing of In Vivo Mouse Data
Initial filtering and identification of GFP-expressing clusters were performed as described for organoid data, except that nCount_RNA was restricted to fewer than 20,000 counts. Clustering used principal-component dimensions 1–15 and a resolution of 0.25.
Identifying the Tissue Origin of Emx1+/GFP+ Organoid Cells
For Supplementary Figs. 2 and 3, organoid data were analysed as described for embryonic samples, with the following modifications. Mouse in vivo data were used as the reference for label transfer: D8 organoids were compared with E11.0, D13 with E13.5, D20 with E16.5 and D25 with E18.0.
Anchors were identified using FindTransferAnchors with SCT normalization, PCA reference reduction and dimensions 1–20. Labels were transferred using TransferData with dimensions 1–20.
A group of D8 cells initially classified as GFP-positive was subsequently identified as GFP-negative. These cells were removed by reclustering D8 data at a resolution of 0.6 and excluding cluster 19, which contained 333 cells.
Identifying the Tissue Origin of Emx1+/GFP+ Cells in Mouse Brain
For Supplementary Figs. 4 and 5, clusters that did not express GFP were compared with a published reference dataset containing multiple embryonic brain tissues25. Read counts in loom format and annotation data were obtained from mousebrain.org.
E10 samples were compared with E11.0 reference samples 10×40_3, 10×40_4, 10×40_5 and 10×40_6. E13 samples were compared with E13.5 sample 10×14_4, E16 samples with E16.5 sample 10×17_4 and P1 samples with E18.0 sample 10×32_2.
Cell-cycle states were assigned using G2/M and S-phase marker genes and the Seurat CellCycleScoring function. Reference and experimental data were normalized and scaled separately, with partial regression of cell-cycle effects using SCTransform and the variables S.score and G2M.score.
Reference annotations were transferred using FindTransferAnchors with SCT normalization, PCA reference reduction and dimensions 1–15, followed by TransferData. Subclass labels were assigned according to the majority label in each Seurat cluster. Final annotations combined subclass and class identifiers and were restricted to annotations representing more than 3% of cells.
Data Integration and Cell-Type Annotation
For Fig. 1 and Extended Data Figs. 2 and 14, organoid and embryonic data were integrated using cluster similarity spectrum integration (CSS)77. GFP-positive organoid and mouse datasets were merged, all layers were joined and standard processing was performed with NormalizeData, FindVariableFeatures using 5,000 genes, ScaleData and RunPCA with 30 components.
Integration was performed using simspec and cluster_sim_spectrum with the group label identifying either in vivo mouse or organoid data.
UMAP visualization used the CSS reduction with a cosine metric, 10 nearest neighbours, two components and a minimum distance of 0.2. Integrated clusters were identified with FindNeighbors and FindClusters at a resolution of 1.
Cell types were assigned manually using marker genes, cluster identity, UMAP position and the developmental timing of cell-type appearance:
- Neurons: Neurod2
- Intermediate progenitors: Eomes and Top2a
- Radial glial progenitors: Hes5 and Top2a
- Astrocytes: Aldh1l1
- Oligodendrocytes: Olig2
- Olfactory bulb neuroblasts: Dlx5
- Cajal–Retzius cells: Nhlh2
- Adult stem cells: mixed markers associated with olfactory bulb neuroblasts, oligodendrocytes and astrocytes
Because the dataset contained approximately four times more organoid cells than embryo cells, organoid cells were downsampled using SketchData with 35,000 cells and the LeverageScore method. This produced 28,568 organoid cells and 24,942 embryonic cells for downstream analyses and figure generation.
Cell-type marker overlap was assessed with FindAllMarkers using positive markers only. The percentage overlap of the top 100 marker genes and the intersection of the top 20 marker genes were calculated separately for organoid and embryonic datasets.
Comparison of Developmental Cell-Type Abundance
To compare cell-type dynamics during development, cell-type labels from the embryonic dataset were transferred to published reference datasets25,26. Reference time points included E11.0, E13.5, E16.5 and E18.0 for ref. 25, and E11, E13, E16 and P1 for ref. 26.
Relevant cortical, neuronal, progenitor, astrocyte and oligodendrocyte populations were extracted according to the annotation systems used in each dataset. Reference and experimental data were processed independently with SCTransform, including partial regression of cell-cycle effects. Labels were transferred with FindTransferAnchors and TransferData.
Relative cell-type abundance was calculated for each developmental time point. Data are presented as mean ± s.d. For organoid samples, the mean of four biological replicates and the individual relative abundances were plotted.
Matching Organoid Differentiation Stages to In Vivo Development
Organoid differentiation stages were matched to embryonic developmental ages using transcriptional signatures and changes in the relative abundance of major cell types.
For heatmaps, pseudobulk expression levels of neurons and radial glial progenitors were calculated for published reference time points and organoid samples by averaging normalized expression across shared genes. Pairwise Pearson correlations were calculated within each cell type and converted to z-scores within each reference time point. The matrix was adjusted so that the highest z-score at each organoid stage was zero, enabling direct comparison with the best-matching developmental age.
Published datasets covering E9–E18 and postnatal stages were used to assess cell-type abundance trends. Reference annotations were harmonized by combining astrocyte and oligodendrocyte populations as glia, renaming neuroblasts as intermediate progenitors and grouping remaining neuronal populations as neurons where appropriate.
Reference abundance data were plotted as smoothed curves using the LOESS method. Organoid data were annotated as described above and plotted with corresponding developmental trends.
MADM-CloneSeq Data Processing
MADM-CloneSeq data were obtained from 287 cells. Reads were aligned to the GRCm39 genome and Gencode vM27 using STAR v2.7.9a with the following parameters: outFilterMultimapNmax 1, outSAMstrandField intronMotif, outFilterIntronMotifs RemoveNoncanonical, outFilterScoreMinOverLread 0.22 and outFilterMatchNminOverLread 0.22.
Only R2 reads from paired-end sequencing were used. Exonic and intronic reads were counted from STAR-generated BAM files using summarizeOverlaps in GenomicAlignments v1.40.0 with singleEnd=TRUE, mode=IntersectionNotEmpty, ignore.strand=TRUE and inter.feature=TRUE.
Exonic and intronic counts were combined and used to create a Seurat object with a minimum of three cells and 300 features. This resulted in 279 cells.
Normalized marker sum analysis used annotated D20 and D25 organoid data. The top 200 marker genes were identified for each cell type, including adult neural stem cells, astrocytes, Cajal–Retzius cells, neurons, intermediate progenitors, olfactory bulb neuroblasts, oligodendrocytes and radial glial progenitors.
For each cell type, the top 154 genes with the highest expression were used to calculate a reference mean expression. MADM-CloneSeq marker expression was calculated in the same manner. The normalized marker sum score was defined as the mean cell-type marker expression in MADM-CloneSeq cells divided by the corresponding mean expression in the reference data.
Cells with high non-neuronal marker scores were excluded because they were likely to represent non-neuronal cells, poorly captured cells or samples contaminated with surrounding RNA. Cells with a neuron-to-non-neuron marker score ratio greater than 1.2 and a neuron score above 0.3 were classified as high-quality neurons, resulting in 215 cells.
Batch effects from the three library-preparation plates were accounted for using SCTransform with plate and neuronal marker score as variables to regress. PCA, neighbour detection and clustering were then performed using Seurat.
Neuronal Lineage Analysis
For Fig. 4b–h and Extended Data Figs. 12 and 13, reference data from E12–P1 were restricted to neuronal-lineage populations, including apical progenitors, intermediate progenitors, immature neurons, migrating neurons, subcerebral projection neurons, corticothalamic projection neurons, deep-layer and upper-layer cortical projection neurons, layer 4 neurons, near-projecting neurons and layer 6b cells.
Organoid radial glial progenitors, intermediate progenitors and neurons from D13, D20 and D25 were processed separately before integration with the reference and MADM-CloneSeq datasets. Integration used NormalizeData, FindVariableFeatures, ScaleData, RunPCA and cluster_sim_spectrum.
A three-dimensional reference UMAP was generated in integrated CSS space. Cell types were assigned using reference annotations and marker gene expression. Organoid and MADM-CloneSeq cells were projected onto the reference UMAP using ProjectUMAP, and the 10 nearest reference cells were identified using the nn2 function from the RANN package.
Cell identity was assigned according to the most frequent annotation among the 10 nearest reference cells. Two MADM-CloneSeq cells with uncertain clone assignments were removed. Six cells without an unambiguous reference annotation and 12 clones containing only one informative cell were excluded, resulting in a final dataset of 195 cells for downstream analyses.
Distance between comparable clone types was calculated in three-dimensional UMAP space using nn2. Differential expression between upper- and deep-layer cells was assessed with FindMarkers. Pseudotime was calculated for reference cells using monocle3 v1.3.7 with cluster_cells, learn_graph and order_cells. MADM-CloneSeq pseudotime was assigned according to the mean pseudotime of the 10 nearest reference cells.
Radial Glial Progenitor Analysis
For Extended Data Fig. 14, radial glial progenitor cells were extracted from organoid and in vivo datasets. Differentially expressed genes were identified for D8 versus E10 and D13 versus E13 comparisons using FindMarkers.
Embryo-specific genes were defined as genes with adjusted P < 0.01 and average log2 fold change below −1. Organoid-specific genes were defined as genes with adjusted P < 0.01 and average log2 fold change above 1.
Gene Ontology biological-process enrichment was performed using clusterProfiler v4.10.0 and org.Mm.eg.db v3.18.0 with enrichGO. Significance was expressed as the negative log10 of the adjusted P value.
Developmental Trajectory Analysis
Developmental trajectories shown in Fig. 4j–l and Extended Data Fig. 15 were calculated using slingshot v2.10.0. Lineages were identified with getLineages using Seurat cluster labels, the slingshot distance method, omega enabled and omega_scale set to 2.
Dimensionality reduction and clustering parameters were selected according to the relevant figure legends. UMAP was performed in CSS space using Euclidean distance, with variable nearest-neighbour and minimum-distance parameters. To simplify visualization and focus the analysis, the central portion of the neuronal population was combined into Seurat cluster 99.
Quantification and Statistical Analysis
Data were stored and processed using Microsoft Excel. Statistical analyses were performed with GraphPad Prism v10.2.2 and R using glmmTMB v1.1.14 where indicated.
Data are presented as mean ± s.e.m. or 95% confidence intervals, as specified in the relevant figure legends. Unless otherwise stated, n represents the number of clones. Data distributions were assessed using the Shapiro–Wilk test, and appropriate parametric or non-parametric tests were selected.
Changes in clone size over time were evaluated using the Kruskal–Wallis test followed by multiple-comparison testing. Count data were modelled using generalized linear mixed models. Negative-binomial distributions were used for asymmetric and proliferative clones, while a Conway–Maxwell–Poisson distribution was used for small neurogenic clones when it provided the best fit.
Age was included as the fixed effect, and batch was included as a random-intercept effect. The overall effect of age was evaluated with a likelihood-ratio test comparing the full model, counts ~ age + (1|batch), with the reduced model, counts ~ 1 + (1|batch).
Relative abundance between samples was compared using the chi-squared test. Details of sample sizes, statistical tests and P values are provided in the Results and Methods sections, corresponding figure legends, Source Data and Supplementary Tables 2 and 3.
Reporting Summary
Additional information about the research design is available in the Nature Portfolio Reporting Summary associated with this article.
Source: www.nature.com