


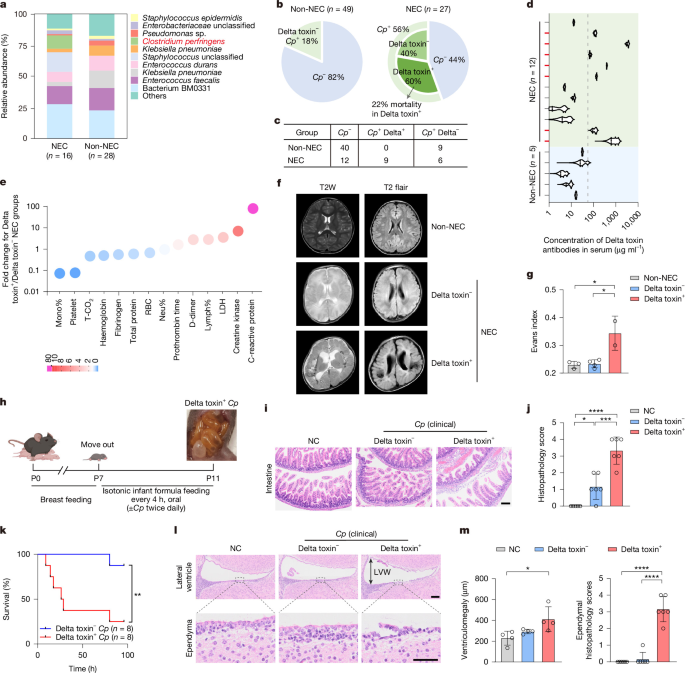
The study combined clinical samples, bacterial culture, microbiome and genome sequencing, cell and organoid experiments, genetically modified mice, toxin neutralization, imaging, immunological assays and a genome-wide CRISPR–Cas9 screen to investigate Clostridium perfringens and its Delta toxin. Human and animal procedures were approved by the relevant ethics committees, and the researchers examined toxin activity, host-cell binding, intestinal and brain injury, blood–brain barrier permeability, inflammatory signalling and potential antibody-mediated neutralization.
Clinical samples and C. perfringens isolation
The human clinical-sample study was approved by the Ethics Committee of Zhujiang Hospital, Southern Medical University (2025-KY-315-02). Informed consent was obtained from all participants or their guardians. Faecal samples were collected from patients diagnosed with necrotizing enterocolitis (NEC) at Bell stage II or III.
For bacterial isolation, 0.1 g of each faecal sample was homogenized in 1 ml PBS. A 100 μl aliquot of the homogenate was plated on TSC medium (Hopebio, HB0253) supplemented with 500 μg ml−1 d-cycloserine (Proteintech, CM01307). Plates were incubated anaerobically at 37 °C for 18–24 h in an atmosphere containing 80% N2, 10% H2 and 10% CO2. Individual black colonies were selected and cultured anaerobically in brain–heart infusion (BHI) broth (Hopebio, HB8297-1) for 4–6 h.
C. perfringens was identified by PCR amplification of the 16S rRNA gene and genes encoding the major toxins Alpha, Beta, Epsilon, Iota, CPE, NetB, Pfo and Delta toxin.
C. perfringens culture and supernatant toxicity
C. perfringens isolated from the faeces of patients with NEC was recovered from glycerol stocks, grown overnight in BHI at 37 °C under anaerobic conditions and subcultured for 48 h until the optical density at 600 nm (OD600) was approximately 2.5. Culture supernatants were concentrated approximately 20-fold.
HeLa and HT29 cells and human intestinal organoids were treated with the concentrated supernatant at 10 µl per 500 µl of culture medium for 30 min before imaging with an Olympus microscope. Lactate dehydrogenase (LDH) release was measured with a commercial kit (Thermo Fisher Scientific, C20301). Triton X-100 at 2% was used as the 100% positive control.
Microbiome and bacterial genome sequencing
16S rRNA sequencing of stool samples
Genomic DNA was extracted from faecal microbiota after overnight anaerobic culture using a magnetic bead-based kit (Tiangen, TGuide S96). The V3–V4 region of the 16S rRNA gene was amplified with primers 338F (5′-ACTCCTACGGGAGGCAGCA-3′) and 806R (5′-GGACTACHVGGGTWTCTAAT-3′).
A second PCR with Illumina-compatible primers was used to add indices. Amplicons were pooled, size-selected by gel electrophoresis and quantified. Paired-end sequencing was performed on an Illumina NovaSeq 6000 system using 2 × 250 bp reads.
Reads were quality-filtered with Trimmomatic and Cutadapt. DADA2 in R was used for denoising, paired-end merging and chimera removal. Amplicon sequence variants were classified against SILVA release 138 and UNITE release 8.0 using BLASTn v.2.9.0 and the QIIME2 Naïve Bayes classifier, with a confidence threshold of 0.7. Community composition and sample similarity were analysed with R packages. The sequencing data were submitted to the NCBI database under accession PRJNA1419495.
Genome sequencing and phylogenetic analysis
DNA from pure C. perfringens isolates was extracted with a magnetic-bead Bacterial/Fungal DNA extraction kit (Majorbio, T07-100). DNA was fragmented to approximately 400 bp with a Covaris M220 system. Libraries were prepared with the NEXTFLEX Rapid DNA-Seq Kit and sequenced as 2 × 150 bp paired-end reads on an Illumina NovaSeq X Plus system.
Raw reads were filtered with fastp v.0.23.2 and assembled with SPAdes v.3.15.5. The assembled genome was submitted to NCBI under accession PRJNA1419495.
Seven genome assemblies—five reference genomes from GenBank and two clinical isolates—were quality-controlled with QUAST, requiring an N50 of at least 200 kb, and re-annotated with Prokka v.1.14.6. Annotated sequences were clustered with OrthoSLC v.0.2.4 for single-nucleotide polymorphism comparisons. Core genes were aligned with Kalign v.3.3.5 and concatenated into strain-specific core genomes. Phylogenetic trees were constructed with RAxML v.8.0.2 using the GTRCAT model and 1,000 bootstrap replicates.
Mouse models
Cd9f/f mice (T013111) were generated by GemPharmatech using CRISPR–Cas9 gene targeting. EllaiCre mice (T050183) and Vil1iCre mice (T004714) were purchased from GemPharmatech. Lyz2cre mice were provided by P. Zhou.
Sex- and age-matched C57BL/6 mice of both sexes, including 4-week-old and neonatal animals, were purchased from Zhuhai BesTest Bio-Tech. Animals were randomly assigned to control or experimental groups, and investigators were not blinded. Mice were housed five per cage under specific-pathogen-free conditions on a 12 h–12 h light cycle at 22 ± 1 °C.
Animal care and procedures were approved by the Ethics Committee of Guangzhou National Laboratory (GZLAB-AUCP-2024-08-A07) and followed the Guide for the Care and Use of Laboratory Animals. Group sizes were selected on the basis of previous publications.
Experimental NEC and antibody neutralization
Experimental NEC was induced in 7-day-old C57BL/6 pups weighing 3–3.5 g over four days. Every 4 h, pups were gavaged with isotonic infant formula (Similac Advance, 40 μl g−1) containing 1 × 10⁸ colony-forming units of C. perfringens twice daily. Age-matched control pups received formula alone. Intestines were collected at postnatal day 11 (P11) for histological analysis.
For antibody-neutralization experiments, neonatal mice were housed with their dams until P6 and then randomly assigned to five groups: negative control; Delta toxin-positive C. perfringens clinical isolate 03 plus isotype IgG; Delta toxin-positive C. perfringens clinical isolate 03 plus anti-Delta toxin monoclonal antibody; NCTC3181 plus isotype IgG; or NCTC3181 plus anti-Delta toxin monoclonal antibody.
From P7 to P11, pups received a daily intraperitoneal injection of 10 µg of the assigned antibody in 50 µl sterile PBS through a 34-gauge needle. Throughout the experiment, pups were kept in thermoneutral cages, fed isotonic infant formula and gavaged twice daily with 1 × 10⁸ CFU of C. perfringens. At P11, animals were euthanized for tissue collection and histopathological analysis under protocol GZLAB-AUCP-2025-05-A03. Experimental schematics were prepared with BioRender (https://www.biorender.com/).
Cell lines and primary cells
Cell lines
HeLa (CCL-2), A549 (CRM-CCL-185), 5637 (HTB-9A), HEK293T (CRL-321), HT29 (HTB-38), RAW264.7 (TIB-71) and HUVEC (PCS-100-013) cell lines were obtained from ATCC. BV2 cells (BGT-CMP-219) were purchased from Amyjet Scientific. iBMDMs were provided by F. Shao of the National Institute of Biological Sciences, Beijing. CD9-knockout HeLa cells were obtained from T. Gallagher52.
All cell lines were cultured in DMEM or RPMI-1640 medium (Gibco) supplemented with 10% fetal bovine serum and 1% penicillin–streptomycin at 37 °C with 5% CO2. The lines were authenticated and confirmed to be free of mycoplasma.
Primary macrophages
Peritoneal macrophages were collected by washing the mouse peritoneal cavity with cold PBS containing 2% FBS and 1 mM EDTA. The lavage fluid was centrifuged. Supernatants were divided into aliquots and stored at −80 °C for later analysis, while cell pellets were resuspended in FACS buffer or complete DMEM containing 10% FBS and 1% penicillin–streptomycin.
Before in vitro stimulation of macrophages, all purified toxins were depleted of endotoxin.
Human intestinal organoids
De-identified human intestinal organoids were derived from paediatric endoscopic biopsies collected at Boston Children’s Hospital and supplied by the Harvard Digestive Disease Center Organoid Core Facility under protocol IRB-P00000529.
Biopsies were digested with 2 mg ml−1 collagenase type I (Life Technologies, 17018029) at 37 °C for 40 min with agitation, then centrifuged at 500g for 5 min at 4 °C. Crypts were resuspended in Matrigel (Corning, 356231), polymerized at 37 °C and cultured in Matrigel with growth medium consisting of 50% L-WRN conditioned medium, 45% DMEM/F12, 1% GlutaMAX, 1% N-2/B-27, 10 mM HEPES, 100 μg ml−1 primocin/normocin, 500 nM A83-01, 500 μM N-acetyl-cysteine, 50 ng ml−1 EGF, 10 nM [Leu15]gastrin I, 10 mM nicotinamide and 10 μM SB202190. Medium was refreshed every two days.
After 6–8 days, organoids were passaged with cell recovery solution (Corning, 354253) at 4 °C for 1 h, centrifuged, resuspended in fresh Matrigel, replated and cultured for two days. They were then treated with toxin overnight. Cell viability was measured with an MTT assay.
DNA constructs and protein purification
Constructs
Full-length toxin genes were synthesized by Tsingke. Constructs encoding Delta toxin, GST–Delta toxin or the mutated Delta toxin V17E/T18E were generated by subcloning Delta toxin residues 29–318 into pET-22b (Addgene, 69744-3) with a C-terminal His6 tag or into pGEX-4T-1 (Addgene, 27458001) with an N-terminal GST tag.
Full-length CD9 genes from human, mouse, bovine, pig, zebrafish, chicken, Drosophila and C. elegans were synthesized by Twist Bioscience and cloned into pcDNA3.1 (Invitrogen, V80020) using Gibson Assembly (NEB, E2621).
Human CD9–CD82 chimeric proteins were constructed as follows: CD9EC1CD82, CD9(1–33)–CD82(33–53)–CD9(56–221); CD9EC2CD82, CD9(1–111)–CD82(111–228)–CD9(196–221); CD9EC1EC2CD82, CD9(1–33)–CD82(33–53)–CD9(56–111)–CD82(111–228)–CD9(196–221); CD82EC1CD9, CD82(1–32)–CD9(34–55)–CD82(54–250); CD82EC2CD9, CD82(1–110)–CD9(112–195)–CD82(229–250); and CD82EC1EC2CD9, CD82(1–32)–CD9(34–55)–CD82(54–110)–CD9(112–195)–CD82(229–250). Each construct contained a GSGSEF linker and an N-terminal triple-Flag tag, and was cloned into pcDNA3.1 by Gibson Assembly. Constructs encoding Beta toxin, Pfo or α-Hla were generated in pET-28a.
Protein purification
Recombinant Delta toxin, Beta toxin, Pfo and α-Hla proteins carrying His6 or GST tags were expressed in E. coli BL21 (DE3; Thermo Fisher Scientific, EC0114) using autoinduction medium at 20 °C for 16 h. Bacterial pellets were lysed by sonication in purification buffer containing 200 mM NaCl, 20 mM Tris-HCl at pH 7.5 and 10% glycerol, then clarified by centrifugation.
GST-tagged proteins were purified with GSTrap columns (Cytiva, 7513101) and eluted with buffer containing 10 mM reduced glutathione (Sigma-Aldrich, PHR1359) at pH 7.5. His-tagged proteins were purified with HisTrap nickel columns (Cytiva, 17528601), washed with PP buffer containing 20 mM imidazole and eluted with a linear imidazole gradient of 20–500 mM.
Proteins were further purified with HiTrap Q ion-exchange columns (Cytiva, 17515601) and HiLoad 16/60 Superdex 75 gel-filtration columns (Cytiva, 28989333) in buffer containing 200 mM NaCl and 20 mM Tris-HCl at pH 7.5. Purified proteins were concentrated and treated with an endotoxin-removal kit (Beyotime, C0268).
Protein concentrations were calculated from absorbance at 280 nm measured with a BioDrop spectrophotometer, using extinction coefficients calculated with the ProtParam tool (https://web.expasy.org/protparam/).
Brain imaging and blood–brain barrier assays
Blood–brain barrier permeability
For blood–brain barrier permeability experiments, mice received intraperitoneal Delta toxin injections at different doses and time points: 20 µg seven days before dye injection, 100 µg six hours before dye injection, or 1 mg LPS six hours before dye injection. To inhibit NLRP3, mice received a single intraperitoneal injection of 10 mg kg−1 MCC950 (TargetMol, T3701) before an acute Delta toxin challenge.
In the chronic model, MCC950 was administered intraperitoneally one day before toxin exposure and then every other day for seven days. Blood–brain barrier permeability was measured by retro-orbital injection of 2% Evans blue. After two hours of circulation, mice were anaesthetized with Avertin at 250 mg kg−1 and perfused transcardially with PBS. Brains were dissected and photographed.
For quantification, the right hemisphere was weighed, minced and incubated in 50% (w/v) trichloroacetic acid. Homogenates were centrifuged at 15,000g for 30 min at 4 °C. Evans blue fluorescence was measured at 620/680 nm with a TECAN SPARK reader. Concentrations were calculated from a standard curve and normalized to brain weight. Experimental schematics were created with BioRender (https://www.biorender.com/).
In vivo brain MRI
Mice received intraperitoneal injections of 20 μg Delta toxin seven days before imaging, 100 μg Delta toxin four hours before imaging or vehicle. Brain MRI was performed on a Bruker BioSpec 94/30 USR 9.4 T preclinical scanner (Bruker BioSpin MRI). T2-weighted anatomical images were acquired with a rapid acquisition with relaxation enhancement sequence, reconstructed and analysed with MicroDicom DICOM Viewer.
Photoacoustic imaging
Mice received intraperitoneal injections of 20 μg Delta toxin seven days before imaging, 100 μg Delta toxin four hours before imaging or vehicle. Raster scanning covered a volume of 10 mm × 10 mm × 2.4 mm using a small-animal photoacoustic imaging system with a 532 nm pulsed laser. The laser had a pulse width of no more than 8 ns and a repetition rate of 10 kHz (GAni, Guangzhou G-Cell Technology).
Deionized water was used as the acoustic coupling medium. Signals were detected with a PVDF ultrasonic transducer with a 30 MHz centre frequency, amplified, digitized and reconstructed in real time with PAM 2.0 software (Guangzhou G-Cell Technology). System synchronization was controlled by FPGA.
Immunofluorescence and flow cytometry
Immunofluorescence staining
Mice were anaesthetized and perfused with ice-cold PBS followed by 4% paraformaldehyde. Brains were dissected, post-fixed in 4% paraformaldehyde for 24 h at 4 °C and dehydrated in 30% sucrose in PBS at 4 °C until saturated. Tissue was embedded in Tissue-Tek OCT compound (Leica, 14020108926) and frozen on dry ice.
Coronal sections were cut with a CM3050-S cryostat (Leica): 8 µm sections were used for vascular and tight-junction analysis, while 30 µm free-floating sections were used for microglial and astrocytic analysis. Sections were permeabilized with 0.5% Triton X-100, blocked with 5% BSA and incubated overnight at 4 °C with antibodies against ZO-1 (1:500, Invitrogen, 40-2200), IBA1 (1:1,000, Wako, 019-19741) or GFAP (1:1,000, Servicebio, GB11096-50).
After washing, sections were incubated for one hour at room temperature with fluorescent secondary antibodies Alexa Fluor 594 (1:1,000, Invitrogen, A110012) or Alexa Fluor 488 (1:1,000, Invitrogen, A11008). Sections were mounted with antifade medium containing DAPI (Vector Labs, H-1200-10). Images were acquired with an LSM800 confocal microscope (ZEISS) or an SLIDEVIEW VS200 slide scanner (Evident Scientific).
ZO-1 mean fluorescence intensity was quantified with ImageJ and normalized to controls. IBA1 and GFAP morphology was analysed using Imaris-based 3D reconstruction and skeletonization (Bitplane). Microglia and astrocytes were counted per field of view and normalized to cells per mm2.
Flow cytometry
Single-cell suspensions from peritoneal lavage fluid, intestine and brain were filtered through 70 μm strainers and centrifuged at 400g for 5 min at 4 °C. Cells were blocked with anti-CD16/32 antibody (2.4G2, Elabscience, E-AB-F0997A) in FACS buffer on ice for 15 min.
For surface-marker staining, cells were incubated with fluorochrome-conjugated antibodies in FACS buffer for 30 min at 4 °C. Viability was assessed with Live/Dead Fixable Violet Dead Cell Stain (Invitrogen, L34959).
BioLegend antibodies were used against mouse CD45 (30-F11, 103112), CD4 (RM4-5, 100550), CD8 (53-6.7, 100752), CD11b (M1/70, 101210), F4/80 (BM8, 123110), Ly6G (1A8, 127606) and CD9 (MZ3, 124815). CD19 antibody (1D3, 565965) was purchased from BD Biosciences. Data were collected with a BD LSRFortessa cytometer or SONY ID7000 Spectral Cell Analyzer and analysed using FlowJo v.10.8.1.
Isolation of intestinal and brain immune cells
Brain and intestinal tissues were dissected from anaesthetized mice and rinsed with cold PBS. Brain single-cell suspensions were prepared with a Dounce homogenizer in RPMI-1640.
For intestinal samples, segments were placed in Ca2+/Mg2+-free HBSS and the mucosa was separated. Tissue was incubated with shaking at 200 rpm for 30 min at 37 °C in a pre-digestion solution containing 1 mM DTT and 2 mM EDTA in Ca2+/Mg2+-free HBSS. Intestines were washed twice with RPMI-1640 and minced.
Minced tissue was incubated with shaking at 200 rpm for one hour at 37 °C in digestion solution containing 2 mg ml−1 collagenase IV (Yeasen, 40510ES76) and 5 U ml−1 DNase I (Sigma-Aldrich, D4263). Digested tissue was passed through a 70 μm strainer (Absin, abs7306) and centrifuged at 500g for 10 min at 18 °C.
Immune cells were isolated by Percoll-gradient centrifugation. Three millilitres of 30% stock isotonic Percoll was added to cell suspensions and layered over 2 ml of 70% stock isotonic Percoll. The stock was prepared as a 9:1 (v/v) mixture of Percoll (Cytiva, 17089101) and 10× Ca2+/Mg2+-free HBSS. Samples were centrifuged at 500g for 30 min at 18 °C with minimal or no braking. The 70–30% interphase was collected, diluted with 8 ml HBSS, centrifuged at 500g for 7 min at 18 °C and resuspended in 1 ml FACS buffer on ice.
Cell viability, histology and molecular analyses
MTT viability assay
Cells were plated overnight in 96-well microplates at approximately 70% confluence and exposed to twofold serial dilutions of toxins overnight at 37 °C. MTT was added to a final concentration of 0.5 mg ml−1 (Research Products International, M92050) and incubated for four hours at 37 °C.
Each well then received 100 μl of solubilization solution containing 10% SDS in 0.01 M HCl and was incubated overnight at room temperature. Absorbance was measured at 580 nm with a BMG Labtech FLUOstar Omega microplate reader. Vehicle controls were included, and viability curves were analysed with Origin v.8.5.
Histology and scoring
Tissue was fixed in 10% neutral-buffered formalin for 24 h at room temperature, transferred to PBS at 4 °C for 24 h, dehydrated through graded ethanol, cleared in xylene and embedded in paraffin. Sections 6 µm thick were cut and stained with haematoxylin and eosin.
Intestinal tissue was scored using an established NEC histopathological scale from 0 to 4: 0, no damage; 1, slight submucosal or lamina propria separation and sloughing of epithelial cells at villus tips; 2, moderate submucosal or lamina propria separation and mild villous necrosis; 3, severe submucosal or lamina propria separation, submucosal or muscular oedema and extensive villous sloughing; and 4, complete villous loss and full-thickness necrosis.
Brain tissue was graded on a 0–4 scale according to neuronal damage and tissue lesions: 0, normal morphology; 1, minimal damage, defined as sporadic neuronal shrinkage without structural disruption; 2, mild damage, with focal neuronal loss in limited brain regions; 3, moderate damage, with extensive neuronal damage and possible progression; and 4, severe damage, with diffuse neuronal necrosis throughout the examined brain region.
RNA extraction and reverse-transcription qPCR
Total cellular RNA was extracted with TRIzol reagent (Magen, R4801), and quantity and quality were measured with a NanoDrop instrument. cDNA was synthesized from 1 μg RNA with the StarScript III One-Step RT-PCR Kit for qPCR (Genstar, A235-01).
Quantitative PCR was performed in 384-well plates on a Bio-Rad real-time PCR detection system using 2× RealStar Power SYBR qPCR Mix (Genstar, A311-01). Relative expression was calculated with the \({2}^{(-\varDelta \varDelta {C}_{{\rm{T}}})}\) method and normalized to Actb for mouse cells. Specific RT–qPCR primers are listed in Supplementary Table 3.
ELISA
For serum antibody measurements, 96-well plates were coated overnight at 4 °C with Delta toxin at 1 μg ml−1 in coating buffer (Solarbio, C1055). After washing with PBST, wells were blocked with 5% BSA in PBS for one hour at room temperature.
Plates were incubated for two hours at room temperature with either Delta toxin monoclonal antibody standards at 1 μg ml−1 in threefold serial dilutions or serum samples beginning at a 1:100 dilution and serially diluted threefold. HRP-conjugated goat anti-human IgG (H+L) (Yeasen, 33501ES60; 1:10,000) was added for one hour. TMB (Solarbio, SEKF104) was used for development, followed by stop solution (Solarbio, SEKF101). Absorbance was measured at 450 nm with a 630 nm reference on a TECAN SPARK reader. Antibody titres were determined from dilution curves.
For measuring tissue Delta toxin levels and distribution, tissues were weighed, homogenized in PMSF-supplemented PBS at 10 μl mg−1 and subjected to three freeze–thaw cycles. Homogenates were centrifuged at 15,000g for 15 min at 4 °C, and supernatants were collected.
Plates were coated overnight at 4 °C with anti-Delta toxin mouse monoclonal antibody at 1 μg ml−1 and blocked. Serially diluted Delta toxin standards and tissue supernatants were added for two hours at room temperature. HRP-conjugated rabbit anti-mouse IgG (H+L) (Yeasen, 771475ES60; 1:10,000) was added for one hour, followed by the ELISA procedure described above. Tissue Delta toxin levels were normalized to uninfected controls.
Mouse IL-1β was measured with a high-sensitivity ELISA kit (ABclonal, RK04878) according to the manufacturer’s instructions.
Western blotting
Cells were lysed in RIPA buffer (Beyotime, P0013D) containing phosphatase inhibitors (Roche, 4906845001) and protease inhibitors (Roche, 11836153001). Protein concentration was determined with a Bio-Rad assay (5000111), and 20 μg of protein from each sample was loaded after normalization.
After transfer, membranes were blocked with 5% non-fat milk in TBST, consisting of Tris-buffered saline with 0.5% Tween-20, and incubated overnight at 4 °C with primary antibodies. Membranes were then incubated with HRP-conjugated anti-rabbit IgG (H+L) (Proteintech, SA00001-2) or anti-mouse IgG (H+L) (Proteintech, SA00001-1).
Protein bands were visualized with Clarity Western ECL substrate (SPARK, TECAN) and imaged. Primary antibodies included mouse monoclonal antibodies against GST (8-326, Thermo Fisher Scientific, MA4-004) and GAPDH (1E6D9, Proteintech, 60004-1-Ig); rabbit monoclonal antibodies against CD9 (SA35-08, HUABIO, HA750027), tissue factor (SN20-16, HUABIO, ET1611-95), GSDMD (E9S1X, CST, 39754), NLRP3 (PSH19-43, HUABIO, HA724075), caspase 1 (1O18, Proteintech, 81482-1-RR), IL-1β (EPR16805-15, Abcam, ab234437), phospho-NF-κB p65 at Ser536 (93H1, CST, 3033), phospho-AKT at Ser473 (D9E, CST, 4060), phospho-p44/42 MAPK (ERK1/2) at Thr202/Tyr204 (D13.14.4E, CST, 4370), BAX (D2E11, CST, 5023) and cleaved caspase 3 at Asp175 (5A1E, CST, 9664); and polyclonal antibodies against cleaved N-terminal GSDMD (Wanleibio, WL05411), cleaved caspase 1 (Zenbio, 341030), β-actin (13E5, CST, 4970) and β-tubulin (Proteintech, 10094-1-AP).
CRISPR–Cas9 screening and receptor-binding experiments
Genome-wide screen and knockout cells
HeLa–Cas9 cells were generated with lentivirus encoding LentiCas9-Blast (Addgene, 52962) and selected with 10 µg ml−1 blasticidin S (RPI, B12150.01). The GeCKO-V2 sgRNA library was obtained from Addgene (1000000049), and sublibraries A and B were independently packaged into lentiviruses.
HeLa–Cas9 cells were transduced at a multiplicity of infection of 0.3 and selected with 5 µg ml−1 puromycin (Thermo Fisher Scientific, A1113830) for one week. To maintain sufficient sgRNA coverage, 3.3 × 10⁷ cells from sublibrary A and 2.9 × 10⁷ cells from sublibrary B were plated on 15 cm culture dishes. Cells were either retained as initial-library controls or exposed to 0.01 µg ml−1 Delta toxin for 24 h.
Surviving cells were washed and reseeded in toxin-free medium until approximately 70% confluence, then subjected to another 24 h selection with 0.01 µg ml−1 Delta toxin. Genomic DNA was extracted with a commercial kit (Qiagen, 13323). DNA fragments containing sgRNA sequences were amplified by PCR with primers lentiGP-1_F (5′-AATGGACTATCATATGCTTACCGTAACTTGAAAGTATTTCG-3′) and lentiGP-3_R (5′-ATGAATACTGCCATTTGTCTCAAGATCTAGTTACGC-3′). Next-generation sequencing was performed by Genewiz on an Illumina HiSeq system.
The selected sgRNAs targeting LRP6 (TGGTTCTGACCGTGTAGTAT) and CLEC12B (CATTGCCACATCTTAGGACA) were cloned into LentiGuide-Puro (Addgene, 52963). Knockout cells were generated by transducing HeLa–Cas9 cells with the sgRNAs and selecting mixed transduced populations with 5 µg ml−1 puromycin. CRISPR–Cas9 screening results are provided in Supplementary Table 4.
Cell-surface binding and immunostaining
Cells were seeded on glass coverslips (Hampton, HR3-239). Constructs were transduced into cells for 24 h, after which cells were exposed to 0.4 μg ml−1 GST–Delta toxin on ice for 60 min. After washing with cold PBS, cells were fixed with 4% paraformaldehyde for 20 min, blocked with 10% goat serum for 40 min and stained for one hour with primary antibodies against GST and Flag at 1:500 dilution.
Fluorescently labelled secondary antibodies were applied for one hour. Slides were mounted in DAPI-containing medium (SouthernBiotech, 0100-20). Images were captured with an Olympus DSU-IX81 spinning-disk confocal system, pseudocoloured and analysed with ImageJ v.1.52o.
Pull-down and immunoblot analysis
Cell lysates were prepared in 1 ml of lysis buffer per 10 cm dish. The buffer contained PBS, 1% Triton X-100, 0.1% SDS and a protease inhibitor cocktail (Sigma-Aldrich). Lysates were incubated with 20 μg GST-tagged Delta toxin proteins for four hours at 4 °C.
Pull-down assays used 15 µl of glutathione agarose beads. Beads were washed, pelleted and boiled, and samples were analysed by SDS–PAGE and western blotting. Blot images were acquired with a Fuji LAS3000 system and analysed with ImageJ v.1.52o.
Bio-layer interferometry
Binding between Delta toxin and human GST–CD9 was measured with a bio-layer interferometry assay using a BLItz system (ForteBio). Biotin-labelled human GST–CD9 at 10 μg ml−1 (Abcam, ab152262) was immobilized on capture biosensors (GST Biosensors, ForteBio), then washed with Dulbecco’s PBS containing 0.5% BSA. Empty biosensors served as controls.
The biosensors were exposed to different concentrations of Delta toxin in solution and then placed in DPBS containing 0.5% BSA to measure dissociation. Binding affinities (KD) were estimated with BLItz software.
Delta toxin antibodies
Polyclonal antibodies
Six-week-old BALB/c mice were immunized subcutaneously with 100 µg of purified, non-toxic Delta toxin mutant V17E/T18E emulsified in complete Freund’s adjuvant (CFA; Sigma-Aldrich, AR001). Two booster doses of 50 µg in incomplete Freund’s adjuvant (Sigma-Aldrich, F5506) were administered at two-week intervals.
Polyclonal antibodies were purified by protein G affinity chromatography. The final antibody titre exceeded 1:100,000 as measured by ELISA.
Monoclonal antibodies
Six-week-old BALB/c mice were immunized subcutaneously with 100 µg of the non-toxic Delta toxin V17E/T18E mutant in complete Freund’s adjuvant, followed by four booster immunizations in incomplete Freund’s adjuvant. Serum titres were monitored by ELISA.
Splenocytes from the mouse with the highest titre were fused with SP2/0 myeloma cells. Fused cells were plated and selected for two weeks in RPMI-1640-HAT medium (Sigma-Aldrich, H0262) supplemented with 10% FBS, 1% penicillin–streptomycin and gentamicin.
Supernatants were screened by ELISA and cytotoxicity-neutralization assays to identify functional antibody-secreting clones. Positive hybridomas were subcloned by limiting dilution and expanded in RPMI-1640-HT medium (Sigma-Aldrich, H0137) containing 10% FBS and 1% penicillin–streptomycin.
Stable clones were characterized by ELISA and isotyped. One lead clone was selected for small-scale purification by protein A affinity chromatography, followed by large-scale production in ascitic fluid, yielding 1 mg of purified antibody. All hybridoma lines were cryopreserved at 1 × 10⁶ cells per vial for long-term storage.
Quantification, statistics and reporting
All experiments were performed at least three times. Data are presented using descriptive statistics such as mean ± s.d. Statistical analyses were performed with GraphPad Prism v.9.0. Details of the statistical analyses are provided in the relevant figure legends and in the Methods sections for each technique.
Additional information about the research design is available in the Nature Portfolio Reporting Summary linked to the article.
Source: www.nature.com