


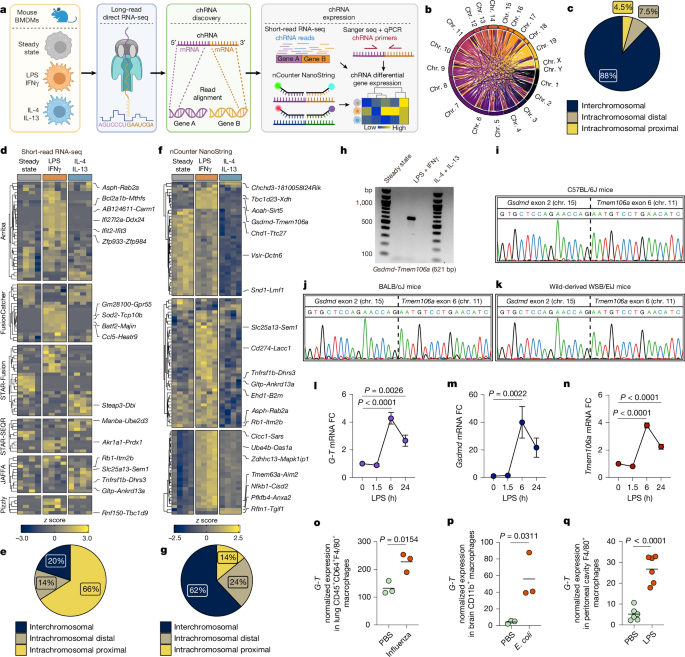
Long-read direct RNA sequencing using Oxford Nanopore
RNA libraries were prepared with the Oxford Nanopore Direct RNA Sequencing Kit (SQK-RNA002) and sequenced for 72 h on a PromethION P24 instrument using FLO-PRO002 flow cells. Sequencing was performed with MinKNOW v.22.03.4 and MinKNOW Core v.5.0.0 using a 1.5 h pore-scan frequency, active channel selection and reserved pores enabled. Basecalling was conducted with Bream v.7.0.9 and Guppy v.6.0.7. Data processing was performed on Ubuntu 20.04 by the BioMicro Center at the Massachusetts Institute of Technology.
Computational analysis of long-read direct RNA sequencing data
Passing FASTQ files generated from the same sample were merged into one FASTQ file per sample. Unless otherwise indicated for JAFFAL17 v.2.2 and v.2.3, mouse analyses used GENCODE58 release M28 and the GRCm39 genome, whereas human analyses used GENCODE release 43 and GRCh38.p13. JAFFAL-specific reference files were downloaded from the UCSC Genome Browser59 and prepared according to the JAFFAL documentation (https://github.com/Oshlack/JAFFA/wiki).
For NanoPlot60 v.1.42.0, genomic reads were aligned with Minimap261 v.2.24 using -ax splice -uf -k14. Alignments were processed with SAMtools62 v.1.15. Transcript abundance was estimated by aligning FASTQ files to the reference transcriptome with Minimap2 using the same parameters and quantifying the resulting BAM files with Salmon63 v.1.10.2 using salmon quant --ont -t <in.fasta> -lU --numBootstraps 30 -a <in.bam> -o <results>. Salmon output was imported into R using tximport64 v.1.38.2, with counts scaled using the lengthScaledTPM method. Differential expression was assessed with DESeq265 v.1.50.2 and cooksCutoff=TRUE. Gene-level summary values were calculated as log2(TPM + 1) from Salmon TPM estimates for genes with expression >0 in at least one sample.
A dedicated chimeric RNA analysis workflow, TYPHON, was developed for this study and is available on GitHub (https://github.com/erenada/TYPHON). TYPHON reproduces the manually calculated chimeric RNA analysis using an integrated, modular Python workflow and provides installation and execution support for the computational tools used in this study.
Chimeric RNA transcripts were identified with LongGF16 v.0.1.2, JAFFAL17 and Genion18 v.1.2.3. LongGF alignments were generated with Minimap2 using -ax splice -uf -k14 --secondary=no -G 50k and processed with SAMtools. LongGF was run on name-sorted BAM files using LongGF <bam_file_in> <gtf_file_in> 100 50 100 2 0 1 0 > <results.log>. JAFFAL was run with MIN_LOW_SPANNING_READS=1 in make_final_table.R. GENCODE reference files were reformatted for Genion using the 10x Genomics reference script (https://support.10xgenomics.com/single-cell-gene-expression/software/release-notes/build), the command sed ‘s/^chrM/MT/;s/^chrX/X/;s/^chrY/Y/;s/^chr//’, and pygtftk68 v.1.6.2 with gtftk convert_ensembl -i <input_gtf_file> -o <output_modified_gtf_file>.
Genion was modified to report read IDs for all detected chimeric RNAs by enabling full debug output and updating the annotate.cpp file. Within TYPHON, the modified annotation step produced one line per supporting read with the Read_ID included as the final column. The modified Genion build was used for all chimeric RNA analyses except the K562 BCR-ABL1 benchmarking analysis19,69, which used the standard installation. The required selfalign.tsv file was generated by aligning the reference transcriptome against itself with Minimap2 using -X -c; the resulting PAF file was converted to TSV using pafr v.0.0.2 and tidyverse v.2.0.0. Genion was run with --min-support 1 and a blank genomicSuperDups.txt file because an updated GRCm39 file was unavailable. The same blank file was used for human analyses. Input PAF files were generated with paftools.js sam2paf <input_sam_file> > <output_paf_file>.
LongGF log files, JAFFAL summary files and Genion result.tsv files were combined with tidyverse and deduplicated by Read ID. For BCR-ABL1 benchmarking, both result.tsv and .fail files were included. Chimeric RNA FASTA files were generated from alignments using SAMtools and SeqKit70 v.2.4.0. Reads were screened with BLAST+71 v.2.13.0 using transcriptome-derived databases created with makeblastdb and searched with blastn. Processing and exon repair used SeqKit, BEDOPS72 v.2.4.41, BEDTools73 v.2.31.0, Clustalo74 v.1.2.4, Clustalw75 v.2.1, Biopython76 v.1.81, Seqtk v.1.4, tidyverse and data.table v.1.15.2.
Chimeric RNAs were excluded if they failed to map to at least one isoform of each parent gene. Isoforms containing retained introns were excluded. BLAST matches were ranked by bit score, and the highest-scoring match was selected for each parent gene. Exon coordinates were obtained from the reference GTF using BEDTools. Breakpoint exons were inferred by comparing cumulative exon lengths with the lengths of BLAST-defined chimeric RNA segments. Selected exon coordinates were exported to BED files, and corresponding exon sequences were extracted from the reference genome to generate exon-repaired chimeric RNA FASTA files.
Cross-species conservation of mouse and human chimeric RNAs was evaluated using predicted chimeric proteins, BLAST and BLASTp. Open reading frames were predicted with orfipy77 v.0.0.4 using <chimeric_rna_sequence_fasta.fa> --min 90 --max 1000000000 --procs 1 --strand f --start ATG --stop TAA,TAG,TGA --table 1 --outdir <out_directory> --pep <predicted_peptide_fasta.fa>. Protein databases were created with makeblastdb. Human and mouse gene symbols were converted with the Nichenetr78 v.2.2.0 convert_human_to_mouse_symbols function. Matches were required to involve orthologous parent genes in both species. BLAST and BLASTp results were ordered by decreasing bit score and alignment length, and the top match was selected for each mouse chimeric RNA Read ID. Data processing used dplyr, stringr, data.table and rtracklayer79 v.1.64.0. Chimeric RNA IDs and associated coordinates were reordered according to biological transcript orientation following BLAST analysis and exon repair.
Short-read RNA sequencing
RNA libraries were prepared with the KAPA mRNA HyperPrep Kit (Roche). RNA concentration and integrity were assessed using an Agilent 4200 TapeStation with the RNA assay. All samples had an average RNA integrity number above 9. Samples were normalized to 200 ng RNA in 50 μl and mRNA was captured with oligo-dT beads. cDNA synthesis, adapter ligation and amplification were completed according to the KAPA workflow. Amplified libraries were purified with KAPA Pure Beads using a 0.63× SPRI cleanup and evaluated with the Agilent High Sensitivity D1000 ScreenTape assay. Functional library concentration was confirmed by qPCR with the KAPA Library Quantification Kit. Equimolar libraries were pooled, denatured and sequenced on an Illumina NovaSeq 6000 using an S4 300-cycle kit to generate paired-end 150 bp reads. Libraries were loaded at 1.2 pM with 5% PhiX. Basecall files were demultiplexed by the Harvard BPF Genomics Core, and the resulting FASTQ files were analyzed.
Computational analysis of short-read RNA sequencing data
Short-read FASTQ files were trimmed with fastp v.0.23.2 using default settings. Unless otherwise noted, GENCODE M28 reference files were used. Chimeric RNAs were detected with six tools: Arriba, FusionCatcher, STAR-Fusion, STAR-SEQR, JAFFA and Pizzly20,21,22,23,24.
Arriba v.2.4.0 was run after STAR v.2.7.11b alignment using the specified chimeric-read parameters, followed by Arriba with default settings and a blank blacklist file. STAR reference files were generated with STAR --runMode genomeGenerate --genomeFastaFiles <input_fasta> --sjdbOverhang 150. Ambiguous intergenic chimeric RNA reads were removed. FusionCatcher v.1.33 was built on 13 March 2025 with Ensembl 113 mouse references and run on untrimmed FASTQ files using default settings except for --limitSjdbInsertNsj 3000000 --limitOutSJcollapsed 3000000. STAR-Fusion v.1.12.0 references were generated using the Mouse GRCm39 CTAT library and GENCODE M28 annotations, then run with --no_annotation_filter --min_FFPM 0 --min_sum_frags 1.
STAR-SEQR v.0.6.7 references were generated with STAR using --runMode genomeGenerate --genomeFastaFiles --sjdbOverhang 150 --genomeSAsparseD 1. Lane-specific FASTQ files were concatenated by sample, and STAR-SEQR was run with -m 1 -vv --keep_mito. JAFFA v.2.3 used the long-read reference files and concatenated sample-level R1 and R2 FASTQ files. Pizzly v.0.37.3 was run on untrimmed FASTQ files following kallisto v.0.48.0 quantification with the fusion option. The kallisto index was generated from a modified GENCODE M28 transcriptome, and Pizzly was run with -k 31 --align-score 2.
Junction-level overlap between long- and short-read chimeric RNAs was calculated using coordinates from Arriba, FusionCatcher, STAR-Fusion, STAR-SEQR and JAFFA and exon-repaired breakpoint coordinates from long-read sequencing. FusionCatcher coordinates were converted from Ensembl 113 to GENCODE M28 using MGI and the scCustomize81 Updated_MGI_Symbols function. Pizzly transcript breakpoints were converted to genomic exon breakpoints by comparing cumulative exon lengths against GENCODE M28 transcript models. A difference of ≤10 nucleotides at both gene A and gene B breakpoints was required to define the same junction. Long-read chimera IDs were reordered according to biological transcript orientation; short-read IDs were not reordered.
FFPM-like values were calculated using (split_reads1 + split_reads2 + discordant_mates)/(total_mapped_reads/1,000,000), with tool-specific equivalent metrics substituted where necessary. These values were treated as estimates for candidate prioritization rather than standard expression measurements. Arriba used STAR BAM read counts; FusionCatcher used spanning unique reads; STAR-Fusion used JunctionReadCount + SpanningFragCount; STAR-SEQR used NREAD_SPANS + NREAD_JXNLEFT + NREAD_JXNRIGHT; Pizzly used total_paircount + total_splitcount; and JAFFA used spanning pairs + spanning reads. Only short-read chimeric RNAs overlapping long-read breakpoint junctions were retained. Values were transformed as log_ffpm <- log2(total_filter + 0.01). Differential testing used limma82. Relative enrichment was calculated from summed FFPM-like counts, and significance was assessed using the default R t.test function.
NanoString nCounter gene expression analysis
NanoString nCounter measurements were performed on purified RNA by the Genetics and Genomics Core at Boston Children’s Hospital using standard protocols and a NanoString nCounter Max System. BMDM RCC files were analyzed with NanoTube83 v.1.6.0 using nSolver normalization, a background proportion of 0.33 and a background threshold of 2. Passing chimeric RNA counts were transformed as log2(x + 0.5). Chimeric RNAs expressed below background, defined as a value of −1, in fewer than 75% of replicates within any polarization condition were excluded. Differential expression was analyzed with runLimmaAnalysis. In vivo Gsdmd-Tmem106a expression was analyzed in nSolver using standard settings and nSolver version ≤4.0.
Hi-C chromatin interaction data processing
Hi-C libraries were processed as previously described with modified parameters84. Reads were processed with presplit_map.py from diffHic v.1.38.085 and split into 5′ and 3′ segments when the MboI ligation motif GATCGATC was present. Segments were aligned in single-end mode to the mm39 mouse genome with bowtie2 v.2.5.387. Mate information was synchronized with Picard FixMateInformation v.1.117, duplicates were marked with MarkDuplicates, and BAM files were name-sorted with SAMtools. Alignments were assigned to MboI fragments with the diffHic preparePairs function. Duplicate reads and reads with mapping quality <10 were removed. Dangling ends and read pairs separated by more than 1,000 bp were excluded. Biological replicates were merged with mergePairs, and HDF read-pair files were converted to Juicer .hic format using Juicer Tools v.1.22.01.
Aggregate peak analysis of chromatin contacts
Aggregate peak analysis (APA) was performed with GENOVA89 v.1.0.1. Contact files were loaded using load_contacts at 500 kb resolution with balancing enabled. The analysis included 1,047 interchromosomal chRNA fusions identified in BMDMs by LongGF, JAFFAL and Genion. Control sets included 10,000 randomized interchromosomal fusion-partner combinations and 10,000 randomly sampled exon combinations. Intrachromosomal combinations were excluded. Exons were defined using the mm39 annotation included with Rsubread90 version ≤2.26.0. APA plots were generated with size_bin=11 and dis_thres=c(500000, Inf). Fold change was calculated as the foreground-to-background ratio, and values with a background of zero were excluded. P values were calculated using paired t-tests of log2(0.5 + fold-change) values.
Mouse strains and genetic models
All mouse experiments complied with Harvard Medical School Animal Care and Use Committee protocols. Unless otherwise specified, male and female 8–12-week-old C57BL/6J mice (000664; Jackson Laboratory) were used without blinding. BALB/cJ (000651) and wild-derived WSB/EiJ (001145) mice were also obtained from Jackson Laboratory. Gsdmd-knockout mice were provided by I. Chiu.
G-TMYC mice were generated by inserting a flexible linker and MYC epitope tag at the C terminus of the Gsdmd-Tmem106a open reading frame through homology-directed repair. A guide RNA and ssDNA donor template were designed to target the stop-codon region in exon 6 of Tmem106a. Knock-in alleles were confirmed by Sanger sequencing. PCR generated a 496 bp product from the knock-in allele and a 430 bp product from the wild-type allele.
G-TStop mice were generated by homology-directed repair using two guide RNAs and an ssDNA donor containing a point mutation targeting exon 6 of Tmem106a. The knock-in sequence was confirmed by Sanger sequencing using primers flanking the edited locus.
Generation and polarization of mouse bone-marrow-derived macrophages
Bone-marrow-derived macrophages (BMDMs) were generated from femur and tibia progenitors isolated from C57BL/6J, G-TStop or G-TMYC mice. Cells were differentiated for 7 days in macrophage colony-stimulating factor (M-CSF; 50 ng ml−1), with medium replacement after 4 days. Inflammatory macrophages were induced with LPS (100 ng ml−1; O55:B5; Enzo, ALX-581-013-L001) and recombinant mouse IFNγ (20 ng ml−1; PeproTech, 315-05) for 24 h. Tissue-reparative macrophages were induced with recombinant mouse IL-4 and IL-13 (20 ng ml−1 each; PeproTech, 214-14 and 210-13) for 24 h.
Generation and polarization of human monocyte-derived macrophages
Human monocyte-derived macrophages (MDMs) were generated from CD14+ monocytes. For Oxford Nanopore sequencing, anonymous peripheral blood waste products were obtained from the Mississippi Valley Regional Blood Center, and CD14+ cells were isolated using the MojoSort Human CD14 Selection Kit (BioLegend, 480026). For PCR and Sanger sequencing, anonymous cryopreserved CD14+ monocytes were purchased from Lonza (2W-400C). Cells were differentiated for 7 days in RPMI 1640 containing 10% FBS, M-CSF (50 ng ml−1) and GM-CSF (50 ng ml−1; BioLegend, 574806 and 572904). Inflammatory polarization was induced with LPS (100 ng ml−1) and recombinant IFNγ (20 ng ml−1; BioLegend, 570204) for 24 h.
DNA and RNA extraction, PCR, RT–qPCR and Sanger sequencing
DNA and RNA were extracted from BMDMs with TRIzol according to the manufacturer’s instructions. cDNA was synthesized with Maxima Reverse Transcriptase (Thermo Fisher Scientific, EP0741). Chimeric RNA PCR and RT–qPCR used a forward primer in gene A and a reverse primer in gene B. Primer sequences for chimeric RNAs identified by all three long-read tools and linked to immune-related parent genes are provided in Supplementary Table 9. Specific primer pairs were also used to validate CD44-FAM168B, ITGAX-CD52, HDAC8-CITED1 and TBC1D22B-RNF8 chimeras in human and mouse cDNA. PCR was performed on a ProFlex 3×32-well system. Long-range genomic PCR used Phusion high-fidelity polymerase with extended elongation times for products up to 10 kb. Sanger sequencing was conducted on 1% agarose gel-purified PCR products. RT–qPCR used SYBR Green on a QuantStudio 5 system, with all measurements performed in duplicate.
LPS treatment and peritoneal macrophage isolation for NanoString
Eight-week-old male C57BL/6J mice received intraperitoneal injections of 100 μl PBS or LPS from E. coli O111:B4 (5 mg kg−1; InvivoGen, tlrl-3pelps) for 16 h. Peritoneal lavage was collected in PBS containing 3% FBS. F4/80+ cells were enriched with anti-F4/80 magnetic beads (Miltenyi Biotec, 130-110-443), pooled from three mice per treatment group in TRIzol and processed for NanoString nCounter analysis.
Intracisternal infection and brain macrophage isolation
Eight-week-old male C57BL/6J mice received intracisternal injections of 5 μl PBS or 1.2 × 10³ CFU E. coli C5 (ATCC, 700973). After 18 h, mice were euthanized and perfused, and hindbrain tissue was collected and homogenized. Myeloid cells were enriched with 90% Percoll at 500g for 60 min at 4 °C. CD11b+ cells were isolated using magnetic beads (Miltenyi Biotec, 130-126-725), collected in TRIzol and analyzed by NanoString.
Intranasal influenza infection and pulmonary macrophage isolation
Eight-week-old female C57BL/6J mice were infected intranasally with 30 μl PBS or influenza A PR8 for 7 days. Following euthanasia and perfusion, lungs were collected and digested with collagenase IV (2 mg ml−1) and DNase I (100 μg ml−1) at 37 °C for 30 min with shaking. Homogenized tissue was filtered and separated on a 33%/66% Percoll gradient at 3,000 rpm for 30 min at room temperature. Live CD45+F4/80+CD64+ cells were sorted by flow cytometry and stored in TRIzol.
Pladienolide B spliceosome inhibitor treatment
BMDMs were plated at 1.5 × 10⁶ cells per well in six-well plates and treated with LPS (100 ng ml−1) plus 100 nM pladienolide B or 0.1% DMSO for 6 h. Cells were collected in 1 ml TRIzol per well for RNA extraction.
Actinomycin D transcription inhibition
BMDMs were plated at 1.5 × 10⁶ cells per well and co-treated with LPS (100 ng ml−1) and 5 μg ml−1 actinomycin D or 0.1% DMSO for 3 h. Cells were collected in 1 ml TRIzol per well.
siRNA transfection and gene knockdown
Two siRNAs targeting the Gsdmd-Tmem106a junction were pooled. Scrambled sequences were used as controls. Additional siRNAs targeted Ctcf, Gsdmd and Rnu1a1; negative-control siRNA was obtained from IDT. BMDMs were plated at 2 × 10⁵ cells per well in 24-well plates for cytokine and LDH assays or 1 × 10⁶ cells per well in six-well plates for RT–qPCR and western blotting. After attachment for at least 12 h, cells were transfected with Lipofectamine RNAiMAX. G-T and Gsdmd knockdown assays were analyzed 48 h after transfection, whereas Ctcf and Rnu1a1 assays were analyzed after 24 h.
Endogenous GSDMD–TMEM106A detection by western blotting
BMDMs from homozygous G-TMYC and wild-type littermate mice were plated at 8 × 10⁶ cells and left untreated or stimulated with LPS for 6 or 24 h. Whole-cell lysates were prepared in NP40 buffer containing 10% PMSF and protease inhibitors. Western blots used anti-MYC and anti-β-actin antibodies.
A custom GSDMD–TMEM106A antibody was generated by immunizing rabbits with peptide CGRPGHQQPPPAHRPIGQ, followed by three booster injections over 56 days. The antibody was affinity purified and validated by indirect ELISA. Endogenous GSDMD–TMEM106A was detected in untreated or LPS-treated wild-type and G-TStop BMDMs using the custom antibody. For subcellular localization, BMDMs were untreated, treated with LPS for 6 h or treated with LPS followed by nigericin. Fractionation was performed with the Thermo Fisher Subcellular Protein Fractionation Kit, and western blots used α-tubulin and Na,K-ATPase as cytoplasmic and membrane controls, respectively.
Western blots were performed on 4–12% NuPAGE Bis-Tris gels using the XCell SureLock Mini-Cell system and transferred with the XCell II Blot Module.
mRNA transfection for GSDMD–TMEM106A overexpression
Codon-optimized mRNAs were designed and synthesized by Moderna. Wild-type GSDMD–TMEM106A and the truncated GSDMD–TMEM106AΔCT sequence expressed by G-TStop mice were transfected into BMDMs with MessengerMAX Lipofectamine for 24 h. For IL-1β assays, 2 × 10⁵ cells per well were plated in 24-well plates and treated with 500 ng mRNA. For co-transfection experiments, 4 × 10⁴ cells per well were plated in 96-well plates and treated with 120 ng mRNA. Non-translating control mRNA was used to normalize total mRNA input.
Subcellular fractionation used the Thermo Fisher kit. HA-tagged proteins were detected by western blotting with anti-HA antibodies, using α-tubulin and Na,K-ATPase as cytoplasmic and membrane controls. For microscopy, GSDMD–TMEM106A–HA localization was examined with a Nikon Ti inverted microscope using a ×60 oil-immersion objective. Plasma membranes were stained with Alexa Fluor 488-conjugated wheat germ agglutinin, and HA-tagged protein was detected with PE-conjugated anti-HA antibody.
Pyroptosis assays, cytokine secretion, western blotting, LDH release and PI uptake
IL-1β, IL-18 and IL-6 were measured in cell-free supernatants using ELISA kits from BioLegend or R&D Systems. IL-1β and IL-18 were measured after LPS priming followed by 30 min of nigericin treatment to activate the NLRP3 inflammasome. IL-6 was measured after LPS treatment alone. Absorbance was recorded at 450 nm using a Synergy HTX plate reader, and samples were diluted to remain within the relevant standard ranges. Gsdmd-knockout iBMDMs were provided by J. Kagan’s laboratory and were not tested for mycoplasma contamination.
GSDMD and CASP-1 western blots were performed on untreated BMDMs, cells treated with LPS for 6 h or cells treated with LPS followed by nigericin. Lysates were prepared in NP40 buffer containing PMSF and protease inhibitors. GSDMD, CASP-1, cleaved CASP-1 and β-actin were detected with the indicated antibodies.
LDH release was measured after LPS priming and 2 h of nigericin treatment using the Promega CytoTox 96 assay. Maximum LDH release was determined after treatment with 1% Triton X-100. Absorbance was measured at 490 nm.
For PI uptake assays, cells were plated in black 96-well plates with optically clear bottoms. Following GSDMD–TMEM106A mRNA transfection, cells were treated with LPS and nigericin, and PI was added before measurement. Fluorescence was recorded at 530 nm excitation and 617 nm emission. For G-TStop and wild-type BMDMs, PI uptake was monitored with the Incucyte Live-Cell Analysis System or a Nikon Ti microscope under 5% CO2 and 37 °C. Red fluorescent cells were quantified over time and normalized to the maximum signal.
Lipid nanoparticle-encapsulated mRNA treatment in mice
Wild-type littermate mice were randomly assigned to treatment groups and injected intravenously through the tail vein with 100 μl lipid nanoparticle (LNP)-encapsulated mRNA at 1 mg kg−1. Mice were treated 18 h before LPS-induced sepsis or S. Typhimurium infection.
LPS-induced sepsis model
For serum cytokine analysis, female mice receiving LNP-mRNA were injected intraperitoneally with 100 μl LPS from E. coli O111:B4 at 3 mg kg−1. Body temperature was monitored every 3 h. After 6 h, blood was collected retro-orbitally and serum cytokines were measured by Eve Technologies using the Mouse Cytokine Proinflammatory Focused 10-Plex Discovery Assay Array. For survival studies, female mice received 6 mg kg−1 LPS. Male G-TStop and wild-type littermates received 15 mg kg−1 LPS, and temperature was recorded every 12 h for 24 h. Mice were monitored for humane endpoints, including a temperature decrease greater than 25%, severe hunching and markedly reduced ambulation. Sample sizes were based on prior experiments.
S. Typhimurium infection model
Salmonella was cultured overnight from glycerol stocks in Luria broth containing ampicillin (100 μg ml−1) and diluted to an OD600 of 0.9, corresponding to approximately 109 CFU ml−1. Mice received intraperitoneal injections of 100 μl stationary-phase S. Typhimurium in PBS. The inoculum was 102 CFU for G-TStop experiments and 105 CFU for in vivo LNP experiments. After 24 h, tissues were collected, homogenized in 2 ml PBS and plated on ampicillin-containing LB agar for CFU determination.
Co-immunoprecipitation of GSDMD–TMEM106A complexes
Wild-type BMDMs were transfected with mRNA encoding GSDMD–TMEM106A–HA, GSDMD–TMEM106AF50G/W51G–HA or a non-translating control. After 24 h, cells were stimulated with LPS for 4 h and then treated with nigericin and glycine for 30 min. Cells were lysed in Pierce IP lysis buffer, and clarified lysates were incubated overnight with anti-HA magnetic beads at 4 °C. After washing, proteins were eluted with NuPAGE LDS sample buffer and reducing agent. Immunoblotting was performed for cleaved GSDMD and HA. Input lysates were assessed for GSDMD, β-actin and HA.
Lentiviral transduction of BMDMs
Lentiviral plasmids and packaging were produced by VectorBuilder. BMDMs were plated in 24-well plates for microscopy and cytokine assays or six-well plates for subcellular fractionation. Cells were transduced at a multiplicity of infection of 10 in medium containing polybrene (8 μg ml−1). Fresh medium was added after 3 h, and assays were performed 72 h later.
BMDMs expressing GSDMD–TMEM106A–HA or empty vector were imaged with a Nikon Ti microscope using a ×100 oil-immersion objective. Plasma membranes were labeled with Alexa Fluor 488-conjugated WGA, and HA-tagged protein was detected with PE-conjugated anti-HA antibody. Subcellular fractionation and western blotting were performed using the Thermo Fisher kit, with α-tubulin and Na,K-ATPase as cytoplasmic and membrane controls.
Doxycycline-inducible GSDMD-NT pyroptosis experiments
iBMDMs stably expressing doxycycline-inducible GSDMD-NT40 were provided by J. Kagan’s laboratory and were not tested for mycoplasma contamination. Cells were plated at 3 × 10⁴ cells per well in black 96-well plates and maintained with puromycin and G418. After attachment, cells were transfected with GSDMD–TMEM106A, GSDMD–TMEM106AΔCT or control mRNA for 24 h. GSDMD-NT expression was induced with doxycycline hyclate at 0.25 μg ml−1. PI was added at induction, and fluorescence was monitored hourly for 24 h using the Incucyte system. PI uptake was normalized to the maximum signal at 24 h.
Recombinant GSDMD and GSDMD–TMEM106A protein constructs
Full-length GSDMD was cloned into pDB.His.SUMO using Gibson Assembly Master Mix. GSDMD–TMEM106A–FLAG and GSDMD–TMEM106AΔCT–FLAG were cloned into pDB.His.MBP-3C downstream of an N-terminal His6–MBP tag and human rhinovirus 3C protease site.
Bacterial expression and purification of recombinant proteins
Protein constructs were transformed into E. coli BL21 (DE3) cells. Transformants were cultured in LB containing kanamycin (50 μg ml−1). At OD600 0.6, protein expression was induced with 500 μM IPTG, and cultures were incubated for 16 h at 18 °C.
His–SUMO–GSDMD was purified by Ni-NTA affinity chromatography, cleaved with ULP1 and further purified by Superdex 200 size-exclusion chromatography in 40 mM HEPES, pH 7.0, containing 150 mM NaCl. GSDMD–TMEM106A–FLAG and GSDMD–TMEM106AΔCT–FLAG were lysed by sonication, clarified by centrifugation and purified with anti-FLAG G1 affinity resin. Proteins were eluted with 3×FLAG peptide, assessed for purity and snap-frozen.
Mammalian expression and purification of GSDMD proteins
pcDNA3.1-GSDMD-Flag constructs were transfected into Expi293 cells maintained in Expi293 expression medium. Cultures were supplemented with KCl, sodium butyrate and glucose after transfection and harvested after an additional 2 days. Cells were lysed by sonication, clarified by ultracentrifugation and purified using Flag G1 affinity resin. Proteins were eluted with 3×FLAG peptide and snap-frozen. Highly palmitoylated GSDMD was produced by treating Expi293 cells with 10 μM ROT for 4 h before collection.
GSDMD–TMEM106A liposome leakage assay
Liposomes were prepared from cardiolipin, phosphatidylethanolamine and phosphatidylcholine at a 5:8:4 mass ratio as previously described39,91. Lipids were dried under nitrogen, resuspended in HEPES–NaCl–sodium citrate buffer containing TbCl3, extruded through 100 nm membranes and purified by size-exclusion chromatography to remove external TbCl3.
Full-length GSDMD was precleaved with CASP-1, whereas GSDMD–TMEM106A proteins were precleaved with 3C protease. Catalytically active CASP-1 was expressed and purified as previously described91. For leakage measurements, liposomes were diluted in buffer containing dipicolinic acid. Tb3+ release was monitored by fluorescence at 545 nm after excitation at 276 nm for 2 h. Triton X-100 was added to determine complete release. Percentage release was calculated as Tb3+ release (%) = (F − F0) × 100/(F100 − F0).
Protein–lipid binding assay
Binding of recombinant GSDMD–TMEM106A–FLAG to membrane lipids was tested with Echelon Biosciences lipid strips according to the manufacturer’s protocol. Strips were blocked with 3% BSA in PBST, incubated with precleaved protein at 2 μg ml−1, washed and developed with anti-FLAG M2-HRP antibody. All steps were performed at room temperature.
Protein structure prediction and visualization
Three-dimensional protein structures were predicted with AlphaFold 3 through AlphaFold Server (https://alphafoldserver.com/) using random seed 9999. Molecular structure images were generated with Mol* and the RCSB Protein Data Bank platform (https://www.rcsb.org/).
Scientific schematic design
Schematics for Figs. 1a, 2k and 3a and Extended Data Figs. 3a and 9a were created with BioRender. Other schematics were prepared using Microsoft PowerPoint or Inkscape.
Statistical and computational data analysis
Sequencing analyses were performed on Linux GNU Pop!_OS LTS 22.04 or Ubuntu 26.04 LTS systems. Python analyses used Anaconda Distribution version ≤26.1.1 and Python version ≤3.13.9. R analyses were conducted with R version ≤4.5.2 in RStudio version ≤2026.05.0. Figures were generated with ggplot295 version ≤4.0.3 and ComplexHeatmap96 v.2.26.1. Microsoft Excel, LibreOffice Calc, Windows 11 Pro and macOS Big Sur were used for data organization and additional analyses. AlphaFold 3 results were accessed through AlphaFold Server, Mol* and the RCSB PDB platform.
Unless otherwise specified, experiments with multiple groups and independent variables were analyzed by two-way ANOVA with Sidak’s multiple-comparison test. One-way ANOVA with Tukey’s multiple-comparison test was used for multiple groups with one independent variable. Unpaired t-tests were used for comparisons between two groups. Adjusted P values were calculated with the relevant R or Python tools; other analyses used GraphPad Prism v.10.0.2 on macOS Big Sur.
Animal research ethics
All mouse experiments were conducted in accordance with protocols approved by the Harvard Medical School Institutional Animal Care and Use Committee.
Reporting summary
Additional information about the research design is available in the Nature Portfolio Reporting Summary linked to this article.
Source: www.nature.com