


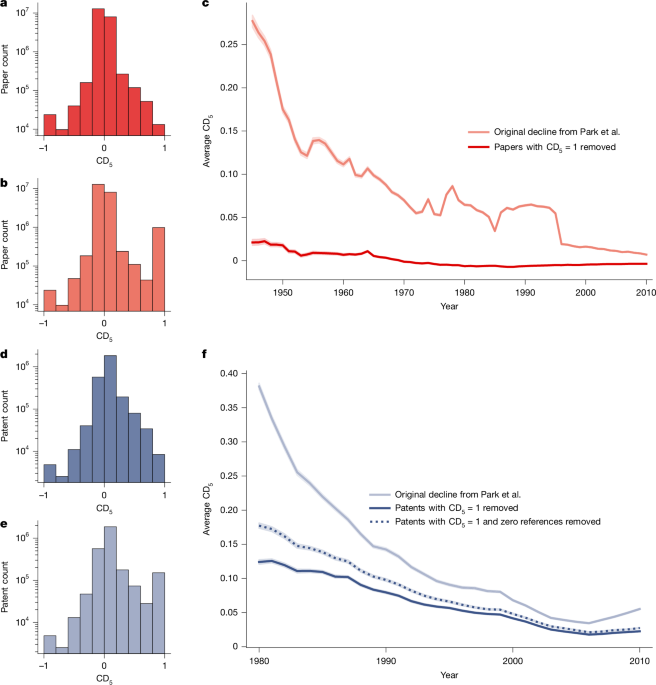
This figure shows the temporal evolution of the average CD5 index across six scholarly and patent data sources and five patent categories. The research databases include JSTOR (1,588,088 articles), the American Physical Society Corpus (461,359 articles), a random sample of 1,000,000 articles from Microsoft Academic Graph, and PubMed (1,563,211 articles). Web of Science (22,479,429 articles) and PatentsView (2,926,923 patents) are included as reference sources. The patent categories are Chemistry (517,964 patents), Computers and Communications (748,849 patents), Pharmaceuticals and Medical (321,449 patents), Electrical and Electronics (734,769 patents), and Mechanical (603,892 patents). Shaded bands represent 95% confidence intervals. a Temporal changes in the average CD5 index across data sources, based on Park et al.1 (Extended Data Figure 61). b After removing outliers with CD5 = 1, the decline in measured destructiveness changes by 100%, 107%, 100%, and 61% for JSTOR, the American Physical Society Corpus, Microsoft Academic Graph, and PubMed, respectively. With outliers, the changes are −0.16, −0.27, −0.31, and −0.18; without outliers, they are −0.00, +0.02, −0.00, and −0.07. Comparisons use 2006 versus 1930 for JSTOR and 2010 versus 1930 for the other sources. c Temporal evolution of the average CD5 index across patent categories, based on Park et al.1 (Figure 2b1). d Removing outliers with CD5 = 1 reduces the decline in destructiveness by 70%, 58%, 69%, 63%, and 71% for Chemical, Computers and Communications, Pharmaceuticals and Medical, Electrical and Electronics, and Mechanical patents, respectively. With outliers, the changes are −0.33, −0.24, −0.35, −0.32, and −0.38; without outliers, they are −0.10, −0.10, −0.11, −0.12, and −0.11. Comparisons use 2010 versus 1980.
Source: www.nature.com