


Cell culture and authentication
MCF7 (HTB-22), ZR-75-1 (CRL-1500), CAMA-1 (HTB-21), MDA-MB-453 (HTB-131), MDA-MB-231 (HTB-26), OVCAR-3 (HTB-161) and Kuramochi (JCRB0098) cell lines were obtained from the American Type Culture Collection. MCF7 ESR1Y537S cells were provided by S. Chandarlaparty35. MCF7, ZR-75-1, MDA-MB-231 and CAMA-1 cells were cultured in RPMI-1640 medium (11875-093, Gibco) containing 10% fetal bovine serum (FBS; SH30054.03, GE HyClone; SFBS-AU, Bovogen Biologicals), 1× GlutaMAX (35050061, Gibco) and 1% HEPES (15630080, Gibco). OVCAR-3 and Kuramochi cells were maintained in RPMI-1640 with 10% FBS and 1× GlutaMAX. MDA-MB-453 cells were cultured in DMEM supplemented with 10% FBS. All cell lines were incubated at 37 °C in 5% CO2 under humidified conditions. Cultures were maintained below 90% confluency, routinely screened by PCR to confirm the absence of mycoplasma and authenticated by short tandem repeat (STR) profiling.
In vitro drug treatment and combination studies
Abemaciclib methanesulfonate (HY-16297) and palbociclib isethionate (HY-A0065) were purchased from MedChemExpress. INX-315 was obtained from Incyclix Bio, while fulvestrant (S1191) and imlunestrant (E1301) were purchased from Selleck Chemicals. All compounds were dissolved in dimethyl sulfoxide (DMSO) for in vitro experiments. Unless otherwise stated, abemaciclib and palbociclib were used at 500 nM, INX-315 at 300 nM, fulvestrant at 5 nM and imlunestrant at 40 nM.
For bromodeoxyuridine (BrdU)-based cell-cycle analysis, MCF7, OVCAR-3 and Kuramochi cells were treated with DMSO or abemaciclib, palbociclib or INX-315 for 2 days. ZR-75-1 cells were treated for 4 days with abemaciclib or palbociclib. For CUT&RUN chromatin profiling, MCF7, OVCAR-3 and Kuramochi cells were treated for 2 days, whereas ZR-75-1 cells were treated for 4 days. For dose-matrix drug-combination assays, cells received abemaciclib and fulvestrant in a dose matrix delivered using a Tecan D300e Digital Dispenser for 5 days.
For hormone-deprivation and oestradiol-stimulation experiments, cells were grown in phenol-free RPMI-1640 (11835030, Gibco) supplemented with 1× GlutaMAX, 1% HEPES and 10% charcoal-stripped FBS. Oestradiol (E2758, Sigma), dissolved in ethanol, was used at 1 nM.
Flow-cytometry cell-cycle analysis
Thirty minutes before the experimental endpoint, cells were labelled with 10 μM BrdU (B5002, Sigma). Cells were stained with Near-IR Fixable Viability Stain (L34976, Invitrogen) for 20 min at room temperature, then fixed and permeabilized using the FoxP3/Transcription Factor Staining Buffer Set (00-5523-00, eBioscience). DNA was denatured with 2 N HCl containing 0.5% (v/v) Triton X-100 for 30 min. The acid was neutralized with 0.1 mol l−1 Na2B4O7•10H2O (pH 8.5), followed by washing with 0.5% BSA in PBS. Cells were incubated for 1 h with BrdU antibody (clone 3D4, 560209, BioLegend; 1:20). DNA was stained with FxCycle Violet Stain (F10347, Invitrogen) before acquisition on a BD A3 Symphony flow cytometer. At least 10,000 live-cell events were collected per sample. Data were analysed using FlowJo (v10.8.1).
Dose-matrix drug-combination assays
Automated cell counting
Cells were fixed by adding 16% paraformaldehyde (PFA; C004, ProSciTech) to the culture medium to achieve a final concentration of 4% PFA. Cells were incubated at room temperature for 10–15 min, washed and stained with a DAPI (D1306, Invitrogen)–Hoechst 33342 (H1399, Thermo Fisher) solution containing 0.19% Triton X-100, 2.5 μg ml−1 DAPI and 5 μg ml−1 Hoechst in 50 mM Tris, pH 7.6. Stained nuclei were imaged using a Cellomics CX7 LED or LZR system (Thermo Fisher). The CX7 software segmented and counted nuclei, and the resulting cell counts were used for drug-synergy analysis.
EdU-based cell-cycle analysis
Cells were incubated with 10 μM EdU at 37 °C for 45 min. PFA was added to a final concentration of 3.7% to fix the cells. EdU incorporation was detected using the Click-iT EdU Cell Proliferation Kit for Imaging (C10340, Thermo Fisher) according to the manufacturer’s instructions. After removal of the staining solution, cells were washed once with PBS containing 3% BSA. Nuclei were stained with DAPI and Hoechst as described above. EdU and nuclear signals were captured using the CX7 LZR. Single-cell data were analysed with CellProfiler (v3.0.0), and the percentage of S-phase cells was used for synergy analysis.
Cell-death analysis
Culture medium and PBS washes were collected from each well to recover floating and dead cells. Adherent cells were trypsinized and combined with the collected cells. Samples were centrifuged at 400g for 4 min at 4 °C and washed twice with PBS. Cells were stained with 80 μl propidium iodide from the Annexin V/PI Kit (556547, BD), diluted 1:20 in 1× binding buffer, on ice for 15 min according to the manufacturer’s protocol. Samples were analysed using an LSR II flow cytometer and BD FACSDiva software (v9.0). Live and dead-cell percentages were calculated with FlowJo (v10.5.3) and used for synergy analysis.
Drug-synergy analysis
Loewe synergy scores were calculated using the SynergyFinder R package (v3.14.0)42. Data visualization was performed with ggplot2 (v3.2.5).
Cell-proliferation assays
Live cells constitutively expressing H2B–GFP were imaged at multiple time points using the Incucyte SX5 platform. Cells were segmented according to GFP fluorescence, and the resulting images were used to determine cell counts and proliferation over time.
In vivo mouse experiments
The KCC-P-3837 patient-derived xenograft (PDX) model was described previously43. All in vivo experiments used NOD.Cg-PrkdcscidIl2rgtm1Wjl (NSG) mice. Animals were housed under specific pathogen-free conditions at 19–21 °C and 40–60% relative humidity, with unrestricted access to food and water. Mice were maintained on a 14-h light–10-h dark cycle, with lights on at 07:00 and off at 20:00, including 30-min dawn and dusk transitions. Red lighting was used during the dark phase. Sample sizes were selected according to prior experience with the PDX model; no formal statistical method was used for prospective sample-size calculation. Age-matched mice were randomized into treatment groups with equivalent mean tumour volumes before treatment. Immunohistochemistry and downstream tissue-image analyses were performed blinded to treatment allocation.
Rb chromatin profiling and immunohistochemistry in PDX tumours
Tumour fragments measuring 1–2 mm3 were implanted into the thoracic mammary fat pads of 7-week-old female NSG mice obtained from the Peter MacCallum Cancer Centre Animal Facility. Mice were implanted with 0.3 mg oestradiol silicon pellets. When tumours reached approximately 250 mm3, calculated as width2 × length × 0.5, animals were randomized to abemaciclib or vehicle treatment. Abemaciclib and vehicle formulations were prepared as described previously44. Mice received 90 mg kg−1 abemaciclib by daily oral gavage for five doses. Animals were euthanized by CO2 asphyxiation or cervical dislocation 2–4 h after the final dose. All procedures complied with federal regulations and institutional guidelines and were approved by the Animal Ethics Experimentation Committee of the Peter MacCallum Cancer Centre. Humane endpoints included a tumour diameter of at least 15 mm, weight loss of at least 20%, tumour ulceration or infection, impaired ambulation, laboured breathing, impaired movement or ruffled fur. No mice reached the approved humane endpoints during the study.
RNA sequencing and tumour-growth studies
The KCC-P-3837 PDX model has been described previously43. During surgery, 4-mm3 tumour sections were implanted into the left and right fourth inguinal mammary glands of 6–8-week-old female NSG mice obtained from Australian BioResources. Tumour growth was monitored by calliper measurement. Mice were randomized to treatment groups when tumours reached 200–250 mm3. Animals received palbociclib (100 mg kg−1 in water, administered by oral gavage 5 days per week), fulvestrant (5 mg per mouse in 100 μl peanut oil, administered by weekly subcutaneous injection), the palbociclib–fulvestrant combination or vehicle controls. One cohort was treated for 56 days to generate tumour-growth kinetics. A second cohort was treated for 19 days, then euthanized by CO2 exposure and cervical dislocation. Tumours were removed, processed and snap frozen immediately after euthanasia. All procedures and humane endpoints were approved by the Garvan Institute of Medical Research Animal Ethics Committee. Mice were monitored for tumour burden and clinical signs of distress. Humane endpoints included ulceration, necrosis, infection, local invasion, impaired mobility, inability to access food or water, ascites, body-weight loss of at least 20% or other evidence of compromised welfare. Animals were euthanized when tumour volume reached or exceeded 1,500 mm3; because euthanasia followed tumour measurement, the final recorded volume occasionally exceeded this limit.
CRISPR–Cas9 gene editing
Alt-R S.p. Cas9 nuclease-purified Cas9 protein (1081059, Integrated DNA Technologies (IDT)) and custom IDT single-guide RNAs (sgRNAs) were combined at a 1:5 molar ratio to generate ribonucleoprotein (RNP) complexes. Each nucleofection used 36.6 pmol Cas9 and 150 pmol sgRNA. RNPs were incubated at room temperature for 10 min. Cells were suspended in SF Cell Line Nucleofector solution (V4XC-2032, Lonza) containing the Cas9–sgRNA complexes. Nucleofection was performed using the Lonza 4D-Nucleofector X Unit with the MDA-MB-453 programme.
The sgRNA sequences were as follows: RB1, sgRB1-2: 5′-AAA CAA TCA AAG GAC CGA GA; KRT18 enhancer, gRNA-1A: 5′-CAG GGC TCT AGA GTT CAC AG, gRNA-1B: 5′-AGC TTG GCA GCA GAG GAG GG, gRNA-2A: 5′-GTG GTG GCG GTA AGA GTC TG and gRNA-2B: 5′-GTG GGG AGG AGT TTT CAC AG; CCND1 enhancer #1, set 1A: 5′-ACACAAGACACGCTGCACGG, set 1B: 5′-AGGAAGCTTGCTGAACACCG, set 2A: 5′-GAGGTTACCCCTCATAATGG and set 2B: 5′-GGGGTCAAGAGGAAGCTTAG; CCND1 enhancer #2, set 1A: 5′-GAGCTGACTCGATTTGCCCG, set 1B: 5′-GCAGCACTCTGTACCCAGAA, set 2A: 5′-TGTTTCTGAGATCACAGGCG and set 2B: 5′-TCAGTGGTTTGCAGAGACGT; non-targeting control, sgControl: 5′-CAT TTC TCA GTG CTA TAG AG.
Generation of isogenic RB1-knockout cell lines
Viable edited cells, identified by negative staining with 1 μg ml−1 propidium iodide, were single-cell sorted using a BD FACSAria Fusion 3 or 5 flow cytometer into 96-well plates. Genomic DNA was PCR amplified using forward primer 5′-CTG TCC CTT GAA TGT TTG GTA G and reverse primer 5′-TCT GGA GAG GAA GAT TAA GAG GAC. PCR products were analysed by Sanger sequencing. Cell lysates were screened for RB1 knockout by western blotting. Confirmed knockout clones were expanded and cryopreserved for subsequent experiments.
Generation of nuclear GFP-expressing cells
H2B–GFP-expressing cell lines were generated with the lentiviral plasmid LV-GFP (Addgene #25999). Lentivirus was produced in HEK 293T cells transfected with FuGENE HD (E2311, Promega), pCMV-VSVG (Addgene #8454), pRSV-REV (Addgene #12253), pMDLg/pRRE (Addgene #12251) and LV-GFP. Concentrated lentivirus was used to transduce the cell lines. Ten days after transduction, GFP-positive cells were sorted using BD FACSAria Fusion 3 or 5 flow cytometers, selecting cells with 50–75% fluorescence intensity. At least 400,000 cells were collected after sorting, and cell identity was confirmed again by STR profiling.
siRNA gene-knockdown assays
Adherent cells were transfected with siRNA complexes prepared using DharmaFECT 3 Transfection Reagent (T-2003, Horizon Discoveries) in Opti-MEM (31985062, Gibco). After 24 h, the medium was replaced with fresh culture medium containing the indicated drug treatment or DMSO control. Knockdown efficiency was assessed by quantitative PCR (qPCR) with reverse transcription or by 3′ RNA sequencing.
siRNAs were purchased from Horizon Discoveries. CCND1 was targeted with siCCND1-1 (J-003210-17) and siCCND1-2 (J-003210-18). KDM5A was targeted with siKDM5A-1 (J-003297-22) and siKDM5A-2 (J-003297-23). A non-targeting siControl (DHA-D-001810-01-05) was used as the control.
Chromatin profiling methods
Cell-line sample preparation
Cells were detached with TrypLE (12604021, Gibco), centrifuged at 400g and resuspended in fresh complete medium. Cell numbers were determined manually using a haemocytometer, with the mean of two counts recorded for each sample.
CUT&RUN, library preparation and sequencing
The CUT&RUN Assay Kit (86652, CST) was used according to the manufacturer’s protocol, with all buffers prepared as specified. Each reaction contained 500,000 cells. Cells were washed, bound to Con A beads and incubated overnight at 4 °C with primary antibody. Following a digitonin-buffer wash, pA/G-MNase was added and incubated at 4 °C for 1 h. Cells were washed twice, and calcium chloride was added to activate MNase-mediated chromatin cleavage for 30–60 min at 4 °C. The STOP buffer was modified by adding 0.1% SDS, proteinase K and 300 mM NaCl. Samples were incubated at 55 °C for 1 h for cell-line samples or overnight for tumour tissue, then centrifuged at 16,000g for 2 min at room temperature. Supernatants were purified using the CST DNA Purification Buffers and Spin Columns kit (14209). CUT&RUN DNA was size selected with AMPure XP beads (A63881, Beckman Coulter): 0.5× beads removed large fragments, followed by an additional 1.3× volume to achieve a total ratio of 1.8×. Beads were washed twice with 80% ethanol, and DNA was eluted in 10 mM Tris, pH 8.0. DNA concentration and fragment size were measured with the TapeStation D1000 High Sensitivity kit (5067-5584 and 5067-5585, Agilent) on an Agilent TapeStation 4150.
Primary antibodies were Rb (clone 4H1; 61121, CST; 1 μg per cell-line reaction and 1.5 μg per tumour-tissue reaction), ER (8644, CST; 0.8 μg), H3K4me3 (9751, CST; 1 μg), KDM5A (ab194286, Abcam; 1 μg), mouse IgG2a (61656, CST; 1 μg per cell-line reaction and 1.5 μg per tumour-tissue reaction) and rabbit IgG (66362, CST; 1 μg).
DNA concentration was determined from TapeStation readings for fragments between 100 and 700 bp. Libraries were prepared with the NEBNext Ultra II DNA Library Prep Kit (E7645S, NEB) and Unique Dual Indices (E6440S, NEB), following the CST DNA Library Prep Kit for Illumina protocol optimized for CUT&RUN. Modifications included adaptor dilution, AMPure XP bead ratios, PCR-cycle number and a shortened 13-s PCR annealing and extension step. Amplified libraries were purified with AMPure XP beads and eluted in 10 mM Tris, pH 8.0. Libraries were quantified with the TapeStation D1000 kit (5067-5582 and 5067-5583, Agilent), pooled and sequenced on an Illumina NextSeq 2000 platform using paired-end sequencing, generating 5–10 million clusters per sample.
Tumour-tissue sample preparation
Tumours were removed from euthanized mice and rinsed with PBS. Each tumour was cut longitudinally and sliced into thin sections with a microtome blade. Approximately 4 mm × 4 mm × 1 mm tissue pieces were generated, with one piece used for each DynaTag reaction.
DynaTag assay, library preparation and sequencing
A modified CUT&Tag procedure, known as cleavage under DynaTag and adapted from Hunold et al., was used21. Tissue slices were washed in DynaTag buffer containing 25 mM HEPES, pH 7.5 (15630-080, Gibco), 110 mM KCl (AM9640G, Invitrogen), 10 mM NaCl (AM9760G, Invitrogen), 1 mM MgCl2 (AM9530G, Invitrogen), 1× spermidine (27287S, CST) and 1× protease inhibitor cocktail (7012L, CST). Samples were bound to Con A beads and incubated overnight at 4 °C with Rb antibody (61121, CST) or mouse IgG2a in antibody buffer consisting of DynaTag buffer, 1% w/v BSA (A8577, Sigma; 10 ml) and digitonin (16359L, CST). Anti-mouse secondary antibody (0.5 μg; ab46540, Abcam) and preloaded pA–Tn5 complex (1:100 dilution; C0107001, Diagenode) were each incubated at room temperature for 1 h. Tagmentation was initiated by incubating samples at 37 °C for 1 h in antibody buffer containing 10 mM MgCl2. Samples were then resuspended in denaturation buffer containing 10 mM Tris-HCl (15568-025, Invitrogen), 50 mM NaCl (AM9760G, Invitrogen), 0.2% SDS (15553-035, Invitrogen), 0.15 mg ml−1 proteinase K (10012S, CST) and 16.67 mM EDTA (15575020, Invitrogen), followed by incubation at 58 °C for 3 h. Tagmented DNA was purified with the MinElute PCR Cleanup Kit (28004, Qiagen). Libraries were prepared using Illumina DNA/RNA UD Indexes Set A, Tagmentation (20091654, Illumina) and NEBNext 2× PCR Mix (M0541L, NEB). Amplified DNA was cleaned with AMPure XP beads and eluted in EB buffer. Libraries were quantified with the TapeStation D1000, pooled and sequenced on an Illumina NextSeq 2000 platform using paired-end sequencing, generating 5–10 million clusters per sample.
RNA extraction
Total RNA was extracted using the NucleoSpin RNA plus kit (740984, Macherey-Nagel) according to the manufacturer’s instructions.
Reverse-transcription quantitative PCR
RNA was reverse transcribed into cDNA using the High-Capacity cDNA Reverse Transcription Kit (4368814, Thermo Fisher). Quantitative PCR was performed with SYBR Select Master Mix (4472919, Applied Biosystems) on an Applied Biosystems StepOne Plus instrument. Relative expression was calculated using the ΔΔCt method. Primer sequences were: KRT18 forward, 5′-TCG CAA ATA CTG TGG ACA ATG C; reverse, 5′-GCA GTC GTG TGA TAT TGG TGT; MKI67 forward, 5′-AGA AGA AGT GGT GCT TCG GAA; reverse, 5′-AGT TTG CGT GGC CTG TAC TAA; TK1 forward, 5′-GCC AAA GAC ACT CGC TAC AG; reverse, 5′-CCC CTC GTC GAT GCC TAT G; CCND1 forward, 5′-GCT GCG AAG TGG AAA CCA TC; reverse, 5′-CCT CCT TCT GCA CAC ATT TGA A; and HSP90AB1 housekeeping control forward, 5′-AGA AAT TGC CCA ACT CAT GTC C; reverse, 5′-ATC AAC TCC CGA AGG AAA ATC TC.
RNA library preparation and sequencing
RNA libraries were prepared using the Quanteq Lexoen 3′ mRNA FW kit by the Peter MacCallum Cancer Centre Molecular Genomics Core. Single-end 100-bp reads were generated on an Illumina NextSeq 2000 platform, with a target depth of 3–5 million reads per sample.
Western blot analysis
Protein lysate preparation
For ER detection, protein lysates were prepared in 1× cell lysis buffer (CST) as described previously23. For Rb and KDM5A analysis, equal numbers of cells were lysed in 4× Laemmli sample buffer (1610747, Bio-Rad), diluted to 1× with water and supplemented with 5% β-mercaptoethanol. Samples were heated to 95 °C for 13 min.
Western blotting procedure
Western blotting was performed as described previously23. Primary antibodies included Rb (554136, BD; 1:1,000), phospho-Rb S780 (8180, CST; 1:1,000), phospho-Rb S807/811 (8516, CST; 1:1,000), ER (8644, CST; 1:1,000), KDM5A (ab194286, Abcam; 1:5,000), histone H3 (9715, CST; 1:1,000), cyclin D1 (55506, CST; 1:1,000), KRT18 (4548, CST; 1:1,000), TFF1 (15571, CST; 1:1,000), cyclin A2 (ab32386, Abcam; 1:1,000), actin (A3854, Sigma-Aldrich; 1:10,000) and vinculin (V9131, Sigma-Aldrich; 1:5,000). Secondary antibodies were StarBright Blue 520 goat anti-mouse IgG (12005867, Bio-Rad) and StarBright Blue 700 goat anti-rabbit IgG (12004162, Bio-Rad), each diluted 1:2,500. Blots were imaged with a ChemiDoc MP Imaging System (Bio-Rad) and analysed using Image Lab Software (v6.1).
Immunohistochemistry of tumour tissue
Tumours collected from euthanized mice were fixed immediately in 10% neutral-buffered formalin overnight and stored in 70% ethanol. Samples were dehydrated with ethanol and xylene, embedded in paraffin and sectioned at 10 μm. Sections were dewaxed, rehydrated and subjected to heat-mediated antigen retrieval in citrate buffer, pH 6.0. After washing, sections were treated with 3% hydrogen peroxide for 5 min and incubated for 1 h at room temperature with antibodies against Ki-67 (ab16667, Abcam), phospho-Rb Ser807/811 (8516, CST) and total Rb (554136, BD Biosciences). ImmPRESS anti-rabbit (MP-7451-NB, Novus) or anti-mouse (MP-7452-NB, Novus) secondary antibodies were used. Signal was developed with the Dako Liquid DAB+ Substrate Chromogen System (K3468, Agilent Technologies), followed by haematoxylin counterstaining. Whole-slide images were captured with an Olympus SLIDEVIEW VS200 microscope, and positive tumour cells were quantified using QuPath45.
Nuclear co-immunoprecipitation
Nuclear co-immunoprecipitation (co-IP) was performed with the Active Motif Nuclear Complex Co-IP kit (54001, Active Motif), following the manufacturer’s protocol. Nuclei were isolated with hypotonic buffer, and nuclear lysates were generated using the digestion cocktail. Lysates were precleared with mouse IgG2a (61656, CST) or rabbit IgG (ab37415, Abcam) bound to protein A/G Dynabeads (10002D and 10004D, Thermo Fisher) for 1–3 h at 4 °C. Cleared lysates were incubated overnight at 4 °C with primary antibody in 1× low buffer, followed by addition of protein A/G Dynabeads for 1 h at 4 °C. Beads were washed six times with 1× low buffer. Proteins were eluted in 4× Laemmli sample buffer (1610747, Bio-Rad), diluted to 2× with water and supplemented with 10% (v/v) β-mercaptoethanol. Samples were heated to 95 °C for 5 min. Co-IP antibodies included Rb (9039, CST), ER (8644, CST), mouse IgG2a (61656, CST) and rabbit IgG (ab37415, Abcam).
Mass spectrometry sample preparation and analysis
Peptide preparation
Samples recovered from nuclear co-IP were reduced with 5 mM TCEP (646547-10X1ML, Merck), alkylated with 20 mM methyl methanethiosulfonate (23011, Thermo Fisher) and acidified with phosphoric acid (695017-100ML, Sigma-Aldrich). Samples were loaded onto S-Trap Micro Spin Columns (Protifi) and digested overnight with trypsin (90057, Thermo Fisher) at 37 °C. Peptides were sequentially eluted with 50 mM Tris-HCl, pH 8.5, 0.2% formic acid (695076-100ML, Sigma-Aldrich) and 50% acetonitrile (1000291000, Merck). Eluates were snap frozen in liquid nitrogen and freeze dried overnight. Before mass spectrometry, samples were resuspended in 30–40 μl resuspension buffer containing 2% acetonitrile and 0.05% trifluoroacetic acid in mass-spectrometry-grade water. Samples were briefly sonicated in a water bath, centrifuged at maximum speed for 10 min and the upper 15 μl of each supernatant was collected.
Data-independent acquisition mass spectrometry
Liquid chromatography–tandem mass spectrometry was performed on an Orbitrap Ascend mass spectrometer (Thermo Fisher Scientific) as described previously46. The Ultimate 3000 liquid-chromatography system used an Acclaim PepMap nano-trap column (Dionex C18, 100 Å, 75 µm × 2 cm) and an Acclaim PepMap RSLC analytical column (Dionex C18, 100 Å, 75 µm × 50 cm). Tryptic peptides were loaded at 5 μl min−1 for 6 min in 2% (v/v) acetonitrile containing 0.05% (v/v) trifluoroacetic acid before the enrichment column was switched in-line with the analytical column. Solvent A was 0.1% (v/v) formic acid in water, and solvent B was 100% (v/v) acetonitrile containing 0.1% formic acid; both solvents contained 5% DMSO. The gradient ran at 300 nl min−1: 0–6 min, 3% B; 6–7 min, 3–4% B; 7–82 min, 4–25% B; 82–86 min, 25–40% B; 86–87 min, 40–80% B; 87–90 min, 80–3% B; and 90–90.1 min, 80–3% B, followed by 10 min equilibration at 3% B.
For DIA experiments, full MS scans were acquired at 120,000 resolution at m/z 200 across 350–1,400 m/z in profile mode. The full-MS AGC target was 250%, with a 50-ms injection time. Fragment-scan AGC target was 2,000%. Fragmentation used 50 windows of 13.7 Da with a 1-Da overlap. MS2 resolution was 30,000, maximum injection time was 55 ms and normalized collision energy was 30%. Data were collected in centroid mode with positive-ion polarity.
Bioinformatic and statistical analysis
RNA sequencing analysis
FASTQ files were adapter- and quality-trimmed with BBDuk (v38.90) using bbduk.sh47 and the following settings: ktrim = r, k = 23, mink = 11, hdist = 1, tpe, tbo, qtrim = r, trimq = 5 and minlen = 20. Trimmed reads were aligned to the hg38 reference genome (GRCh38.p15; https://www.ncbi.nlm.nih.gov/assembly/GCA_000001405.15) with STAR (v2.7.5b)48. Mouse-derived reads in PDX samples were removed with XenofilteR (v1.6)49. Read counts were generated with featureCounts in the Subread package (v2.0.1)50 using GENCODE annotations (gencode.v35.annotation.gtf51). Counts were normalized using the DESeq2 median-of-ratios size-factor method. Differential expression was assessed with DESeq2 (v1.46.0)52, with adjusted P < 0.05 defining differential expression.
Heatmaps were generated with ComplexHeatmap (v2.22.0)53. Gene-level z-scores were calculated from DESeq2 size-factor-normalized counts. Genes were hierarchically clustered using Euclidean distance and complete linkage.
Microarray analysis
Raw microarray data from palbociclib-treated and untreated patients were obtained from a previous publication27 (http://microarrays.curie.fr/publications/U981-GustaveRoussy/pop/). All participants provided written informed consent, and ethics approvals and trial procedures were reported previously27. The analysis included ER-positive, human epidermal growth factor receptor 2 (HER2)-negative patients: 18 untreated controls and 44 palbociclib-treated patients. Raw CEL files were imported into R using read.celfiles from the oligo package. Robust multichip average normalization was performed with the target = ‘core’ parameter. Probesets were mapped to gene symbols using hugene21sttranscriptcluster.db and the annotateEset function from affycoretools. Low-expression genes were removed using a median-intensity threshold of 1.5, selected by visual inspection of transcript-median histograms54. Differential expression was analysed with limma55.
Gene-set enrichment analysis
Gene-set enrichment analysis (GSEA) was conducted with clusterProfiler (v4.14.6)56. Hallmark gene sets were obtained from the Molecular Signatures Database (MSigDB)25,26 using msigdbr (v24.1.0). Genes in cell-line and PDX RNA-seq datasets were ranked by shrunken log2 fold changes calculated with the adaptive-shrinkage ‘ashr’ method. Genes in the POP clinical transcriptomics dataset were ranked by Wald statistic. Enrichment scores were calculated using the GSEA running-sum statistic. Single-sample GSEA was performed with GSVA (v2.0.7) using α = 0.25.
CUT&RUN and DynaTag sequencing analysis
Adapters and low-quality sequences were removed with BBDuk (v38.90)47 using ktrim = r, k = 23, mink = 11, hdist = 1, tpe, tbo, qtrim = r, trimq = 5 and minlen = 20. Reads were aligned to hg38 (GRCh38.p15; https://www.ncbi.nlm.nih.gov/assembly/GCA_000001405.15) with Bowtie2 (v2.3.4.1), using: –dovetail –local –very-sensitive –no-mixed –no-discordant –phred33 -I 10 -X 700. PDX DynaTag reads were aligned to a hybrid hg38 (GCA)/mm10 genome. mm10 FASTA and annotation files were obtained from UCSC (https://hgdownload.soe.ucsc.edu/goldenPath/mm10/bigZips/). Picard (v3.0.0)57, samtools (v1.9)58 and bedtools (v2.27.1)59 were used to remove reads mapping to blacklisted regions or mitochondrial DNA. Duplicate reads were retained.
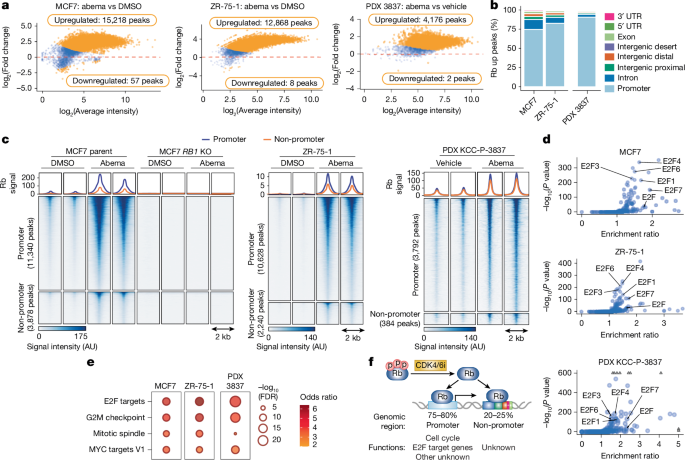
Peaks were identified with MACS2 (v2.2.7.1)60 using matched IgG controls and the options –format BAMPE, -gsize hs and -q 0.05. Broad H3K4me3 peaks were called with –format BAMPE, -g hs, –broad, –broad-cut-off 0.1 and -q 0.05. Differential binding was analysed using DiffBind (v3.16.0)61 with RLE background normalization: method = DBA_DESEQ2, normalize = DBA_NORM_RLE, library = DBA_LIBSIZE_BACKGROUND and background = TRUE. Differential binding thresholds were false discovery rate-adjusted P < 0.1 for CUT&RUN and P < 0.2 for DynaTag.
Genomic peaks were annotated with ChIPseeker (v1.42.0)62. Promoters were defined as −2,000 bp to +500 bp relative to the transcription start site (TSS). Peaks overlapping these regions were classified as promoter peaks; all others were classified as non-promoter peaks.
BigWig files were generated with deepTools bamCoverage using -binSize 20, -smoothLength 60, -scaleFactor scalefactor and -extendReads. Scale factors were derived from DiffBind RLE background normalization. Negative input, H3K4me3 and H3K4me1 tracks were normalized to bins per million mapped reads. Tracks were visualized using Integrative Genomics Viewer63 or deepTools.
Motif enrichment was assessed with HOMER (v4.11) using -size 200, -len 6,10,15,20 and -p 14. Enrichment ratios represent motif frequency in input regions relative to HOMER-generated random genomic backgrounds.
GSEA of genomic regions was performed with ChIP-Enrich (v2.30.0)24, assigning each peak to the gene with the nearest TSS to the peak midpoint. Over-representation analysis (ORA) was performed with clusterProfiler (v4.14.6)56 using genes within 100 kb of regions of interest that were significantly upregulated after treatment (log2 fold change > 0, adjusted P < 0.05). MSigDB hallmark gene sets were used for both analyses. Odds ratios represented observed versus expected frequencies of genes associated with the regions of interest in each gene set.
Rb CUT&RUN and RNA-seq data were integrated with BETA (v1.0.7)22 to evaluate the transcriptional regulatory activity of Rb-bound non-promoter regions. Genes were ranked by BETA regulatory-potential scores, which incorporate the proximity and abundance of Rb-bound regions relative to gene promoters. Regulatory-potential distributions for upregulated and downregulated genes were compared using the one-tailed Kolmogorov–Smirnov test implemented in BETA.
Chromatin-interaction and transcriptional-hub analysis
H3K27ac HiChIP loop data from a previous study (GSE157381)23 were used. Published loop calls binned into 5-kb genomic regions were obtained from the dataset. To identify interactions associated with chromatin-bound Rb, each 5-kb region was assessed for overlap with Rb CUT&RUN peaks using a minimum overlap of 1 bp. Regions overlapping Rb peaks were classified as promoter or non-promoter regions according to the annotation of the overlapping peak. Regions containing both promoter and non-promoter Rb peaks were classified as promoter regions.
For HiChIP ORA, MSigDB hallmark gene sets were tested using protein-coding genes whose promoters were directly connected to non-promoter Rb regions by H3K27ac HiChIP interactions. ER co-occupancy was assessed by annotating all 5-kb windows for overlap with ER CUT&RUN peaks using a minimum threshold of 1 bp.
Transcriptional hubs were identified from the H3K27ac HiChIP interaction network by constructing an igraph object in which 5-kb regions represented nodes and HiChIP interactions represented edges. Network communities were identified using the Louvain algorithm in igraph (v2.1.4)65 with default settings. Protein-coding genes located in hubs containing at least one non-promoter Rb peak were analysed by MSigDB hallmark ORA. Hub visualizations were generated with ggraph (v2.2.2).
Hubs associated with KDM5A, ER and Rb were required to contain at least one non-promoter Rb upregulated peak overlapping a KDM5A consensus peak by more than 1 bp and at least one ER peak, either promoter or non-promoter. Protein-coding genes with promoters located within these hubs were analysed by ORA. For promoter H3K4me3-width analysis, the gene set was further restricted to genes with promoter-associated broad H3K4me3 peaks present in all samples and overlapping the TSS.
Mass-spectrometry data analysis
DIA data were analysed using the directDIA workflow with default Spectronaut settings (v19.9) against the reviewed Homo sapiens UniProt database downloaded in October 2024. Trypsin digestion allowed up to two missed cleavages. Methyl methanethiosulfonate alkylation of cysteine was specified as a fixed modification, while N-terminal acetylation and methionine oxidation were variable modifications. Protein and peptide-spectrum match identifications were filtered at a 1% false discovery rate. Precursors were filtered by Q value, quantified at the MS2 level and normalized across runs automatically.
For differential-binding analysis, raw protein-group quantities from Spectronaut were processed by excluding proteins with two or three missing values in both immunoprecipitation conditions. If one replicate was missing, its value was replaced with the mean of the other two replicates in the same condition. If only one treatment replicate contained a measured value, the two missing values were imputed as zero. Log2-transformed quantities were analysed using limma (v3.62.2)55 with empirical Bayes moderation, and results were visualized with ggplot2.
Additional statistical analyses
Datasets that passed normality testing were analysed with a two-tailed unpaired Student’s t-test or one-way analysis of variance followed by Bonferroni or Tukey multiple-comparisons tests. Non-normally distributed or ranked data were analysed with a two-tailed Wilcoxon rank-sum test.
Replication details for each dataset are provided in the relevant figure legends. No statistical methods were used to predetermine sample sizes.
Reporting summary
Additional information about the study design is provided in the Nature Portfolio Reporting Summary linked to this article.
Source: www.nature.com