


Ethics approval and informed consent
All experiments involving human cell lines were approved by the Harvard University Institutional Review Board (IRB) and Embryonic Stem Cell Research Oversight (ESCRO) committees. Animal experiments followed protocols approved by the Harvard University Institutional Animal Care and Use Committee (IACUC). All work complied with applicable guidelines, regulations and informed-consent requirements for the originating cells and tissues.
Mouse chimeroid experiments and housing conditions
Wild-type CD-1 and C57BL/6 mice were obtained from Charles River Laboratories to establish the mouse-endogenous chimeroid system. Sexes were not determined before experimentation, and embryos of both sexes were collected at embryonic day 11.5 (E11.5). Sample sizes were not established using a predetermined statistical method. Mice were housed in temperature- and humidity-controlled facilities on a 12 h light–dark cycle, with unrestricted access to food and water. Housing temperature was maintained at 20–24 °C and relative humidity at 30–70%.
Human pluripotent stem cell culture
Human pluripotent stem (PS) cell lines were cultured as previously described7,9. Cells were maintained in MTESR1, mTESR+ or StemFlex medium, each supplemented with 1% penicillin–streptomycin, on Falcon culture dishes coated with 1% Geltrex. Cultures were maintained at 37 °C in 5% CO2. All human PS cells were used below passage 55 and tested negative for mycoplasma with the MycoAlert PLUS Mycoplasma Detection Kit.
Authentication and characterization of human PS cell lines
The male psychiatric control Mito210 iPS cell line was provided by B. Cohen, the male PGP1 iPS cell line by G. Church, and the male GM08330 iPS cell line by M. Talkowski. GM08330 was originally derived from Coriell Institute fibroblasts6,7,30. The male H1 human embryonic stem cell line, also known as WA01, was purchased from WiCell. The 11a iPS cell line was obtained from the Harvard Stem Cell Institute, while the female CW50037 iPS cell line was acquired from the California Institute for Regenerative Medicine collection.
Cell lines were authenticated using short-tandem-repeat (STR) analysis, karyotyping, genotyping or single-nucleotide-polymorphism (SNP) profiling. PGP1 and GM08330 were authenticated by STR analysis; 11a by karyotyping; Mito210 by Fluidigm FPV5 genotyping; and CW50037 by Illumina Global Screening Array SNP genotyping. H1 and GM08330 were also authenticated by WiCell STR analysis. The GM08330 parental line carried a previously reported interstitial duplication on the long arm of chromosome 2030; all other lines were karyotypically normal. No commonly misidentified cell lines were used.
Cortical organoid and chimeroid differentiation
Dorsally patterned human cortical organoids were generated using a previously published protocol7. On day 0, feeder-free human PS cells at 75–85% confluence were dissociated into single cells with Accutase. A total of 9,000 cells per well were reaggregated in ultra-low-attachment, V-bottom 96-well plates using the corresponding pluripotent stem cell medium. On day 1, cultures were transferred to cortical differentiation medium I (CDM I), consisting of Glasgow-MEM, 20% knockout serum replacement, MEM-NEAA, pyruvate, 2-mercaptoethanol and penicillin–streptomycin.
ROCK inhibitor Y-27632 was added at 20 μM from days 0–6. The WNT inhibitor IWR1 and TGFβ inhibitor SB431542 were added from days 0–18 at 3 μM and 5 μM, respectively.
Single-donor and multidonor chimeroids were produced as previously described9. Patterned embryoid bodies from days 15–18 were dissociated into single cells using a modified papain protocol. Following morphology assessment, cells were filtered, resuspended in CDM1 containing ROCK inhibitor and, for multidonor chimeroids, mixed in equal proportions. Between 18,000 and 20,000 cells were reaggregated per well. After 2 days, embryoid bodies were transferred to low-attachment dishes and maintained under orbital agitation. Media were changed sequentially to CDM2, CDM3 at DIV35 and CDM4 at DIV70, following established protocols7.
For advanced patterning medium (APM), day-70 organoids were transferred to BrainPhys Basal medium supplemented with N2, B27, penicillin–streptomycin, MEM-NEAA, GlutaMax, amphotericin B, GDNF, BDNF, dCAMP, ascorbic acid and laminin. GDNF and BDNF were used at 20 ng ml−1; dCAMP, ascorbic acid and laminin were added at 1 mM, 200 nM and 1 μg ml−1, respectively. Half of the medium was replaced twice weekly.
Heterochronic and monochronic cultures were generated using the chimeroid approach, with dissociation conditions adjusted for organoid age. Younger organoids were digested with papain for 25 min, whereas older organoids were minced before 45 min of digestion. Heterochronic chimeroids showed a lower success rate, likely because the method requires both adequate patterning in younger tissue and sufficient stemness in older cells. Chimeroids made from older organoids were smaller, consistent with the reduced proliferative capacity of aged neural progenitors. Time-series experiments included at least n = 6 organoids from three batches at stages ranging from 6 months to 5 years.
Mouse neural organoid experiments
Wild-type CD1 and C57BL/6 mice were obtained from Charles River Laboratories. Pregnant dams were euthanized and embryos were staged according to Theiler criteria. Neocortices from E11.5 embryos were dissected, and 15–20 stage-matched embryos were pooled per experiment before dissociation.
The human chimeroid dissociation method was adapted for mouse progenitors. Dissociated cells were seeded at 12,000 cells per well and allowed to aggregate overnight. Cultures were maintained in CDM2 for 3 days, CDM3 from day 4 and CDM4 from day 6. SATB2-positive nuclei were quantified in monochronic old, monochronic young and heterochronic cultures at 1 day and 2.5 days after mixing. At D1AM, binomial generalized linear models adjusted for batch were evaluated using likelihood-ratio tests. Estimated marginal means and Tukey-adjusted pairwise comparisons were calculated with emmeans. At D2.5AM, estimated marginal means and pairwise comparisons were calculated without batch adjustment because only one batch was available.
For neuronal labeling, aggregating cells were incubated with AAV particles expressing GFP under the CAG promoter. The PHPeB serotype was used for efficient central nervous system transduction36. Organoids were fixed and imaged approximately 3 weeks after aggregation using an LSM900 microscope. Images were processed in ImageJ v.2.14.0/1.54f. The pAAV-CAG-GFP plasmid was obtained from Addgene (37825).
Statistical analysis and experimental design
Organoids selected for analysis or treatment were representative of the morphology observed in each differentiation batch. Samples were collected without a predefined selection hierarchy. Investigators were not blinded; however, uniform analytical criteria were applied to every sample, and bioinformatics workflows were performed without genotype-based adjustments. Sample sizes were not predetermined statistically. At least three organoids were used per experiment, based on reproducibility demonstrated in previous studies6,7,30.
Sample fixation and cryosectioning
Organoids were fixed overnight in 4% paraformaldehyde (PFA) at 4 °C, washed three times in PBS and cryoprotected overnight in 30% sucrose in PBS. Samples were embedded in warm gelatin containing 10% bovine gelatin and 7.5% sucrose. Gelatin-coated moulds were polymerized, chilled, frozen in an ethanol and dry-ice bath, and stored at −80 °C until sectioning.
Immunohistochemistry of cortical organoids
Organoid sections measuring 14–18 μm were cut using a Leica cryostat. Sections were stabilized, blocked with 10% donkey serum and 0.3% Triton X-100, and incubated overnight with primary antibodies listed in Supplementary Table 15. After washing, sections were incubated for 1 h with secondary antibodies, washed again and stained with DAPI to visualize nuclei. Organoids older than 1 year showed reduced staining specificity and increased background. Therefore, fresh-frozen immunohistochemistry was used for 2–3-year organoids.
Immunohistochemistry using fresh-frozen sections
Human brain organoids aged 2–5.8 years were rinsed with PBS, embedded directly in OCT compound and rapidly frozen. Ten-micrometre sections were collected serially from depths of 0–150 μm on Superfrost Plus Gold slides. Sections were fixed in ice-cold methanol at −20 °C, rinsed, permeabilized and blocked with serum-containing buffers. Alexa-Fluor-conjugated NeuN/RBFOX3 antibodies were incubated for 1–2 h, followed by DAPI staining and ProLong Gold mounting. Images were acquired with LSM900 software and processed in ImageJ. NeuN-positive nuclei were detected to a depth of approximately 80 μm.
Hypoxia detection with the Hypoxyprobe assay
Hypoxyprobe (pimonidazole HCl) was applied to three 1-year-old CDM4 organoids at a final concentration of 100 µM. Samples were incubated for 1.5 h at 37 °C in 5% CO2, washed, fixed in 4% PFA, embedded and sectioned at 14 µm. Immunohistochemistry was performed according to the manufacturer’s instructions using the supplied primary antibody at a 1:50 dilution6.
Whole-organoid immunofluorescence
Organoids were washed in PBS containing 0.4% BSA and fixed for 30 min in 4% PFA. Samples were stored in PBS with 0.1% Tween-20. Permeabilization, blocking and antibody staining followed published protocols41. Nuclei were counterstained with DAPI, organoids were optically cleared using RIMS and samples were mounted as previously described41,42. Images were acquired on Zeiss LSM880 and LSM900 microscopes using a ×40 objective. Nuclei were segmented and quantified with ZEN blue and Intellesis software. SATB2-positive nuclei were identified by intensity thresholding across organoid z-stacks.
Microscopy and image processing
Immunofluorescence images were acquired with a Zeiss Axio Imager.Z2 using a ×20 objective and Apotome optical sectioning. Zen Blue was used for tile stitching and deconvolution. LSM900 z-stacks were collected at 3 μm intervals and stitched in Zen Blue. Fiji v.43 was used for projections, channel merging and scale-bar placement. Brightness and contrast adjustments were applied uniformly to complete images.
SATB2 and FOS quantification
Nine-month organoids from H1, PGP1 and 11a genetic backgrounds were analyzed in CDM4 and APM conditions, using three organoids per condition and line. Three DAPI-selected regions from three sections per organoid were imaged. Z-stacks were acquired with a Zeiss system using a 20× objective and quantified in Fiji. SATB2-positive cells were defined as DAPI-positive nuclei with elevated SATB2 signal and subsequently evaluated for FOS expression.
Bulk RNA sequencing of brain organoids
Snap-frozen organoids were lysed in RLT buffer containing β-mercaptoethanol. RNA was extracted with DNase treatment using the RNeasy kit. Ten nanograms of RNA were used for Smart-Seq Pico total RNA library preparation with ZapR depletion and unique molecular identifiers. Libraries were quantified, pooled and sequenced on an Illumina NextSeq 2000 system.
DNA extraction and DNA methylome analysis
Genomic DNA extraction and whole-genome bisulfite sequencing
Genomic DNA was extracted from organoids using a previously described protocol44. Samples were lysed with genomic lysis buffer, proteinase K and nuclease-free water and incubated at 55 °C for 4–7 h. DNA was purified by phenol:chloroform extraction, precipitated with glycogen, sodium chloride and ethanol, washed with 70% ethanol, air-dried and resuspended in low-EDTA TE buffer.
DNA was fragmented by Covaris sonication and purified with the DNA Clean & Concentrator kit. Fragment sizes were assessed with an Agilent TapeStation and ranged from 237–322 bp. Bisulfite conversion was performed with the EZ DNA Methylation-Gold kit. Libraries were prepared using the xGen-Methyl-Seq DNA Library Prep kit with unique dual-index primers and seven PCR cycles. After AMPure XP purification and quality control, libraries were sequenced on Illumina NovaSeq 6000 and Element Biosciences Aviti platforms to generate 150-base paired-end reads, targeting 800–900 million reads per sample.
Whole-genome bisulfite sequencing data processing
Raw reads were adapter- and quality-trimmed with cutadapt45 v.4.6 and aligned to the human hg19 reference genome using BSMAP46 v.2.90. Hg19 was retained to ensure coordinate compatibility with previously generated reference datasets, annotation resources and epigenetic-clock analyses. All samples were processed uniformly. Sorted and indexed BAM files were generated with samtools47, and duplicate reads were removed with GATK MarkDuplicates48. Methylation rates were called using MOABS mcall49.
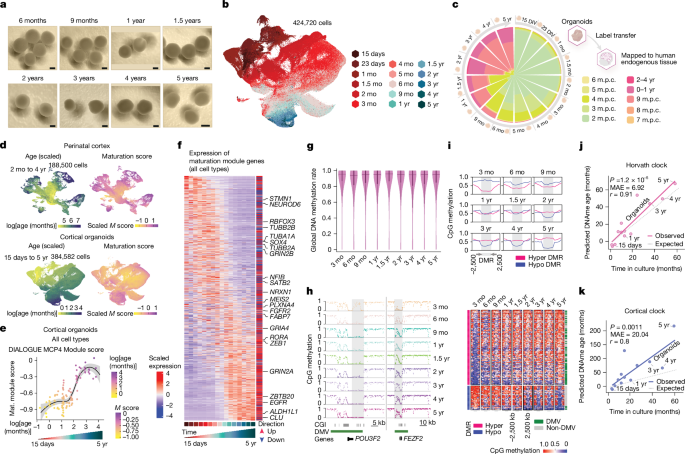
Analyses were restricted to autosomes and CpG sites covered by 10–150 reads. Global methylation was calculated as the arithmetic mean across sites. Regional methylation was calculated across genomic bins, partially methylated domains, highly methylated domains, DNA methylation valleys, repeats, cancer-associated differentially methylated regions and superenhancers using UCSC bigWigAverageOverBed. Regions were included only when at least three CpGs were covered.
Endogenous brain methylation comparison
Postnatal human brain cdDMRs were obtained from ref. 14, including hg19 coordinates and six cell-type-specific methylation trajectory clusters. Mean methylation was calculated for each organoid sample using bigWigAverageOverBed. Linear regression was used to estimate methylation change over time in culture. A region was classified as temporally dynamic when the absolute slope was at least 0.1/60, corresponding to a minimum methylation change of 0.1 over 60 months. Fetal brain DNA methylation age was estimated with the FetalClock function from ref. 18 using the published GitHub implementation.
Differential DNA methylation analysis
Differentially methylated regions (DMRs) were identified with metilene50 v.0.2-8. DMRs required a minimum absolute methylation difference of 0.1, no more than 300 nucleotides between neighboring CpGs, at least 10 CpGs and a Bonferroni-adjusted q < 0.05. Regions were classified as hypo-DMRs or hyper-DMRs according to the direction of change and annotated to CpG islands and DNA methylation valleys using a minimum overlap of 1 bp. Nearest genes were assigned with GREAT51 v.4.0.4.
Temporal DMRs were identified by comparing 3-month and 5-year cultures and retaining regions with an absolute Pearson correlation of at least 0.6 between culture time and methylation. APM-associated DMRs were identified by comparing 9-month and 1-year organoids cultured in CDM4 with age-matched organoids cultured in APM.
Genomic feature annotation
CpG island coordinates were obtained from the UCSC Genome Browser. CpG shores were defined as 2 kb flanking regions, and CpG shelves as the additional 2 kb regions flanking the shores. DNA methylation valleys were identified from HUES64 embryonic stem cell whole-genome bisulfite sequencing data using a sliding-window approach52,53. Five-kilobase windows with 1 kb steps were generated using bedtools54, and low-methylated regions containing at least 10 CpGs were merged after excluding CpGs within CpG islands.
Highly methylated domain and partially methylated domain annotations were obtained from GitHub55. Repeat annotations were taken from the hg19 UCSC RepeatMasker track, excluding alternative haplotypes, fix patches and mitochondrial DNA.
Epigenetic clock analysis
Low-coverage CpG methylation values were imputed with boostme v.0.1.0 using bsseq objects. Imputed values above one were capped at one. Probe identifiers were mapped to genomic coordinates using the Illumina EPIC hg19 manifest. The pan-tissue human methylation clock was applied with the DNAmAge function from methylclock17,56, while cortical methylation age was estimated with CorticalClock57. Accuracy was assessed using median absolute error and Pearson correlation between organoid culture time and predicted methylation age.
Mitotic history was assessed by measuring methylation at solo-WCGW CpGs, which are susceptible to methylation loss during cell division55. Mean methylation was calculated for all solo-WCGWs, solo-WCGWs within common partially methylated domains and sites represented on the HM450 array.
Methylation at non-CpG sites
Forebrain superenhancer regions were obtained from a published dataset of fetal human brain tissue and cerebral organoids15. Mean methylation at non-CpG sites was compared with background methylation across genome-wide 30 kb bins, excluding bins that overlapped superenhancers.
Locus-specific methylation trend plots
For each region of interest, mean methylation was calculated with bigWigAverageOverBed using regions containing at least three CpGs. Linear regression modeled methylation as a function of culture time in months. Results were displayed as scatterplots with fitted regression lines, 95% confidence intervals and Pearson correlation values.
Data visualization and plotting
Unless otherwise stated, statistical analyses and visualizations were performed in R v.4.4.1. Violin plots used vioplot or ggplot2 and displayed density distributions with embedded box plots. Circos plots were generated with RCircos using averaged 50 kb profiles. Differential profiles were calculated by subtracting 5-year values from 3-month values. DNA methylation heat maps and average profiles were generated with EnrichedHeatmap. Genome-wide methylation correlations were visualized with smoothScatter. Box plots show medians, interquartile ranges and whiskers extending to 1.5 times the interquartile range. Bar, box, scatter and line plots were generated with ggplot2.
Electrophysiological analysis of cortical organoids
Electrical activity was recorded with the Accura 3D CMOS-HD-MEA system and 3Brain BioCAM DupleX platform. The array contained 4,096 penetrating µNeedle electrodes arranged in a 64 × 64 grid, with 90 µm electrode height, a 3.8 × 3.8 mm recording area, 20 kHz sampling and 12-bit resolution. CDM4 organoids were transferred to APM 14–21 days before recording. Acute recordings from intact organoids were performed at 37 °C in Carbogen-filled incubator conditions.
Spontaneous activity was recorded for 15–20 min using BrainWave v.5. NMDA and AMPA receptor contributions were tested with D-AP5 and DNQX, while action potentials were blocked with TTX. Spikes were detected with Kilosort231 and analyzed using custom MATLAB scripts. Burst and network-burst activity was identified using predefined interval, amplitude and participation criteria. Interburst intervals and network-burst rates were calculated from population activity. Missing burst amplitude or duration values were set to zero, and outliers were removed with the ROUT method using GraphPad Prism.
Electron microscopy analysis
Eighteen organoids were immersion-fixed in PFA, glutaraldehyde and calcium chloride in sodium cacodylate buffer. Samples were post-fixed with osmium tetroxide and potassium ferrocyanide, stained with uranyl acetate, dehydrated and embedded in LX-112 epoxy resin. Blocks were sectioned at 40 nm, collected on carbon-coated Kapton tape and post-stained with uranyl acetate and lead citrate.
Sections were imaged using a FEI Magellan scanning electron microscope and WaferMapper software. Twelve panoramic high-resolution images were acquired at 4 nm resolution. Stitched images were imported into VAST for manual synapse annotation and ground-truth generation. A U-Net deep neural network was trained with the mEMbrain MATLAB package21,63. Synapses were initially identified using a probability threshold above 40%. Section-specific thresholds were established by manually classifying 103 randomly selected predictions and fitting a psychometric curve.
Each section was divided into five horizontal segments, and the segment with the highest synaptic density was used for comparison. Synapses were classified as spine or non-spine contacts based on their postsynaptic morphology. Synaptic-density comparisons used Wilcoxon rank-sum tests, while spine and non-spine distributions were compared using two-sided Fisher’s exact tests. Statistical significance was defined as P < 0.05.
Expansion microscopy and neuronal morphology
Expansion microscopy with combinatorial antigen barcoding was adapted from a published method26. Seven-month CDM4 and APM organoids were transduced with nine AAVs expressing CAG-driven spaghetti-monster fluorescent proteins carrying distinct epitope tags. After 3 weeks, organoids were fixed, gelatin-embedded, cryosectioned at 50 µm and processed with the Magnify expansion protocol28.
Expanded samples were re-embedded for iterative immunostaining and imaged on a Nikon W1-SORA spinning-disk confocal microscope. Overview images, high-resolution z-stacks and tile scans were stitched and registered across rounds using BigStitcher and BigStream. Volumes were imported into Webknossos as nine-channel datasets. Ten neurons per sample were manually skeletonized, converted to SWC files and analyzed with Navis in Python. Strahler analysis assigned terminal branches a value of one, increasing the value when branches with equal numbers joined.
Brain organoid dissociation and single-cell RNA sequencing
Organoids were dissociated using the published chimeroid protocol9. Cells were resuspended in PBS, filtered through a 35 μm strainer and counted using an automated cell counter with AOPI staining. Single-cell suspensions were loaded onto Chromium Next GEM Chip G cartridges and processed with the Chromium Controller. Libraries were prepared using the Chromium Single Cell 3′ Library and Gel Bead Kit v3.1, pooled by molar concentration and sequenced on NovaSeq X or NovaSeq 6000 instruments. Libraries were resequenced when necessary to achieve approximately 20,000 reads per cell.
Single-cell RNA-seq data processing
Raw BCL files were converted to FASTQ files, aligned and processed into gene–barcode matrices using the 10x Genomics Cell Ranger suite64. CellBender v.0.3.0 was applied to samples with moderate or high ambient RNA contamination. Filtered matrices from Cell Ranger or CellBender were imported into Seurat v.4.3.066 for downstream analysis.
Genetic demultiplexing and doublet removal
When samples from different genetic backgrounds were pooled, Demuxlet v.1.0 was used to assign donor identity and identify ambiguous droplets and doublets67. Ambiguous droplets and doublets were removed. For samples affected by ambient RNA, Souporcell v.2.5 was also used for genotype-free demultiplexing, followed by donor assignment with the Demuxafy Assign_Indiv_by_Geno.R function68,69.
scRNA-seq quality control, normalization and clustering
Cells were retained when they contained more than 500 and fewer than 20,000 UMIs, more than 200 detected features and less than 15% mitochondrial RNA. Seurat SCTransform was used for normalization and mitochondrial-content regression. PCA was performed, and the top 30 components were used to construct a nearest-neighbor graph. Cells were clustered with the Louvain algorithm at resolution 0.3. Clusters with low UMI counts, few features or high mitochondrial RNA were removed as low-quality populations.
Reprocessing of previously published datasets
Raw scRNA-seq FASTQ files from previously published organoid studies6,7 were reprocessed with Cell Ranger v.7.2.0. Intronic reads were included in the resulting count matrices to improve consistency across datasets.
Cell-type annotation and data integration
Clusters were manually annotated before data integration using prior biological knowledge, Seurat marker-gene results and published reference maps6,7,9. CDM4 and APM datasets were merged separately at each age, with 50% downsampling of the larger CDM4 dataset at 4 months. Variable features were selected with Seurat, PCA was performed and batch effects were corrected using Harmony v.1.2.070. Standard Seurat clustering and subclustering were then applied.
Matched genetic-background datasets were retained for comparative analyses at 6, 9 and 12 months and 1.5 years. Cell-type proportions, sample reproducibility and developmental trajectories were evaluated across the time series. The combined CDM4 developmental map included 424,720 cells from 110 organoid samples ranging from 15 days to 5 years. Twenty-three cell types were annotated and grouped into progenitors, excitatory neurons, interneurons, glial progenitors, astrocytes, OPCs and other cell types. Older organoid clusters were annotated using marker expression, label transfer and biological interpretation.
Aitchison distances were calculated to compare cell-type composition between replicates using the robCompositions package. Published human fetal cortex datasets were used as reference variability controls. Merged datasets were jointly renormalized with SCTransform and reprocessed through the Seurat workflow. APM time-series data from 4 months to 1.5 years were generated using the same integration strategy.
Analysis of published human fetal and perinatal brain datasets
Two published human perinatal cortical single-nucleus RNA-seq datasets were combined for comparison10,11. Data were downloaded from the UCSC Cell Browser and restricted to samples ranging from the second trimester to 4 years of age. Cortical and frontal-cortex samples were retained, and cell populations included progenitors, excitatory neurons, interneurons, glial progenitors, astrocytes and OPCs. The final reference dataset contained 188,500 cells from 62 individuals and was normalized with Seurat SCTransform.
Cell-type and age labels were transferred to organoid data using Seurat FindTransferAnchors and MapQuery functions to determine the developmental stage most closely represented by each organoid time point.
Identification of maturation programs associated with brain aging
DIALOGUE v.1.012 was applied to the human perinatal reference dataset to identify multicellular programs (MCPs) of coordinated gene regulation across cell types. Technical variation and developmental age were included as covariates. Five MCPs were identified, and MCP4 showed the strongest and most consistent association with age. MCP4 maturation scores were calculated by subtracting cell-type-specific downregulated module scores from the corresponding upregulated scores. The same gene sets were applied to organoid time-series, APM versus CDM4 and heterochronic chimeroid datasets.
Scatterplots included smoothed conditional means and 95% confidence intervals. Heat maps displayed mean pseudobulk expression over time, with gene-wise z-score normalization. Genes were ordered according to their temporal expression pattern.
Gene set enrichment analysis
Temporal differential-expression analyses were performed for astrocytes in organoids and endogenous perinatal human cortex. Genes were ranked according to the direction and significance of age-associated expression changes. The top 500 upregulated and downregulated genes from perinatal tissue were tested for enrichment in organoid rankings using Kolmogorov–Smirnov statistics. Running enrichment scores and associated P values were visualized for both organoid and endogenous tissue comparisons.
Synapse, presynapse and postsynapse gene signatures
Synapse, presynapse and postsynapse gene sets were obtained from SynGO release v.1.272. Seurat AddModuleScore was used to calculate signature scores in integrated CDM4 and APM scRNA-seq datasets from 6-, 9- and 12-month organoids. Linear mixed-effects models included organoid and genetic background as random effects. Cell-count differences were controlled using reciprocal square-root weighting. Treatment effects were evaluated with likelihood-ratio tests and Benjamini–Hochberg correction.
Apoptosis, hypoxia and glycolysis gene signatures
Hallmark apoptosis, hypoxia and glycolysis gene sets were obtained using msigdbr v.25.1.0. Seurat module scores were calculated for the 15-day to 5-year organoid time series and the 4-month to 18-month APM versus CDM4 dataset. Mixed-effects models were used to test changes over time globally and within broad cell types, with organoid identity and cell type included as random effects where appropriate.
Comparison of cell-type proportions between culture conditions
Cell-type proportions were compared between CDM4 and APM organoids at 4 months, 6 months, 9 months, 1 year and 1.5 years using negative-binomial mixed-effects models. Organoid genetic background was included as a random effect, and total library size was included as an offset. Treatment effects were assessed with likelihood-ratio tests and Benjamini–Hochberg correction. Monochronic chimeroids and 9-month organoids were compared using the same approach for cell types representing at least 5% of the 9-month population.
Comparison of cell-cycle activity
Seurat CellCycleScoring was used to calculate G2M and S-phase scores. Cells scoring below 0.1 for both modules were classified as non-cycling; cells scoring at least 0.1 for either module were classified as cycling. Binomial mixed-effects models tested treatment-associated differences in cycling progenitor proportions, with age and organoid identity included in the model.
Differentially expressed genes and Gene Ontology analysis
Differences between CDM4 and APM organoids at 6, 9 and 12 months were analyzed using sample-level pseudobulk profiles. Excitatory neurons, astrocytes and interneurons were evaluated separately. Organoids contributed only when a partition contained at least 20 cells. Genes with fewer than 10 total UMIs in at least two samples were excluded. DESeq274 modeled treatment while adjusting for genotype. Differentially expressed genes were defined by an absolute log2 fold change greater than 0.5 and FDR-adjusted P < 0.05. Upregulated genes were analyzed for Gene Ontology enrichment with clusterProfiler75.
Comparison of DIALOGUE maturation scores
Integrated organoid datasets from 4 months to 1 year were renormalized with SCTransform and analyzed using the standard Seurat workflow. MCP4 upregulated and downregulated gene sets were used to calculate cell-type-specific maturation scores. Scores were standardized as z scores and averaged within each relevant cell population and organoid. Linear and mixed-effects models evaluated treatment effects across age and at individual time points, with organoid and genotype included as random effects where appropriate.
Confidence intervals and statistical reporting
Unless otherwise indicated, 95% confidence intervals were calculated with the confint function in R v.4.4.0. Confidence intervals for Fisher’s exact tests were obtained directly from the fisher.test function.
Reporting summary
Additional information about the study design, experimental procedures and reporting standards is available in the Nature Portfolio Reporting Summary linked to this article.
Source: www.nature.com