


229Th Nuclear Clock: Laser Set-Up, Clock Operation and Fundamental-Constant Variation
Laser set-up for the 229Th interrogation system
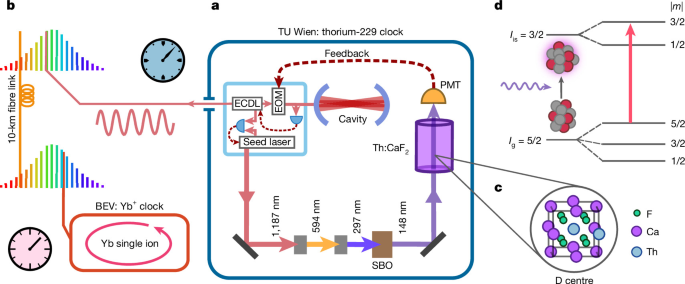
A commercial laser (FHG-TA Pro, TOPTICA) provides approximately 500 mW of output power at a wavelength of 296.8 nm. The light is frequency-quadrupled in two doubling stages and one amplification stage from a diode seed laser operating at 1,187 nm. The final second-harmonic-generation process uses nonlinear frequency conversion in an SBO crystal maintained under a high-purity N2 atmosphere (purity 5.0).
Fundamental radiation remaining after the final second-harmonic-generation stage is separated with three dielectric-coated mirrors. For absorption measurements, a head-on-type PMT (R6835, Hamamatsu) was installed inside the vacuum chamber and operated at 2.5 kV.
We used the same segment of the X2 sample60 as in ref. 7. The cylindrical segment has a diameter of 3.1(1) mm and a length of 4.2(1) mm. It was oriented so that the laser beam travelled along the centre line of the sample. The measured average concentration of 229Th in the segment was 6.6(5) × 1015 mm−3.
The FHG-TA seed laser was locked to the clock laser (CLS, TOPTICA) using an offset-frequency phase lock. A fast photodiode with a 10 GHz bandwidth measured the beat frequency between the two lasers, which was then mixed with a reference frequency. The fast feedback loop actuated on the seed-laser diode current, while the slow loop steered the laser-diode grating. Laser scanning was performed by modulating the reference frequency.
Like the actuators in the offset lock, the Pound–Drever–Hall lock of the clock laser to the cavity used a fast feedback loop acting on the laser-diode current. The slow feedback signal from the Pound–Drever–Hall scheme controlled the grating position, providing optical feedback to the laser diode.
For clock-comparison measurements and cavity drift-rate measurements, the beat frequency fb between the clock laser and the frequency comb (FC1500-250-ULN, Menlo) was recorded with a dead-time-free frequency counter (K+K FXE). The counter operated in Π-type counting mode61,62 with a gate time of 1 s.
Our method for comparing the thorium clock at TU Wien with the Yb+ clock (TOPTICLOCK, TOPTICA)63 at BEV followed the scheme described in ref. 7. The Yb+ clock was based on the 435.5-nm E2 transition of a single 171Yb ion.
All frequency synthesizers and counters in the 229Th clock system, together with the frequency comb, were referenced to the 10-MHz signal from a commercial Rb clock (FS725, SRS).
To perform an absorption measurement at a specific frequency, we square-wave modulated the offset-lock frequency between the seed laser diode and the clock laser at 10 Hz. The laser alternated between the target frequency and an off-resonance frequency. Each modulation cycle was also represented by a synchronization signal connected to a time-resolved pulse counter (TimeTagger Ultra, Swabian Instruments).
This modulation scheme ensured that fluctuations in laser output power did not affect the measurement. The detection system consisted of a PMT, a radiofrequency amplifier and the pulse counter, which binned PMT pulses relative to the most recent synchronization edge. Absorption was calculated by subtracting the on-resonance counts from the off-resonance counts and dividing the result by the off-resonance counts.
Clock operation and error-signal detection
To operate the set-up as a clock, we first acquired a single absorption spectrum, shown in Extended Data Fig. 2a. The absorption data were well described by a Lorentzian line shape. We then measured the expected error signal, shown in Extended Data Fig. 2b.
To measure the error signal, we modulated the offset-lock frequency at 10 Hz between two frequencies, flow and fhigh. The difference, Δf = fhigh − flow, remained constant during the measurement, while the centre frequency was swept across the resonance.
In these measurements, the frequency deviation Δf was set to \({f}_{{\rm{FWHM}}}/\sqrt{3}\), where fFWHM denotes the full width at half maximum of the measured absorption peak (Extended Data Fig. 2a). We fitted the signal using:
$${y}_{{\rm{f}}{\rm{i}}{\rm{t}}}(f)=\frac{{A}_{{\rm{L}}}}{1+{\left(\frac{f+\Delta f/2}{\gamma }\right)}^{2}}-\frac{{A}_{{\rm{L}}}}{1+{\left(\frac{f-\Delta f/2}{\gamma }\right)}^{2}},$$
Here, AL is the amplitude and γ is the half width at half maximum of the Lorentzian.
During clock operation, the laser frequency was again switched between two frequencies while feedback adjusted the centre frequency. At both frequency positions, the counts clow,i and chigh,i were recorded, where i is the measurement index used to average the signal. The applied error signal E was calculated as:
$$E(c)={y}_{{\rm{fit}}}^{-1}\left(\frac{1}{L}\mathop{\sum }\limits_{i=1}^{L}\frac{{c}_{{\rm{high}},i}-{c}_{{\rm{low}},i}}{({c}_{{\rm{high}},i}+{c}_{{\rm{low}},i})/2}\right),$$
Here, L is the number of cycles and \({y}_{{\rm{fit}}}^{-1}(c)\) is the inverse fit function. Extended Data Fig. 2c illustrates an adjustment step inferred from the calculated value of E. With the integration times used during clock operation, the beat frequency was shifted after every interrogation cycle by the calculated value E, as shown in Extended Data Fig. 1.
Variation of fundamental constants
The variation of α(t) relates to the variation of the ratio of the 229Th and ytterbium clock frequencies through: \(({k}_{\mathrm{Th}}^{\alpha }-{k}_{\mathrm{Yb}}^{\alpha })\times {\partial }_{t}\,\log \,\alpha
Source: www.nature.com