


How Salt Marsh Vegetation Breaks Waves During Extreme Storms
This large-scale Delta Flume experiment examined how salt marsh vegetation withstands extreme wave exposure, how vegetation damage affects wave attenuation, and how these findings can be applied to salt marshes worldwide. Researchers transplanted intact salt marsh blocks into a 300-metre wave flume, measured changes in vegetation and wave height, and developed a statistical model to estimate the global contribution of breaking vegetation to coastal protection.
Large-scale assessment of vegetation breakage and wave attenuation
The Delta Flume physical model
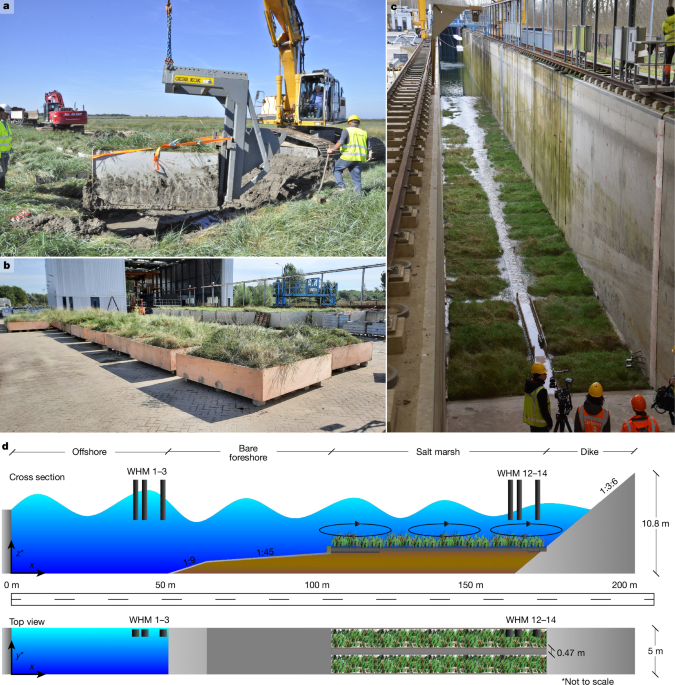
The physical model was constructed in the Delta Flume at Deltares by placing intact salt marsh blocks on a drained sand bed. An artificial dike with a 1:3.6 slope was built at the landward end. The flume is 300 m long, 5 m wide and 9.5 m deep.
Researchers used 66 salt marsh blocks to create two salt marsh profiles, each 71 m long and 2.0–2.2 m wide. A path between the two rows was built 5 cm below the marsh surface. It drained both profiles and provided access for maintenance and manual measurements. The height difference between the path and the marsh surface was comparable with natural variations in clay elevation and vegetation height.
Blocks approximately 0.7 m deep were installed in areas expected to be most vulnerable to erosion: six at the seaward marsh edge and two at the dike toe. Twenty-five blocks approximately 0.4 m deep were placed between these areas. Another 0.4-m-deep block connected the dike slope to the marsh (Fig. 1).
The seaward salt marsh edge was 0.6 m higher than the artificial bare tidal flat, recreating the cliff-like edge observed in field conditions. A brushwood dam protected this edge from lateral erosion, as at some salt marsh sites in the Wadden Sea and other regions43,44,45,46. The protection allowed the researchers to compare experimental runs without lateral edge erosion affecting the results.
The bare tidal flat was made from concrete to prevent changes in bed level that could alter waves approaching the marsh edge. Its first 40 m had a declining gradient of 1:45. A subsequent 12.5 m section had a gradient of 1:9, providing a smooth transition to the bottom of the flume while reducing the amount of construction material required.
Transplanting intact salt marsh blocks
The salt marsh blocks were collected at the Peazemerlannen nature reserve on the mainland Wadden Sea coast of the Netherlands (53° 24′ 19.0908″ N, 6° 5′ 58.3476″ E). Harvesting took place at the end of the growing season, in September and October 2023.
Researchers selected landward and seaward locations with different soil compositions. Median grain size (D50) was 0.013 ± 0.010 mm at the seaward location and 0.003 ± 0.001 mm at the landward location. Clay content was 31.4 ± 6.8% and 44.5 ± 4.8%, respectively (Extended Data Table 1).
Particle-size distribution was determined by adding a peptisator to dried samples to prevent flocculation. Samples soaked for 16 hours before being sieved through a 63 μm sieve. Material larger than 63 μm was mechanically sieved from 63 μm to 63 mm. The material retained on each sieve was weighed. The smaller fraction was analysed with a sedigraph, and the two fractions were combined to determine the full particle-size distribution.
The selected sites had similar above-ground vegetation, which minimized vegetation gradients in the physical model. Researchers selected the high marsh zone because its higher bed elevation generally enables it to contribute most to wave attenuation15. The dominant species was Elymus athericus, mixed with Atriplex species and Aster tripolium.
Blocks were harvested by pressing a mould measuring 2 × 2 m2 and 0.7 m deep, or 2.2 × 2.2 m2 and 0.4 m deep, into the marsh. A 35- to 50-tonne excavator dug around each mould. A steel bottom plate was then slid underneath to minimize disturbance to the vegetation and marsh substrate. The resulting blocks weighed between 3,000 and 6,000 kg. They were lifted, transported on an enclosed truck to prevent wind damage, and delivered to the Delta Flume.
The harvest area was above spring-tide level to ensure safe access by land. Harvesting took place during daylight, after the breeding season and before the storm season, within the shortest practical period. Temporary steel road plates distributed the weight of the excavator and trucks, reducing damage to the surrounding marsh.
After the blocks arrived near the Delta Flume, drainage holes were drilled into the boxes surrounding them. Researchers visually monitored the blocks and periodically measured saturation, using weight, and salinity in a subset of the blocks. During dry periods, the blocks were irrigated when their weight decreased. From December 2023, they were installed in the physical model. Artificial growing lights supplied the part of the model located inside a hall, compensating for reduced sunlight, while ventilation created a more natural airflow.
Organic matter and root biomass in the marsh substrate
The mean organic matter content of the salt marsh substrate was 4.7% ± 1.7%, with values ranging from 2.3% to 7.6% (Extended Data Table 1). Organic matter was measured using loss-on-ignition.
The measured content is similar to that of many European salt marshes, where values range from 0 to 76.7% and average 8.5%47. Studies from the Wadden Sea and northwestern Europe report values from 1.3% to 8.8%, with a mean of 4.2%48. Mediterranean salt marshes typically range from 4% to 30%49. Compared with North American marshes, which can contain more organic matter, the experimental substrate was within the lower part of the reported range of 0–55%50.
Previous studies report salt marsh rooting depths of 10–40 cm51. The E. athericus marsh cover has a web-like, dichotomously branching root structure. Its roots are relatively long compared with those of other species, although its central root and branch density are average to low52. Roots stabilize soil, and stability may increase when vegetation is more diverse53.
Root mass was measured at depths of 5, 10 and 20 cm, with n = 4 samples per depth. After the wave experiments, researchers collected roots from undisturbed areas using bulk-density rings 6 cm in diameter and 4.05 cm deep. Each ring was centred at the selected sampling depth. The samples were carefully excavated, roots were gently rinsed, and the material was dried at 60 °C for 48 hours before weighing. Root density was then calculated.
Below-ground biomass was concentrated mainly in the upper 5 cm of substrate, which contained 78% of the total biomass (Extended Data Table 2).
The findings generally suggest that ecosystem services depending on salt marsh substrate stability, including wave attenuation and carbon storage54,55, are unlikely to be substantially affected by surface erosion during extreme storms when the substrate remains stable. This conclusion is based on a flume experiment containing two soil types (Extended Data Table 1). Their organic matter content represents European marshes and lies within the lower range of organic-rich soils on the east coast of the United States and in the Gulf of Mexico50.
The experiment provides evidence that these soils resist erosion, but soil properties and erosion resistance vary globally56. Controlled erosion experiments using a wider range of natural and restored marsh soils are therefore needed. Organic-rich soils may have a more open structure and be less stable51. Brackish and freshwater marshes may also be more vulnerable because they can have shallower root zones and less inorganic sediment21. The projections therefore provide a conservative estimate for salt marsh soil erodibility but may overestimate the stability of organic-rich, brackish and freshwater marshes.
The wave-flume experiment
Wave-flume experiments began in February 2024, testing vegetation in its winter condition. Before the runs began, vegetation in the Delta Flume was comparable to vegetation in the field, with both measured in February 2024 (Fig. 2).
The programme tested three water depths at the marsh platform: 1.5, 2.5 and 4.0 m. These corresponded to water levels of 4.4, 5.4 and 6.9 m at the wave paddle. Each water level was combined with significant wave heights of 0.75, 1.25 and 2.00 m using a JONSWAP wave spectrum. The combinations maximized the ratio between wave height and water depth at the marsh platform57,58.
Smaller waves at similar water depths would produce less wave attenuation but also less vegetation damage5. Under those conditions, landward wave heights would be expected to remain below those produced by the most conservative wave-height-to-water-depth ratios tested. Vegetation has a limit to its ability to attenuate waves as this ratio increases5. The experiment therefore emphasized severe conditions likely to damage vegetation and reduce its wave-attenuation capacity.
Two wave-steepness values, 0.04 and 0.02, were also tested. The experimental programme increased water depths and significant wave heights over time, potentially increasing damage. Short tests of approximately 100 waves were first carried out at water depths of 1.5 and 2.5 m to test marsh stability. Longer tests of approximately 1,000 waves then applied increasing water depths and wave heights (Supplementary Table 1).
This sequence was repeated three times to assess wave attenuation and marsh stability as vegetation damage increased:
- light vegetation damage;
- substantial vegetation damage; and
- complete removal of above-ground vegetation.
The design quantified the effect of progressive above-ground biomass damage. Wave attenuation by vegetation was calculated by subtracting attenuation caused by marsh elevation alone in runs without above-ground biomass, expressed as the percentage decrease in Hm0, from attenuation measured in runs with intact or damaged vegetation.
Before the final repetition, all vegetation was mowed level with the marsh surface to test wave attenuation under extreme vegetation damage. One significant wave height approximated the maximum tested by Möller et al.5, enabling comparison with that study. The full range of wave heights was intended to support generalization of the results.
Waves were generated with a paddle equipped with active reflection compensation. Water-level elevation in front of the paddle was continuously recorded to characterize the wave field, including reflected waves. The paddle movement compensated for reflections and reduced their return into the physical model. The deep-water reflection coefficient ranged from 0.2 for low waves with 4% wave steepness (run SM-01, Supplementary Table 1) to 0.35 for high waves with 2% wave steepness (run SM-14).
Wave-flume measurements and data processing
The clay marsh surface was measured at 32 fixed locations, with 16 points per transect, using a Trimble Ri total station accurate to 2 mm. The concrete bare tidal flat was not expected to change. Measurements were taken daily or every other day, and the mean, standard deviation and standard error of bed-level change were calculated for each measurement (Extended Data Fig. 7).
The standard deviation across the 32 locations was 43–48 mm, exceeding the mean 7-mm decrease in bed level over the full experiment. This shows that the surface decline after 21 hours of extreme wave forcing was smaller than the normal elevation variation caused by marsh microtopography.
Vegetation was quantified using destructive measurements after changes in significant wave height and daily non-destructive measurements:
- Canopy height: the highest and lowest heights were measured at six locations representing separate marsh blocks (n = 6). A 30-cm-diameter styrofoam plate with a central hole was carefully lowered over a stick. Height was recorded after the plate settled on the canopy.
- Above-ground biomass: all vegetation within a 20 × 20 cm2 area was collected, weighed wet, oven-dried at 65 °C for two weeks, and weighed again.
- Standing stem characteristics: 20 randomly selected E. athericus stems (n = 20) were measured for length and outer diameter 5 cm above the base using a caliper.
- Wave-removed biomass: vegetation material deposited at the dike and in the water was collected with a chicken-wire fishing net. The wet mass was measured, a wet subsample was taken, and the subsample was dried for two weeks at 65 °C before its dry mass was recorded.
- Broken-stem characteristics: 20 randomly selected E. athericus stems from the flotsam were measured for length and diameter. Their flexural strength was also measured.
The destructive biomass and stem-length measurements affected less than 1% of the total marsh area in the physical model.
Researchers also collected 75 E. athericus stems (n = 75) from the seaward and landward field locations where the marsh blocks had been harvested. These samples were collected in February 2024 to compare vegetation development in the flume with vegetation development at the field sites.
Stem length and dry biomass data were processed to calculate the mean, median, quartiles, interquartile range and standard error (Figs. 2 and 3). An exponential decay function was fitted to quantify vegetation damage over exposure time. Wave attenuation was related to stem length for significant wave heights of 0.75 m (r2 = 0.89), 1.25 m (r2 = 0.57) and 2.00 m (r2 = 0.33; Fig. 3).
Mann–Whitney U tests were used to assess differences between field and flume biomass at the start of the experiment. Differences in vegetation height and biomass as damage increased were tested with t-tests for normally distributed samples and Mann–Whitney U tests for non-normal samples, with Benjamini–Hochberg false-discovery-rate corrections. Differences over the full experiment were tested using Welch t-tests with the same correction. The few statistically significant differences may reflect high variability in stem height and biomass, as well as the limited number of replicates used to minimize marsh disturbance.
Wave characteristics were measured with fixed resistance-type gauges at the left wall of the Delta Flume when viewed from the paddle toward the end of the flume. Measurement accuracy was better than 1 cm59. No width-wise variations were observed during the runs because the setup was symmetrical. The researchers assumed no significant width-wise variation, as is generally appropriate for flumes where the width is much smaller than the length: 5 m compared with 300 m60.
For each experiment, Hm0 was determined in front of and at the landward edge of the marsh. Three gauges in front of the marsh were located at X = 40.5, 43.5 and 49.5 m, and three at the landward end were located at X = 151.4, 159.1 and 160.8 m (Fig. 1). Zelt and Skjelbreia’s three-gauge method separated incoming and reflected waves61.
The difference in wave height between the seaward and landward sides of the marsh was then calculated. The specific contribution of vegetation was determined by comparing experiments with vegetation (SM-1–29) and without vegetation (SM-30–37; Supplementary Table 1). Vegetation-related wave attenuation was expressed as the relative share of incoming wave height, allowing comparison among experimental conditions and global scenarios.
Calculating the global contribution of breaking vegetation
Development of the statistical model
The global contribution of breaking vegetation to wave attenuation was estimated by modelling wave attenuation as a response to exposure duration and incoming wave height. The study focused on E. athericus, also known as Elytrigia atherica, which is widespread in northwestern European salt marshes, including Denmark, Germany, the Netherlands, the United Kingdom, France and Portugal (Extended Data Fig. 1).
The decline in E. athericus stem height during the large-scale experiment (Fig. 3) was used as a conservative indicator of wave attenuation by above-ground vegetation under severe conditions, with a water-depth-to-wave-height ratio of 0.5.
A generalized linear model (GLM) with a Tweedie distribution and log-link function was used. This approach accommodates zero and positive continuous values as well as proportional effects, such as the exponential decline in wave attenuation with increasing exposure time.
The GLM strongly predicted variation in vegetation-related wave attenuation, with a pseudo-R2 of 0.97. Wave attenuation decreased as incoming wave height increased (β = −1.3258, SE = 0.185, z = −7.16, P < 0.001) and as exposure duration increased (β = −0.0494, SE = 0.011, z = −4.42, P < 0.001). The model was a globally significant improvement over the intercept-only model (χ2 = 59.26, df = 2, P < 0.001).
Stem height as a proxy for salt marsh wave attenuation
Salt marsh function depends on salt-tolerant plants, or halophytes, including herbs, grasses and shrubs that respond to salinity and inundation gradients4. Stem height is an important factor in wave attenuation because the degree to which stems extend through the water column strongly influences attenuation, especially during extreme waves and high water levels13. Consequently, storm damage that reduces stem height can directly reduce wave attenuation.
The stem height and biomass of E. athericus are comparable with those of stem-forming vegetation species found in salt marshes worldwide. At the end of the experiment, however, damaged stem height and biomass were lower than global values reported for other salt marsh species throughout the year (Extended Data Fig. 1).
Greater stem height generally increases wave attenuation in both low- and high-energy coastal environments, a pattern also observed in the flume experiment (Fig. 3). Under high-energy conditions, the increased likelihood of plant damage may cancel out this benefit. Compared with Elymus, Spartina species experience less wave-induced damage because they are more flexible26. Spartina grows locally at lower elevations and is regionally dominant in areas including North America62,63. Because more stems and biomass remain intact, greater attenuation can therefore be expected.
Wave attenuation may also increase in lower-salinity environments because reduced environmental stress can support greater species diversity32,33,64.
Approximately 70% of global salt marshes occur in temperate climates and experience a winter season31. Vegetation at the end of winter generally provides a conservative estimate of stem height because vegetation outside winter, including during the growing season, is more resistant to damage26. Nevertheless, extreme storms can damage vegetation even when it is more resistant early in the winter season, potentially reducing attenuation during later storms.
The E. athericus results may also provide a conservative estimate of wave attenuation because this species has relatively low breaking strength compared with other salt marsh plants35. Species that experience less damage retain longer stems and therefore have greater attenuation capacity. In addition, the experiment tested only one salt marsh zone, whereas natural marshes often contain multiple zones that increase overall wave attenuation65.
Only a 70-m section of marsh was considered in the experiment. The results can support future site-specific assessments based on vegetation height, but such assessments require detailed characterization of how vegetation height varies across space and time. Remote-sensing methods, including high-resolution satellite imagery, LiDAR and photogrammetry, can map vegetation height66,67,68. These methods still require extensive field validation, particularly where vegetation composition is variable.
Global datasets for salt marsh transects and wave exposure
Global wave attenuation along salt marsh foreshores was estimated by using worldwide data layers as inputs to the statistical model. The method for deriving coastal profiles followed an earlier global study of wave attenuation along vegetated foreshores29, with several updates:
- DeltaDTM elevation data replaced MERIT data30,69, and vegetation-extent data were updated31.
- Foreshores preceded by water bodies shorter than 1 km were removed using a global water mask70, ensuring that foreshore data were taken from the appropriate locations.
- Salt marshes sheltered behind higher landscape features, such as dunes, were excluded by marking vegetation as absent when the mean elevation of the vegetated zone was lower than the mean elevation of the preceding unvegetated foreshore.
- False vegetation detections caused by steep transitions, including coastal slopes and cliffs, were corrected using an interquartile-range elevation filter with a multiplier of 1.5.
Overall, the filtering produced a similar reduction in mapped areas across continents.
Based on the flume experiment, nearshore waves at the seaward edge of a salt marsh were estimated to equal 50% of the water depth. This is slightly below the 55% estimate for very flat nearshore areas29,57,58. Global datasets were used to calculate exposure duration during individual storms with recurrence periods of 100–1,000 years along transects spaced 1 km apart wherever salt marsh vegetation was present.
Elevation profiles, salt marsh extent and significant wave height were combined with global storm-tide hydrographs28, using Euclidean distance, to calculate inundation depths and exposure duration. At globally derived salt marsh locations, approximately 90% of observed peak water levels exceeding 1 m depth remained within the water-level range tested in the flume. Global exposure duration at water levels above the 1.0-m threshold, with Hm0 = 0.5 m, did not exceed 1,000 minutes, or 16.67 hours. This is shorter than the 21-hour duration of the flume experiment.
The calculated exposure duration was then used to estimate vegetation damage, specifically the expected decrease in stem height. Stem damage in the Delta Flume began under the least severe hydrodynamic conditions tested (h = 1.50 m and Hm0 = 0.75 m). For the global model, however, the onset of stem damage followed results from earlier controlled flume experiments27,28. Those experiments began at a water depth of 1 m and a wave height of 0.1 m; the first significant stem damage was observed, on average, at a water depth of 1 m and a wave height of 0.5 m.
Using local storm-surge hydrographs, exposure duration for vegetation damage was calculated over the period when waves at the marsh exceeded 0.5 m. The period extended from the beginning of the storm until the peak storm-surge water level, when the highest waves occurred. Maximum incoming wave height at the marsh edge was calculated at the storm peak, using the most severe estimate of 50% of water depth29,57,58. Finally, wave attenuation at the storm peak was calculated with the GLM, representing the point at which the highest depth-limited waves were expected.
Source: www.nature.com