


Labelling cellular structures with electrochemiluminescence (ECL) probes
Preparation of a Ru(bpy)32+–N-hydroxysuccinimide ester-labelled antibody
Goat anti-rabbit immunoglobulin G (IgG) antibody (1 ml, 1 mg ml−1; Huabio, HA1002) was dialysed overnight at 4 °C against 3 l of 0.01 M phosphate-buffered saline (PBS, pH 7.6; Sigma) using dialysis tubing (Viskase, Membra-Cel MD44). The antibody was then adjusted to 2 mg ml−1. Ru(bpy)2(mcbpy-O-Su-ester)(PF6)2 (1 mg; Aladdin, R131404) was dissolved in 50 µl dimethyl sulfoxide and immediately added to the purified goat anti-rabbit IgG antibody. The reaction mixture was incubated at 25 °C for 1 h. Unreacted Ru(bpy)2(mcbpy-O-Su-ester)(PF6)2 was subsequently removed by dialysis at 4 °C against 3 l PBS for 6 h, with the buffer replaced every 2 h. The resulting Ru(bpy)32+-labelled antibody was diluted with PBS to a final concentration of 1 mg ml−1 before use.
Cell culture and immunolabelling for ECL microscopy
HeLa, COS-7 and MCF-7 cells (Shanghai Institute of Biochemistry and Cell Biology, Chinese Academy of Sciences) were cultured at 37 °C in 5% CO2 using high-glucose Dulbecco’s modified Eagle’s medium (DMEM, Gibco) supplemented with 10% foetal bovine serum (FBS, Gibco) and 1% penicillin-streptomycin solution (Sangon Biotech). At approximately 90% confluency, cells were treated with 0.25% trypsin-ethylenediaminetetraacetic acid (trypsin-EDTA, Thermo Fisher Scientific) for 1 min and transferred onto sterilized indium tin oxide (ITO) coverslips. After 24 h, the cells were rinsed three times with PBS and fixed at room temperature for 30 min using 4% paraformaldehyde (PFA, Sangon Biotech). Excess PFA was removed by washing the samples with PBS. The cells were then permeabilized and blocked for 1 h at room temperature in PBS containing 1% Triton X-100 (Sigma-Aldrich) and 5% bovine serum albumin (BSA, Sangon Biotech).
Following washing, the cells were incubated overnight at 4 °C with rabbit anti-alpha tubulin antibody (Abcam, ab52866) diluted 1:100 in 5% BSA/PBS blocking buffer. For mitochondrial imaging, rabbit anti-TOMM20 antibody (Abcam, ab186735) was used. Carcinoembryonic antigen (CEA) imaging was performed with rabbit anti-CEA antibody (Abcam, ab133633), while integrin imaging used rabbit anti-integrin alpha 5 antibody (Abcam, ab275977) under the same incubation conditions. The cells were washed three times with PBS and incubated with 10 µg ml−1 Ru(bpy)32+-labelled goat anti-rabbit IgG antibody at 37 °C for 2 h. After three final PBS washes, the labelled cellular structures were imaged. Cell lines were authenticated by the supplier using short tandem repeat analysis and were routinely tested and confirmed to be free of mycoplasma contamination.
Labelling intracellular structures with chemiluminescence (CL) and bioluminescence (BL) probes
Construction of mammalian expression vectors for CL and BL imaging
Intracellular targets were labelled for chemiluminescence (CL) and bioluminescence (BL) imaging using a genetically encoded BRET probe (GeNL). In this system, NanoLuc luciferase served as the bioluminescent donor and mNeonGreen fluorescent protein acted as the acceptor. CL imaging was performed in fixed cells, whereas BL imaging was conducted in live cells. The GeNL system was constructed according to the published method26. All target sequences used for cell transfection are provided in Supplementary Table 2.
Cell culture and transfection for genetically encoded probes
HeLa, COS-7 and MCF-7 cells were transfected at approximately 70–90% confluency with 0.25 μg plasmid DNA using Lipofectamine 3000 (Thermo Fisher Scientific). After 12 h, the culture medium was replaced with phenol red-free DMEM for subsequent live-cell BL imaging.
Electrochemiluminescence (ECL) imaging
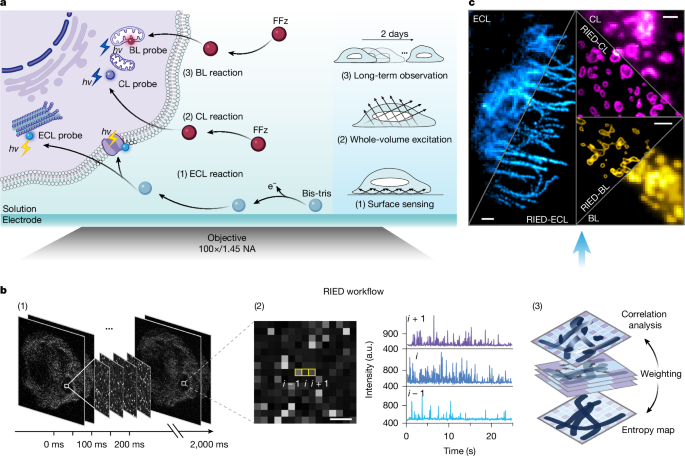
ITO coverslips were prepared according to a previously reported protocol6. ECL imaging was performed using an inverted optical microscope (IX83, Olympus) equipped with a 100× oil-immersion objective (numerical aperture (NA) = 1.45, Olympus). A 40× oil-immersion objective (NA = 1.35, Olympus) was used for large-field-of-view (FOV) imaging. For fluorescence cross-validation, a 488-nm laser beam (MDL-D-488-200 mW, CNI) was delivered through a single-mode fibre and collimator (FP5-F5AP-A, LBTEK) before being coupled into the microscope to excite the Ru(bpy)32+ probe. Images were recorded with a water-cooled electron-multiplying charge-coupled device (EMCCD) camera maintained at 178 K (iXon Ultra 897, Andor). ECL images were acquired at an electron-multiplying (EM) gain of 500 with exposure times of 20 ms, 200 ms, 500 ms, 1,000 ms and 3,000 ms.
Electrochemiluminescence excitation was controlled using a three-electrode electrochemical system comprising an ITO working electrode, an Ag/AgCl reference electrode and a platinum plate counter electrode (10 mm × 10 mm × 0.1 mm). The ECL imaging buffers contained either 100 mM tripropylamine (TPrA; Energy Chemical) or 100 mM Bis-tris (Energy Chemical) in 0.01 M PBS. An electrochemical workstation (CHI 760e, CH Instruments) controlled the applied potential and performed cyclic voltammetry. The excitation voltage ranged from 0.9 V to 1.8 V versus Ag/AgCl. Cyclic voltammetry was performed from 0 V to 2 V at a scan rate of 0.1 V s−1.
For two-dimensional ECL imaging, the electrode surface was used as the focal plane. Three-dimensional ECL image sequences were acquired in axial-scanning mode with a 200-nm step size, beginning at the electrode surface (0 µm) and extending to the upper layer at 1.6 µm. During axial scanning, the applied voltage was synchronously increased from 1 V to 1.8 V in 0.1-V increments. For large-FOV imaging, the microscope stage was sequentially moved across nine sub-FOVs, each containing 512 × 512 pixels and covering approximately 204 µm × 204 µm, with 20% overlap between adjacent regions.
Chemiluminescence (CL) imaging
CL images were acquired with an EM gain of 500 and exposure times of 500 ms or 1,000 ms. Chemiluminescence was initiated using 10 μM furimazine (FFz; Promega) in PBS. NanoLuc catalyses the conversion of FFz to generate CL, which transfers energy to nearby mNeonGreen fluorescent protein and produces luminescence. For three-dimensional mitochondrial CL imaging, an axial image stack was collected using a 200-nm scanning step and subsequently concatenated into a 3D projection.
Bioluminescence (BL) imaging
Live-cell BL imaging was performed at 37 °C in 5% CO2 using an inverted microscope (Ti2e, Nikon) equipped with 100×/1.42 NA and 60×/1.49 NA oil-immersion objectives (Nikon) and a live-cell workstation (STXG, Tokai Hit). A 488-nm laser beam (Oxxius, L4Cc) was used for fluorescence cross-validation. Image stacks were acquired with the EMCCD camera at an EM gain of 500 and exposure times of 100 ms, 500 ms or 1,000 ms.
The BL imaging buffer contained 4 μM, 6 μM or 10 μM FFz prepared in phenol red-free DMEM supplemented with 10% FBS. During imaging, the buffer was continuously refreshed at 40–250 µl min−1 using a peristaltic pump (Masterflex, Ismatec Reglo ICC). This flow maintained a stable bioluminescence signal while reducing cytotoxicity caused by substrate-generated radicals.
Cell viability and phototoxicity evaluation
The cellular effects of BL imaging were assessed using the established phototoxicity fitness time-trial method40. Cell viability and physiological integrity were evaluated by measuring cell division time, cellular diameter, mitochondrial dynamics, membrane integrity and viability-assay responses. Continuous bright-field imaging was performed for 24 h to monitor cell division in DMEM containing 4 µM FFz. Division times were determined using TrackMate41, a Fiji/ImageJ plugin.
Plasma-membrane integrity was evaluated with propidium iodide (PI; Thermo Fisher Scientific). Cells with compromised membranes were identified as dead cells and quantified by measuring red nuclear fluorescence signals.
RIED reconstruction for super-resolution imaging
Main steps of RIED image reconstruction
Strong sampling noise in ECL imaging can interfere with the extraction of temporal electrochemiluminescence fluctuations. To address this limitation, raw ECL image stacks were first preconditioned using a two-dimensional Gaussian filter, which suppressed high-frequency noise outside the imaging system’s passband. Fourier interpolation was then applied along the x–y directions to upsample the ECL stack and recalculate the images on a finer grid. This step provided sufficient pixel support for subsequent resolution enhancement.
Next, accelerated Richardson–Lucy (RL) deconvolution was used as a pre-deconvolution step to reduce sampling noise and improve image resolution12. These preprocessing steps enabled the subsequent entropy-weighted correlation cumulant analysis to enhance resolution using ECL temporal responses on the finer grid while minimizing the influence of noise and spurious fluctuations. Finally, sparse post-deconvolution with dual constraints was performed to maximize image quality and spatial resolution, achieving a \(2\sqrt{2}\text{-fold}\) improvement in three-dimensional resolution. Unless otherwise specified, the same RIED reconstruction workflow was applied to CL and BL image data.
Entropy-weighted correlation cumulant analysis
Entropy was used to identify ECL emitters and estimate the information content of ECL photon events. A higher entropy value indicates a greater number of photon events, larger pixel-intensity variation and higher information content. Calculating the entropy value for each pixel enhanced ECL signals relative to random sampling noise. Because entropy also captures the spatial distribution of ECL emitters, the resulting entropy map provided a weighting scheme for correlation analysis and compensated for spatial and temporal heterogeneity in ECL emission.
A sample in the ECL imaging system can be modelled as a collection of N individual ECL emitters located at positions rk. Assuming stochastic and independent emission behaviour, the detected signal can be described as
$$R(r,t)=\mathop{\sum }\limits_{k=1}^{N}h(r-{r}_{k})\times {l}_{k}\times {w}_{k}
Source: www.nature.com