


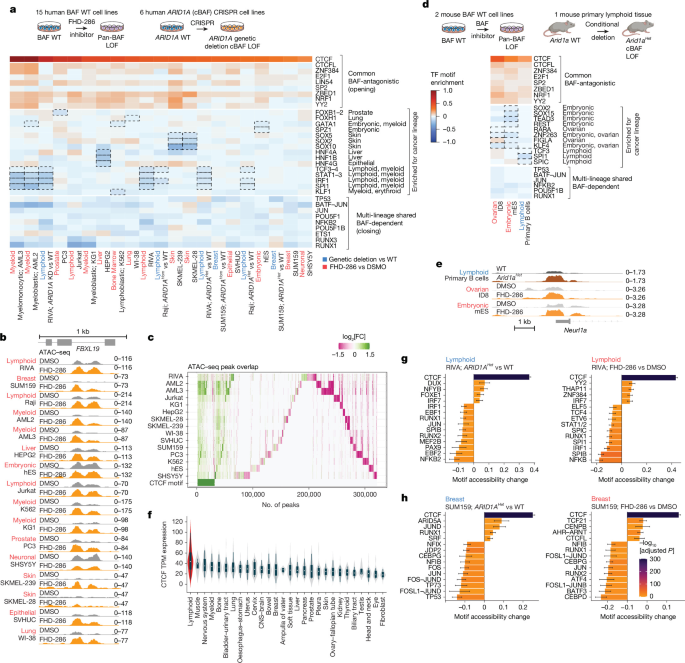
This study used genetically defined mouse models, human and Drosophila cell lines, genome-editing and viral-transduction systems, chromatin and transcriptome profiling, proteomics, and computational analyses to investigate interactions among CTCF, cohesin-associated factors and PBAF chromatin-remodelling complexes. The work included lymphoma, breast-cancer, embryonic-stem-cell and primary mouse-cell models, with experiments designed to control for sex, age, litter, genetic background, technical variation and potential contamination.
Animal models
All mouse experiments complied with Weill Cornell Medicine guidelines, the Guide for the Care and Use of Laboratory Animals and Association for Assessment and Accreditation of Laboratory Animal Care International standards. Procedures were reviewed and approved by the Research Animal Resource Center, the Weill Cornell Medicine Institutional Animal Care and Use Committee and the Cornell Institutional Animal Care and Use Committee under protocols 2011-0031 and 2025-0008, both with D.B. as principal investigator.
Mice were housed in specific-pathogen-free facilities on a 12-hour light–dark cycle at 20–22 °C and 40–60% relative humidity, with food and water available without restriction. Experiments used male and female mice matched for sex and age, generally between 8 and 16 weeks old. Every experimental group included both sexes, and no sex-based differences or biases were observed.
Arid1a mice (strain 027717), Cg1cre mice (strain 010611) and Pbrm1 mice (strain 031875) were obtained from The Jackson Laboratory. CtcfHet mice (Ctcf+/-Cg1cre+/-) were provided by G. Lauvau’s laboratory. The Arid1a strain was back-crossed onto the C57BL/6J background for at least six generations. The heterozygous Cg1cre/+ allele was used throughout.
Group sizes were based on field standards and previous experience with high-throughput sequencing and flow-cytometry experiments. ATAC–seq and RNA-seq used two to four biological replicates per condition, while most experiments included three to five animals per group unless otherwise specified. Where possible, littermates were randomly assigned to groups. All allelic combinations were derived from the same breeding pairs and analysed as littermates to reduce genetic-background and environmental variation.
For sequencing experiments, samples were coded and given randomized identifiers before processing. Investigators handling samples and preparing libraries were blinded to genotype or treatment. Blinding was not used for assays such as proliferation measurements or immunoblotting, but standardized protocols and objective quantification were applied across conditions.
Cell lines and culture
Mammalian cells were grown at 37 °C in humidified incubators containing 5% carbon dioxide. Unless otherwise noted, media contained 2 mmol l−1 GlutaMAX, 10 mmol l−1 HEPES, 1% penicillin G and streptomycin, and the stated concentration of fetal bovine serum (FBS). Cell lines were routinely examined for mycoplasma contamination. Human embryonic-stem-cell work was overseen by the ESCRO committee and approved under protocol 2022-05-001.
- HEPG2, ID8, WI-38 and HEK293T cells used DMEM with 10% FBS.
- K562, KG1 and RIVA (RI-1) cells used IMDM with 20% FBS.
- PC3 and SVHUC cells used Ham’s F-12K medium with 20% FBS.
- SUM159 cells used Ham’s F12 with 10% FBS, 5 μg ml−1 insulin and 1 μg ml−1 hydrocortisone.
- OCI-AML3 and OCI-AML2 cells used alpha-MEM with 20% FBS.
- SHSY5Y cells used DMEM with 10% FBS, non-essential amino acids and sodium pyruvate.
- Raji, Jurkat, SK-MEL28 and SK-MEL239 cells used RPMI with 20% FBS.
- The MEL-1 hES line used Essential 8 Flex Base medium, Essential 8 Flex 50× supplement and normocin.
The S2 Drosophila melanogaster line was maintained at 24 °C in a non-humidified atmosphere without adjusted carbon dioxide, using Schneider’s Drosophila medium with 10% FBS.
Cell lines came from established repositories or collaborators. Accegen supplied OCI-AML2; the American Type Culture Collection supplied HEK293T, HEPG2, Jurkat, K562, PC3, Raji, S2, SHSY5Y, SK-MEL28, SVHUC and WI-38; Cytion supplied SUM159; and DSMZ supplied RIVA and OCI-AML3. MEL-1 was obtained from G. Macdonald, SK-MEL239 and KG1 from D. Landau’s laboratory, and ID8 from N. B. Chetrit’s laboratory. Lines were authenticated by suppliers or by short-tandem-repeat profiling where available. Routine mycoplasma tests were negative.
Drug treatments
Unless figure legends specified otherwise, cells were treated with 5 μM BRD-K98645985 (MedchemExpress), 100 nM FHD-286 (Foghorn Therapeutics), 5 nM FHD609 (Foghorn Therapeutics), 5 nM FHT006710 (Foghorn Therapeutics) or 5 μM PBRM1-BD2-IN-8 (MedchemExpress). Control cells received the corresponding volume of DMSO. ATAC–seq and ChIP–seq were generally performed after 24 hours of treatment.
Genome editing and engineered cell lines
CRISPR–Cas9 knockouts
Double-knockout lymphoma models affecting CTCF and ARID1A or ARID2 and ARID1A were generated in RIVA cells, including RIVA cells in which ARID1A had been restored to wild-type status, using a previously described method. A breast-cancer model with ARID1A deletion was generated in wild-type SUM159 cells.
Cells were electroporated with ribonucleoprotein complexes containing Alt-R recombinant S. pyogenes HiFi Cas9 nuclease, tracrRNA and gene-specific crRNAs. Targets included CTCF guides CD.Cas9.BNYC8101.AA (5′-CATGCTCGGTTTACCCAAAG-3′) and CD.Cas9.JZFQ4398.AA (5′-ATGCCGAACCAATTCTCCA-3′); ARID2 guide Hs.Cas9.ARID2.1.AB (5′-ATTTCATCCACCTCGAAAGC-3′); an ARID1A guide targeting the Q474* mutation region (5′-GGACTTTACTGGTTGTAATA-3′); and SMARCA5 guide Hs.Cas9.SMARCA5.1.AB (5′-GTCAGAGACGTTTTATTACC-3′). ARID1A correction also used a wild-type DNA template, with phosphorothioate-modified nucleotides at its ends.
Electroporation used the SF Cell Line 96-well Nucleofector kit with programme CM-137. Forty-eight hours later, live cells were collected by DAPI exclusion. Because CTCF deletion was lethal, CTCF- and ARID1A-deficient cells were assessed by trypan-blue exclusion, sorted at 48 hours and immediately used for ATAC–seq; remaining cells were analysed by immunoblotting. Other edited cells were single-cell sorted into 96-well plates to establish clonal lines. Deletion efficiency was confirmed by immunoblotting.
For deletion of osa in S2 cells, the guides CD.Cas9.SKCP0295.AB (5′-TGTTGACCAACACCCTGTGA-3′) and CD.Cas9.CMBJ6893.AD (5′-GACCAAGAGCAAGACCTGGA-3′) were used with the same Nucleofector kit and programme DS-137. S2 cells underwent ATAC–seq 48 hours after electroporation, and deletion was confirmed by immunoblotting.
Lentiviral transduction
Stable CTCF-overexpressing RIVA cells were generated with the pHAGE-CTCF vector (Addgene, 116728). RIVA cells with ARID1A knockdown were generated using previously described lentiviruses and the antisense guides ARID1A-7170 (TATGTTTACAGTATCAGGTGTA) and ARID1A-6964 (TTACCATTAAAAACAGTTATGA).
HEK293T cells produced viral particles after transfection with psPax2 (Addgene, 12260), psMD2.G (Addgene, 12259) and the CTCF vector at a 4:3:1 ratio. Supernatants collected at 48 and 72 hours were pooled, filtered through a 0.45 μm membrane and concentrated with PEG-it. Virus was resuspended in PBS containing 25 μmol l−1 HEPES and used to infect RIVA cells. GFP-positive cells were isolated by sorting, and CTCF overexpression was confirmed by immunoblotting.
ARID1A degron in hES cells
The endogenous ARID1A allele in MEL-1 hES cells was tagged at its carboxy terminus with a dTAG cassette containing FKBPV-2×HA-P2A-NLS-eGFP. The construct, with homology arms extending 797 bp upstream and 800 bp downstream of the ARID1A carboxy terminus, was supplied by Integrated DNA Technologies. It was introduced with pX330 Cas9 and guide RNAs targeting the ARID1A stop codon (TGTCCCACGGGCTGTCATGAC and TCATGACAGCCCGTGGGACAC) using lipofection in mTeSR medium and CloneR solution.
Transfected cells were selected for 48 hours with 500 μg ml−1 G418. Cells with high eGFP fluorescence were single-cell sorted, expanded as clones and characterized by genotyping PCR. Selected homozygous clones were validated by immunoblotting.
Mouse embryonic fibroblasts
MEFs were isolated from male or female embryonic day 13.5–14.5 embryos carrying floxed alleles of the relevant genes. Cells were cultured at 37 °C in 5% carbon dioxide and 4% oxygen in DMEM containing 20% FBS, 2 mM GlutaMAX, 0.1 mM non-essential amino acids, 100 U ml−1 penicillin, 100 μg ml−1 streptomycin and 55 μM β-mercaptoethanol. MEFs were confirmed to be free of mycoplasma.
At passage one, cells were infected with pMSCV-Cre-IRES-GFP to excise floxed alleles and then enriched for GFP-positive cells by sorting. Control cells received the empty pMSCV-IRES-GFP vector and were processed similarly, with dividing rather than GFP-negative cells infected to avoid selecting cells with different proliferative potential. Gene deletion was confirmed by PCR genotyping.
Immunoblotting and protein immunoprecipitation
Cells were lysed in RIPA buffer containing HEPES, β-glycerophosphate, EDTA, EGTA, sodium orthovanadate, potassium chloride, glycerol, Triton X-100 and protease inhibitors. Protein concentrations were measured with Bradford reagent. Samples were separated by SDS–PAGE, transferred overnight to PVDF membranes, blocked with 5% milk and incubated with primary antibodies followed by peroxidase-conjugated secondary antibodies. Chemiluminescence was measured on a Bio-Rad ChemiDoc MP system, and densitometry was performed with Fiji.
Antibodies targeted ACTL6A, ARID1A, ARID2, BRD7, BRD9, CTCF, DPF2, GAPDH, Osa, PBRM1, SMARCA2, SMARCA4, SMARCB1, SMARCD1, SMARCE1, SMC3, SMARCA5, human tubulin and D. melanogaster tubulin. Sources, catalogue numbers and dilutions were as specified in the experimental protocol, including CTCF antibody 3418 from Cell Signaling Technology, ARID1A antibody HPA005456 from Sigma-Aldrich and PBRM1 antibody A301-591A from Bethyl Laboratories.
For immunoprecipitation after FHD-286 treatment, cells were treated for 24 hours and nuclear lysates were prepared from 200 million cells. Nuclei were isolated using a modified 10x Genomics protocol, lysed, briefly sonicated and cleared by centrifugation. Lysates were incubated overnight at 4 °C with antibodies against CTCF, PBRM1, BRD7, an IgG control or C15410206. In selected samples, 100 U Benzonase and 1.5 mM magnesium chloride were added. Protein A/G magnetic beads captured the complexes for four hours. Beads used for immunoblotting were washed three times and eluted in Laemmli buffer; beads used for mass spectrometry were washed with lysis buffer and cold PBS before freezing at −80 °C.
Mass spectrometry
CTCF-interacting peptides were separated by reverse-phase chromatography on a 50 cm column and analysed with an Orbitrap Fusion Lumos Tribrid mass spectrometer in data-independent acquisition mode. Full scans covered m/z 380–985 at a resolution of 120,000. Targeted MS2 scans used a 10 m/z quadrupole window, 60 scan events, a resolution of 15,000, an AGC target of 1 × 10⁵ and higher-energy collision-induced dissociation at 30% collision energy.
PBRM1 immunoprecipitation samples were processed with S-Trap micro columns, reduced with tris(2-carboxyethyl)phosphine, alkylated with iodoacetamide and digested with sequencing-grade trypsin. Peptides were analysed on a timsTOF Ultra mass spectrometer using data-independent acquisition with parallel accumulation and serial fragmentation. Collision energy varied from 20 to 59 eV across ion-mobility values of 0.6–1.6 V s cm−2.
Proliferation and sequencing assays
Cell proliferation was measured over five days with the CellTiter-Glo Luminescent Cell Viability assay. RIVA cells were seeded at 4,000 cells per well and MEFs at 500 or 1,500 cells per well in 384-well plates. Luminescence was measured at seeding and every 24 hours, with cell-free background subtracted. Relative luminescence was normalized to the 0-hour value. Three to six technical replicates were collected per time point and cell line.
For bulk RNA-seq, RNA from untreated RIVA cells was isolated with the RNeasy Mini kit and submitted to the Weill Cornell Genomics Resources Core Facility for library preparation and sequencing on an Illumina NovaSeq 6000.
Bulk ATAC–seq used three biological replicates per condition. When three independent clones were unavailable, three separately maintained cultures of the same line were propagated for at least seven days before analysis. Cells were passaged 24 hours before the assay to maintain logarithmic growth. Drug-treated cultures were split into drug and DMSO conditions and treated for a further 24 hours. Freshly sorted mouse cells were processed immediately with the Omni-ATAC protocol. Libraries were generated after lysis, Tn5 transposition, DNA purification and PCR amplification, assessed by Bioanalyzer and sequenced on Illumina NovaSeq 6000 or NovaSeq X Plus instruments with PE50 SP kits.
ChIP–seq followed a previously published protocol with modifications. hES cells were double-fixed with DSG and formaldehyde, and double-fixed mouse ES cells were added as spike-in controls. Chromatin sonication cycles ranged from 10 to 26, and DNA was purified by chloroform–phenol extraction. Antibodies targeted ARID1A, BRD7, CTCF, DPF2, HA, H3K4me1, PBRM1 and SMC3. Libraries were prepared with the NEBNext Ultra II DNA Library Prep kit, purified with AMPure XP beads and sequenced on NovaSeq 6000 or NovaSeq X Plus instruments with PE50 SP kits, with at least 20 million reads per sample.
Micro-C and single-cell multiomics
Micro-C libraries were prepared from 30 million RIVA cells after formaldehyde and DSG crosslinking. MNase digestion was titrated to produce an 80:20 to 90:10 mononucleosome-to-dinucleosome ratio. DNA ends were repaired, filled with biotinylated nucleotides, proximity-ligated and purified. Dinucleosome fragments of approximately 250–400 bp were size-selected, captured on streptavidin beads and converted into sequencing libraries. Libraries were sequenced on a NovaSeq X Plus using PE150 SP kits, targeting at least 420 million reads per sample.
For single-cell RNA-seq and ATAC–seq, germinal-centre cells were sorted from splenocytes using the flow-cytometry procedures described below. Approximately 100,000 cells underwent nucleus preparation, with about 20,000 nuclei loaded onto a 10x Chromium X instrument. Libraries were prepared with 10x Genomics Single Cell Multiome kits, assessed by Bioanalyzer, quantified with a KAPA kit and sequenced on an Illumina NovaSeq platform.
Bone-marrow transplantation and immunization
Bone-marrow cells were collected from the femurs and tibias of 8- to 12-week-old donor mice and treated with red-blood-cell lysis solution. Lethally irradiated C57BL/6J hosts received two 450-RAD doses using a Rad Source Technologies RS 2000 irradiator, followed by injection of 1 million donor cells through the retro-orbital sinus. Transplanted mice were studied 8–16 weeks later.
Mice used for lymphomagenesis studies were monitored until they developed a condition requiring euthanasia, including marked lethargy, substantial weight loss or visible splenomegaly, except for animals euthanized at predetermined time points. The work followed the approved Weill Cornell Medicine animal protocols 2011-0031 and 2025-0008, with Barisic listed as principal investigator for the transplantation procedure.
Germinal-centre formation was induced by intraperitoneal injection of 500 μl of 2% sheep red blood cells in sterile DPBS. Alternatively, mice received 80 μg NP(30-32)-KLH adsorbed in alum at a 1:1 alum-to-immunogen ratio.
Flow cytometry
Spleens were homogenized, filtered through 40 μm strainers and subjected to Ficoll–Paque density-gradient centrifugation. Mononuclear cells were blocked with rat anti-mouse CD16/CD32 and stained on ice for 20 minutes with fluorochrome-conjugated antibodies. Cells were washed twice, and DAPI was added immediately before acquisition to exclude dead cells. Data were collected on a BD Symphony A3 and analysed with FlowJo.
The antibody panels included markers for B220, CD138, CCR6, CD11b, CD21, CD4, CD38, CD80, CD86, CXCR4, ephrin-B1, FAS, GL7, IgD, IgG1, IgM, immunoglobulin light chains, NP and PD-L2. Secondary streptavidin–APC-Cy7 and streptavidin–BV605 antibodies were used where required. Reagents, clones, suppliers and dilutions followed the specified experimental panel.
Computational analysis
ATAC–seq, RNA-seq and ChIP–seq
ATAC–seq reads were assessed with FastQC, adapter-trimmed with Trim Galore! and aligned with BWA to the mm10, hg38 or dm6 reference genome. Picard identified duplicate reads. Mitochondrial reads, duplicates, blacklist-region reads, secondary and multimapping alignments, fragments longer than 2 kb, misoriented pairs and orphan reads were removed. Peaks were called with MACS2, and quality control included fragment-length distributions, FRIP scores, transcription-start-site enrichment and high-quality autosomal read counts. Differential accessibility was tested with DESeq2, using an absolute fold-change threshold of 1.5 and an FDR-adjusted P value of 0.01.
Peak annotation, gene-set enrichment, transcription-factor motif analysis and footprinting used GREAT, GSEA, MSigDB, JASPAR and TOBIAS. Multivariate models assessed motif effects while controlling for GC content. Pseudomedians and 95% confidence intervals were calculated in R, and heat maps were generated with deepTools.
ChIP–seq reads were similarly trimmed, aligned to hg38, filtered and analysed with MACS2, FeatureCounts and DESeq2. Copy-number differences were accounted for with CNVkit where necessary. Batch effects were modelled with DESeq2 or corrected for plotting with limma and ComBat-seq. Coverage tracks and heat maps were generated with deepTools. Principal-component analyses for the study’s ChIP–seq datasets were reported in Supplementary Fig. 4b.
Bulk RNA-seq was processed with the nf-core/rnaseq pipeline v.3.12.0. Salmon v.1.10.1 quantified transcripts against the GRCh38 GENCODE v.33 reference, tximport summarized transcript counts to genes and DESeq2 performed differential-expression analysis. Variance-stabilizing transformation was used for visualization.
Multiome and Micro-C analysis
Multiome data were processed with CellRanger Arc v.2.0.0 and Signac v.1.5.0. Peaks were called with MACS2, combined across samples and filtered to retain regions between 20 bases and 10 kb. Harmony corrected batch effects in RNA principal-component and ATAC latent-semantic-indexing space. Multimodal nearest neighbours supported UMAP visualization, and cell types were assigned using RNA expression and Seurat label transfer. Slingshot generated pseudotime beginning with centroblasts. ChromVAR quantified motif accessibility using the JASPAR2020 vertebrate motif set. The processing code is available at GitHub.
Micro-C paired-end reads were aligned to hg38 with BWA-MEM and processed with pairtools. High-quality valid pairs were retained, PCR duplicates removed and contact matrices generated in .cool and .hic formats. Matrices were KR-normalized at resolutions from 1 kb to 100 kb and jointly normalized with MultiHiCcompare. TADs were identified with HiTAD, differential domains with DiffDomain, insulation scores with HiCExplorer and loops with Mustache. GENOVA was used to visualize contact matrices, calculate relative contact probabilities and generate aggregate TAD plots.
Proteomics and public datasets
IP–MS files were searched with FragPipe v.20.0 and DIA-NN v.1.8.2 against the reviewed UniProt human database downloaded on 7 November 2023. A contaminant FASTA from the L. Hao Laboratory was included. Data were filtered for at least two unique peptides and 33.3% valid values in at least one group. Missing values were imputed in Perseus, and Limma identified enriched proteins relative to IgG controls using an FDR-adjusted P value below 0.05.
Normal-tissue expression data came from the Human Protein Atlas, accessed on 26 July 2024. Cancer-cell-line expression data came from the DepMap Public 24Q4 dataset, also accessed on 26 July 2024, and from the Human Protein Atlas. Groups with fewer than three representative cell types or cell lines were excluded. Analyses were performed in Python v.3.10 with pandas, seaborn and matplotlib.
The DepMap analysis included lymphoid (n = 166), muscle (n = 5), nervous-system (n = 40), myeloid (n = 62), bone (n = 43), bladder and urinary tract (n = 37), lung (n = 204), oesophagus and stomach (n = 73), uterus (n = 40), cervix (n = 20), CNS and brain (n = 97), bowel (n = 80), breast (n = 67), ampulla of Vater (n = 4), soft tissue (n = 56), liver (n = 27), pancreas (n = 54), prostate (n = 12), pleura (n = 22), skin (n = 95), ovary and fallopian tube (n = 67), kidney (n = 46), thyroid (n = 16), biliary tract (n = 42), testis (n = 6), head and neck (n = 65), eye (n = 19) and fibroblast (n = 39) cell lines.
Human Protein Atlas normal-cell groups included blood and immune cells (n = 12), squamous epithelial cells (n = 4), trophoblast cells (n = 3), muscle cells (n = 3), mesenchymal cells (n = 4), glandular epithelial cells (n = 18), specialized epithelial cells (n = 11), neuronal cells (n = 6), glial cells (n = 6), endocrine cells (n = 3) and germ cells (n = 5). Malignant groups included lymphoma (n = 76), leukaemia (n = 93), neuroblastoma (n = 17), myeloma (n = 34), cervical cancer (n = 8), bone cancer (n = 21), bladder cancer (n = 26), gastric cancer (n = 42), rhabdoid tumours (n = 14), colorectal cancer (n = 63), breast cancer (n = 62), pancreatic cancer (n = 46), sarcoma (n = 15), lung cancer (n = 232), oesophageal cancer (n = 27), prostate cancer (n = 8), liver cancer (n = 24), bile-duct cancer (n = 7), ovarian cancer (n = 59), brain cancer (n = 80), uterine cancer (n = 29), skin cancer (n = 62), head and neck cancer (n = 38), thyroid cancer (n = 11) and kidney cancer (n = 35).
Additional analyses and statistics
Chromatin segmentation used a common peak set generated from ATAC–seq, CTCF ChIP–seq and PBRM1 ChIP–seq data. Overlapping peaks were combined into regions, reads were quantified with featureCounts and normalized log-FPKM values and ARID1AHet-to-wild-type log2 fold changes were clustered with k-means. Gene expression was assigned by the nearest transcription start site, CTCF motifs were annotated using the CTCF R package and EMBL M1 and M2 motifs, and TAD insulation was calculated from Micro-C data.
Overall survival was analysed and plotted with cBioPortal using studies from The Cancer Genome Atlas. Kaplan–Meier curves were truncated when only one patient remained in one group, and significance was assessed with log-rank tests.
Statistical details, including replicate numbers, precision measures and tests, were provided in the figures and legends. Results were considered significant at P < 0.05 or adjusted P < 0.05. Analyses used R v.4.1.0, R v.4.3.1 and GraphPad Prism v.10.0, as appropriate.
Ethics and materials
All animal work was approved by the Weill Cornell Medicine Institutional Animal Care and Use Committee under protocols 2011-0031 and 2025-0008 and followed institutional guidelines and the Guide for the Care and Use of Laboratory Animals. Both sexes were used in age- and sex-matched cohorts, and no sex-based differences were observed. hES-cell research was approved by the Weill Cornell ESCRO committee under protocol 2022-05-001. No human participants or identifiable human data were used.
Commercially available and previously published materials are referenced in the study. Unique materials generated during the work, including ARID1A-mutated lymphoma cell lines and Arid1aflox/floxCtcfflox/floxCg1Cre double-conditional deletion mice, are available from the corresponding authors on reasonable request and may require a Material Transfer Agreement. Further information on research design is available in the Nature Portfolio Reporting Summary linked to the article.
Source: www.nature.com