


Researchers at the University of California, San Francisco (UCSF), used controlled mouse models, dietary interventions, immune-cell and molecular analyses, imaging, transplantation and publicly available human psoriasis data to investigate acute type 17 skin inflammation and its relationship with diet, immune responses and disease recurrence. The methods included imiquimod (IMQ)-induced skin inflammation, lipopolysaccharide (LPS)-induced lung inflammation, flow cytometry, bulk and single-cell sequencing, single-nucleus ATAC sequencing, cytokine assays and statistical analyses. All animal procedures were approved by the UCSF Institutional Animal Care and Use Committee (IACUC).
Mouse studies
Mouse studies were conducted at UCSF. Animals were housed in specific-pathogen-free, temperature- and humidity-controlled facilities at 19–23 °C and 40%–60% relative humidity. They were maintained on a 12 h–12 h light–dark cycle, with lights on from 07:00 to 19:00, and were group-housed with unrestricted access to food and water.
When required, mice were purchased from The Jackson Laboratory. Unless a special diet was needed, mice at UCSF received irradiated PicoLab Rodent Diet 20 5053. Special diets were irradiated and purchased from Research Diets. The high-fat diet (HFD) contained 60 kcal% fat (D12492), and the low-fat control diet (LFD) contained 10 kcal% fat (D12450J). The medium-fat diet (MFD) contained 45 kcal% fat (D08091803), and the 30 kcal% fat diet was D20072301. The Western diet was D18053102, with matched control diet D18053101.
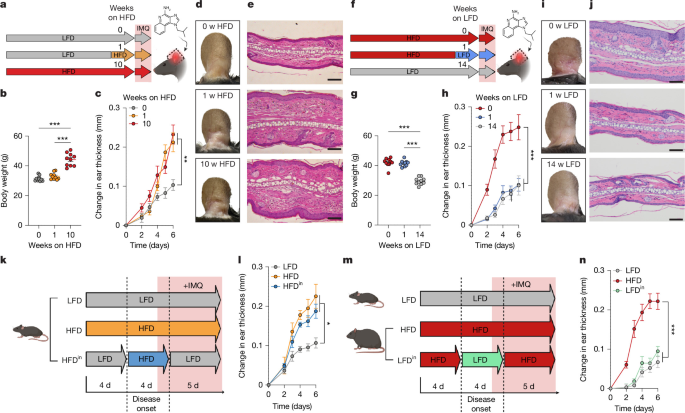
Mice classified as obese had been fed the HFD for at least 10 weeks, beginning at 6–7 weeks of age, and weighed at least 38 g on average within a cage. For short-term HFD experiments, 6-week-old mice received the HFD for 7 days before the IMQ challenge unless otherwise specified. Unless stated otherwise, mice remained on their assigned diets throughout IMQ treatment.
For HFDin experiments, lean mice were switched to the HFD 3 days before the IMQ challenge and remained on it until 1 day after disease initiation. For LFDin experiments, obese mice were switched to the LFD 3 days before the challenge and remained on it until 1 day after initiation. For HFDout experiments, lean mice remained on the LFD except for two HFD periods: from 7 to 3 days before IMQ initiation and from 3 to 6 days after initiation during disease progression. For LFDout experiments, obese mice remained on the HFD except for two LFD periods: from 7 to 3 days before IMQ initiation and from 1 to 6 days after initiation.
For HFDDODO experiments, mice remained on the HFD throughout disease onset, from 7 days before to 6 days after IMQ initiation, and were then returned to the LFD during recovery and rechallenge.
The following strains were purchased from The Jackson Laboratory: C57BL/6J (000664), B6.SJL-Ptprca Pepcb/BoyJ (002014)56, Rag1−/− (002216)57, Tcra−/− (002116)58, B6.129S2-H2dlAb1-Ea/J (MHCIIΔ/Δ) (003584)59, B2m−/− (002087)60, Tcrd−/− (002120)61, Cd4cre (022071)62 and Nlrp3−/− (021302)63. Il1r1fl/fl mice (ref. 64) and Cd4creERT2Ai14 mice65,66 were provided by the Scharschmidt Lab at UCSF. All mice used in the studies were male.
IMQ-induced acute type 17 skin inflammation
Acute type 17 skin inflammation was induced in mice of various ages that had been fed either the LFD or HFD. Mice were anaesthetised with isoflurane, and 15 mg of cream containing 5% imiquimod (IMQ; TARO) was applied topically to the dorsal and ventral surfaces of one ear each day for 6 days (ref. 22). Ear thickness was measured daily with a digital micrometer (Mitutoyo).
Twenty-four hours after the final application, mice were euthanized and their ears were collected for flow cytometry, RNA extraction, histological analysis and other downstream procedures. For rechallenge experiments, mice were allowed to recover after the initial IMQ treatment. Ear thickness was measured weekly to assess recovery. Unless otherwise stated, mice were rechallenged after 25–30 days with 15 mg of 5% IMQ cream applied for 4–6 consecutive days.
To inhibit NLRP3 activation, MCC950 sodium (S7809, Selleckchem) was prepared in water at 50 mg ml−1. Each mouse received 75 μg topically each day, at the same time as IMQ application.
For experiments involving dorsal back skin, mice were anaesthetised with isoflurane 1 day before IMQ treatment. An area of approximately 2.5 cm2 was shaved and treated with Nair depilatory cream, which was promptly rinsed off with water. Under isoflurane anaesthesia, 50 mg of cream containing 5% IMQ (TARO) was applied to the prepared skin once daily for 6 consecutive days. In rechallenge experiments, shaving and depilation were performed only before the initial challenge.
Histology and cytokine assays
Histology of lesional ear skin
Ear skin was collected and submerged overnight in 4% paraformaldehyde (PFA). The tissues were embedded, sectioned and stained with haematoxylin and eosin (H&E) by the Histology and Light Microscopy Core at Gladstone Institutes. Images were captured with a Zeiss microscope. Scale bars were generated by converting pixels to micrometres using ImageJ.
Serum cytokine, hormone and IL-1β assays
Serum samples were submitted to Eve Technologies for quantification using Luminex-based assays. For tissue IL-1β measurements, whole ears were collected and processed separately. Each ear was minced in 400 µl of lysis buffer at 4 °C and homogenized with a Precellys Cryolys tissue homogenizer. Homogenates were clarified by centrifugation, and 100 µl of clarified lysate from each sample was submitted to Eve Technologies for Luminex-based cytokine quantification.
IL-1β concentrations were calculated from standard curves and reported as pg ml−1 of clarified lysate generated from one whole ear homogenized in a fixed volume of lysis buffer.
Glucose tolerance test
Mice were fasted for 2 h. Glucose was administered intraperitoneally at 2.0 g kg−1, and serum was collected for glucose measurements. Blood glucose was monitored with a Nova Max Plus glucometer.
Semaglutide injections
Mice received daily intraperitoneal injections of semaglutide (Selleck Chemicals, S9697) at 120 µg kg−1. Treatment began when mice were placed on either the HFD or LFD and continued each day until IMQ treatment ended. Semaglutide was dissolved in a vehicle of PBS:kolliphor:DMSO at a ratio of 18:1:1. Control mice received the vehicle alone. Injection volumes did not exceed 150 µl per mouse.
Immune-cell analyses
Ear immune-cell suspensions
Dissected ear skin was separated into dorsal and ventral halves and incubated in 1 ml of digestion buffer. The buffer consisted of RPMI-1640 medium with 2% FCS and 1× penicillin–streptomycin–glutamine solution (10378016, Roche), supplemented with 0.2 mg ml−1 liberase (05401020001, Roche), 0.2 mg ml−1 DNase I (DN25-100MG, Sigma-Aldrich) and 0.5 mg ml−1 hyaluronidase (LS002592, Worthington).
After 30 min, the skin was minced into 1–2 mm3 pieces and incubated for a further 30 min. The suspension was passed through a 40 μm mesh to remove undigested material and debris, then centrifuged at 500 rcf for 5 min. The stromal vascular fraction was washed once in 10 ml of RPMI.
Isolated cells were prepared directly for fluorescence-activated cell sorting (FACS) analysis or first stimulated with phorbol 12-myristate 13-acetate (PMA) and ionomycin in the presence of brefeldin A (Cell Activation Cocktail; BioLegend) for 1.5 h at 37 °C. The latter cells were then prepared for intracellular cytokine staining and FACS analysis.
In vivo antibody treatments
The antibodies used were anti-mouse CD4 (BioXCell, GK1.5), its isotype control rat IgG2b (BioXCell, LTF-2), anti-mouse Ly6G (BioXCell, 1A8) and its isotype control rat IgG2a (BioXCell, 2A3).
For anti-CD4 experiments, antibodies were injected intraperitoneally 2 days before, on the day of, and 2 days after IMQ challenge began, at 0.1 mg per mouse. In rechallenge experiments, anti-CD4 or isotype-control antibodies were administered intraperitoneally on days 29, 32 and 35 after the initial challenge at the same dose.
For anti-Ly6G experiments, antibodies were injected intraperitoneally 3 days before, 1 day before, 1 day after, 3 days after and 5 days after the beginning of IMQ challenge, at 0.1 mg per mouse. For the LPS-induced lung inflammation model, antibodies were injected 3 days before, 1 day before, 1 day after and 3 days after the LPS challenge at the same dose. Injection volumes did not exceed 150 µl.
Adoptive transfer of CD4+ T cells
CD4+ T cells were isolated from the spleens of wild-type mice using the Mouse CD4+ T Cell Isolation Kit (StemCell). A total of 100,000 cells was transferred intravenously into Rag1−/− mice. After an 8-week reconstitution period, the mice were fed either the LFD or HFD for 1 week. They then received IMQ for 6 days to induce acute type 17 skin inflammation. Disease severity was assessed by measuring ear thickness, and immune responses were analysed by flow cytometry.
Flow cytometry
Fc Block (2.4G2, 553141, BD) was diluted in FACS buffer and added to each sample 5 min before surface staining. eBioscience Fixable Viability Dye eFluor780 was used to distinguish live cells from dying or dead cells. Cell-surface staining was performed for 30 min at 4 °C. For intracellular staining, cells were treated with eBioscience fixation and permeabilization reagents and labelled with the appropriate antibodies before analysis.
Data were analysed using Aurora Cytek (v.4.0.1) and FlowJo (v.10 and v.11, FlowJo). Cells were sorted on the Cytek Aurora CS System. The antibodies used were CD45.2 (104, 109839, BioLegend), CD197 (4B12, 120120, BioLegend), CD11c (N418, 117322, BioLegend), CD11b (M1/70, 101224, BioLegend), CD44 (IM7, 103037, BioLegend), TCRγδ (GL3, 563993, BD), CD62L (MEL-14, 20-0621-U025, TONBO), CD69 (H1.2F3, 104506, BioLegend), Ly6G (1A8, 127672, BioLegend), CD3ε (145-2C11, 100349, BioLegend), CD4 (RM4-5, 100528, BioLegend), CD8α (53-6.7, 100744, BioLegend), Ki-67 (SolA15, 367-5698-82, Invitrogen), RORγt (Q31-378, 562684, BD), FOXP3 (FJK-16s, 46-5773-82, Invitrogen), IL-17A (TC11-18H10.1, 506914 and 506925, BioLegend), IL-17F (9D3.1C8, 517008, BioLegend), CD121a (35F5, 564387, BD, and JAMA-147, 113505, BioLegend), IFNγ (XMG1.2, 505806, BioLegend) and IL-22 (Poly5164, 516409, BioLegend).
Fc Block, CD45.2, CD197, CD11c, CD11b, CD44, TCRγδ, CD62L, CD69, Ly6G, CD3ε, CD4 and CD8α antibodies were used at a 1:200 dilution. Ki-67, RORγt, FOXP3, IL-17A, IL-17F, CD121a, IFNγ and IL-22 antibodies were used at a 1:400 dilution. eBioscience Fixable Viability Dye eFluor780 (65-0865-14) was used at a 1:1,000 dilution.
Sequencing and computational analyses
Lesional CD4+ T-cell scRNA-seq
CD4+ T cells from mouse ear skin were sorted by FACS. mRNA isolation, cDNA synthesis and library preparation followed the PIPseq T2 3′ Single Cell RNA Kit v4.0PLUS protocol (Fluent BioSciences). Live CD45.2+CD3ε+CD4+ cells were sorted on a Cytek Aurora CS System into the kit’s cell-suspension buffer containing 1 U µl−1 RNase inhibitor.
For each PIP tube reaction, 4 μl of cell suspension containing no more than 5,000 cells and 20 U of RNase inhibitor were added. Vortexing generated single-bead-to-cell emulsions. After cDNA synthesis, 16 PCR cycles were used for cDNA amplification, and 25% of each cDNA sample was used for transcriptome library preparation. PIPseq T2 3′ single-cell gene-expression libraries were sequenced on the NovaSeq X system using standard Illumina paired-end sequencing, targeting 20,000 reads per input cell.
Raw FASTQ files were mapped to the mouse transcriptome (UCSC mm10) with the PIPseeker67 pipeline (Fluent BioSciences, v.3.2), which performs barcode whitelisting, STAR alignment and molecular-index correction and generates barcode-feature count matrices. After alignment and sensitivity calling, using sensitivity_5 for all three samples, 2,103 cells were recovered from the LFD condition and 5,232 from the HFD condition. Two T2 PIPseq reactions were used for the HFD samples, labelled HFD1 and HFD2.
Subsequent analysis was performed with Scanpy (v.1.10.4)68. The three datasets were combined into one AnnData object. Cells with fewer than 200 genes and genes expressed in fewer than three cells were removed. Doublets were identified and removed using the scrublet function. Data were normalized to 10,000 reads per cell and logarithmized before clustering. Clusters were calculated with the Leiden algorithm and visualized with UMAP.
Clusters 8, 11 and 12 were excluded because of monocyte or stromal-cell contamination or high mitochondrial content. Cell types were annotated according to known gene-expression patterns and differential-expression analysis using the rank_genes_group function. After quality-control filtering for doublets and non-CD4+ T-cell contamination, 1,769 CD4+ T cells remained in the LFD condition and 4,450 remained in the HFD condition, with more than 1,500 median genes per cell.
To assess TH17 pathogenicity, the researchers calculated a pathogenicity score based on published gene signatures associated with pathogenic TH17 cells9,31. Gene sets from both studies, including key regulators and effector genes defining pathogenic TH17 cells, were curated and used to evaluate the cells’ pathogenic potential. The score_genes function in Scanpy was used to calculate a score for each cell in the TH17 cluster.
Differential gene expression between TH17 cells from HFD and LFD samples was analysed with Scanpy’s rank_gene_groups function, using tie correction for Wilcoxon scores. Genes expressed in fewer than 100 cells were excluded to reduce background noise. Genes with log2[fold change] > 1 and P < 0.0001 were displayed. Figures were generated with matplotlib (v.3.9.3) and seaborn (v.0.13.2).
Whole-ear bulk RNA-seq
Total RNA was extracted from whole mouse ear skin before, at the end of, or 26 days after the IMQ challenge using the RNeasy Fibrous Tissue Kit according to the manufacturer’s protocol (74704, Qiagen). RNA quantity and quality were assessed with NanoDrop spectrophotometers and a Qubit 4 fluorometer. A total of 10 μg of RNA from each sample was sent to Genewiz for library preparation and RNA-seq.
Read alignment and junction discovery were performed with STAR69 using UCSC mm10 as the reference sequence. Differential gene analysis and visualization were performed in R with the DESeq270 package.
Lesional immune-cell scRNA-seq
Single-cell gene-expression libraries were generated with the Chromium Single Cell Fixed RNA Profiling (Flex) platform (10x Genomics) according to the manufacturer’s instructions. Fixed single-cell suspensions were encapsulated with the Chromium Controller to generate barcoded gel beads in emulsion, followed by reverse transcription and library construction according to the 10x Genomics Flex protocol. Libraries were sequenced on an Illumina NovaSeq X platform to obtain paired-end reads.
Raw FASTQ files were mapped to the GRCm39 reference genome using Cell Ranger’s multi pipeline71. Matrix, barcode and feature files were analysed with Scanpy (v.1.10.4). The analysis included 27,738 cells: 14,990 from the HFD condition and 12,748 from the LFD condition.
The two datasets were combined into one AnnData object. Cells with fewer than 200 genes and genes expressed in fewer than three cells were removed. Doublets were identified and removed with scrublet. Data were normalized to 10,000 reads per cell and logarithmized before clustering. Clusters were calculated with the Leiden algorithm at a resolution of 0.5 and visualized with UMAP. Differentially expressed genes were identified with the rank_genes_groups function.
Cell-type scoring used the PanglaoDB database72 and decoupler’s OmniPath module73 to assist with cell-type assignment. Together with differentially expressed genes and known markers, these analyses identified 17 cell types. Differential expression between conditions was calculated with rank_genes_groups. Figures were generated using matplotlib (v.3.9.3) and seaborn (v.0.13.2).
Recovered-skin CD4+ snATAC–seq
Single-nucleus ATAC libraries were prepared with the Chromium Single Cell ATAC v2 kit (10x Genomics) according to the manufacturer’s protocol. Nuclei were isolated, transposed with Tn5 transposase and barcoded through droplet-based partitioning on the Chromium Controller, followed by library amplification and construction. Libraries were sequenced on an Illumina NovaSeq X platform to generate paired-end reads.
Raw FASTQ files were mapped to the GRCm39 reference genome using Cell Ranger’s atac count pipeline71. Further analysis was performed with ArchR74 (v.1.0.3). Arrow files were first created from fragment files using barcodes that passed the Cell Ranger pipeline. Analysis used the mouse GRCm39 genome.
Initial quality control assessed fragment-size distribution, transcription start site enrichment and the number of fragments per cell. Peaks were called with the addGroupCoverages and addReproduciblePeakSet functions using MACS275. Initial clustering used the addIterativeLSI and addClusters functions and was visualized with UMAP.
Top markers for each cluster were calculated with getMarkerFeatures using the GeneScoreMatrix. Significant markers were defined as having a false-discovery rate below 0.05 and Log2FC ≥ 1 or ≤ −1. The addImputeWeights function was used to add imputation weights and smooth signals across nearby cells for visual interpretation. Data were visualized with plotEmbedding. Differentially accessible regions were calculated with getMarkerFeatures using the PeakMatrix and visualized with base R plotting functions or ArchR functions including plotMarkers and plotBrowserTrack.
Human psoriasis scRNA-seq analysis
Publicly available scRNA-seq datasets from psoriasis vulgaris lesions were obtained from the European Genome-phenome Archive (EGA): EGAS00001007373 and EGAS00001005271. The datasets included n = 15 samples and had been reported previously76,77.
Count matrices were loaded into R with Read10X from Seurat and processed with Seurat78 to create one Seurat object per sample. Putative doublets were identified and removed with scDblFinder79. Cells were retained if they contained 100–6,000 detected genes, fewer than 20% mitochondrial transcripts and fewer than 50% ribosomal transcripts.
Filtered datasets were merged and normalized in Seurat using standard workflows. Cell-type labels were assigned by reference mapping to an annotated psoriasis immune atlas76 with FindTransferAnchors, TransferData, AddMetaData and MapQuery. Marker genes were identified with FindAllMarkers, and visualizations were generated using FeaturePlot and VlnPlot.
Lung inflammation model
LPS-induced lung inflammation
Acute lung injury was induced by intranasal administration of lipopolysaccharide (LPS) from Escherichia coli O111:B4 (Sigma-Aldrich, L3012). Mice were deeply anaesthetised with inhaled isoflurane to reduce respiratory rate while increasing tidal breathing. LPS, at 60 μg in 50 μl of sterile PBS, was delivered dropwise to the nares while the mice were held upright. During deep inspiratory efforts, animals were gently rotated to alternate the orientation of the main bronchi and promote more uniform distribution of the inoculum.
Lung immune-cell suspensions
Mice were euthanized 4 days after LPS administration. Bronchoalveolar lavage fluid and lung tissue were collected, and lung tissue was weighed before processing.
Dissected lung was finely minced in 1 ml of digestion buffer and incubated in the same buffer for 1 h. The buffer consisted of RPMI-1640 with 2% FCS and 1× penicillin–streptomycin–glutamine solution (10378016, Roche), supplemented with 0.2 mg ml−1 liberase (05401020001, Roche), 0.2 mg ml−1 DNase I (DN25-100MG, Sigma-Aldrich) and 0.5 mg ml−1 hyaluronidase (LS002592, Worthington).
The suspension was passed through a 40 µm mesh and centrifuged at 500 rcf for 5 min. The pellet was washed once in 5 ml of RPMI. The isolated cells were stimulated with PMA and ionomycin in the presence of brefeldin A (Cell Activation Cocktail, BioLegend) for 1.5 h at 37 °C, then prepared for cytokine staining and FACS analysis.
FTY720 treatment
Mice received daily intraperitoneal injections of 100 µl per mouse of FTY720 at 1 mg kg−1 or water as the vehicle. Treatment began 1 day before the IMQ challenge and continued daily for its duration. FTY720 was administered during either the initial disease-onset phase or the rechallenge phase.
Thick-section 3D confocal microscopy
After euthanasia with CO2, dorsal back skin was excised and floated dermis-side down in 2% PFA (Thermo Fisher Scientific) for 1 h at 4 °C. It was then fully submerged in fresh 2% PFA for an additional 6 h at 4 °C. Tissue was cryoprotected overnight in 30% sucrose at 4 °C.
One-centimetre-squared sections were embedded in OCT compound (Thermo Fisher Scientific), snap-frozen on dry ice and stored at −80 °C. A cryostat was used to cut 200 µm-thick sections. Sections were washed in PBS and blocked for 24 h at 37 °C in DPBS containing 0.3% Triton X-100, 1% host serum matched to the secondary antibody and 1% BSA.
Sections were incubated with primary antibodies diluted in blocking buffer for 48–72 h at 37 °C, washed three times for 2 h each in PBS, and incubated with appropriate secondary antibodies for 24 h at 37 °C. They were washed three times for a total of 8 h and cleared in Ce3D clearing solution containing 40% n-methylacetamide before imaging.
Imaging antibodies
Primary antibodies used for mouse imaging were rabbit anti-dsRed (Takara, 632496, 1:400), rat anti-CD49f–AF488 (BioLegend, 313608, 1:200), rat anti-α-smooth muscle actin–CF405S (Biotium, BNC040665, 1:100) and goat anti-FABP5 (R&D Systems, AF1476-SP, 1:400). Secondary antibodies conjugated to Alexa Fluor 555 or Alexa Fluor 594 (Thermo Fisher Scientific) were used as appropriate.
Confocal microscopy
Cleared thick sections were imaged with a Leica SP8 upright laser-scanning confocal microscope equipped with a 405 nm laser and tuneable white-light laser, using a 20× water-immersion objective. Z-stacks were acquired under identical settings within each experiment to permit qualitative comparisons between conditions.
Full-thickness skin transplantation
Donor mice were anaesthetised with isoflurane, and anaesthesia depth was confirmed by toe pinch. The left dorsal back was shaved with an electric razor and disinfected with povidone-iodine and 70% alcohol. Using sterile scissors and aseptic technique, full-thickness dorsal skin was collected by blunt dissection at the level of the areolar connective tissue. Donors were euthanized by cervical dislocation after graft collection.
Under a dissecting microscope, connective tissue, fat and the panniculus carnosus were removed from each graft with fine scissors. Grafts measuring approximately 15 × 15 mm were cut and stored on sterile PBS-soaked gauze in a Petri dish on ice. Each donor provided two grafts for two recipient mice.
Recipient mice were anaesthetised with isoflurane, using 3% for induction and 2% for maintenance, and received local bupivacaine and subcutaneous Ethiqa XR for analgesia. The upper back, or thoracic region, was shaved and disinfected with 10% povidone-iodine. A 15 mm square graft bed was created by carefully removing the skin while preserving the panniculus carnosus and its superficial vasculature.
The donor graft was placed on the bed, aligned without folds and secured with eight interrupted sutures at the corners and the midpoint of each edge. After suturing, the thorax was wrapped with an adhesive bandage adjusted to permit free breathing and thoracic movement.
Recipients were returned to the housing facility once they could move freely. On postoperative day 7, bandages were removed under brief anaesthesia by cutting only the ventral side of the dressing to avoid disturbing the graft. Grafts were inspected for vascularization; contraction, scabbing or firmness indicated technical failure. Ethiqa XR was administered before surgery for sustained pain control, and additional analgesics were provided as required under veterinary guidance.
Statistics and reproducibility
Statistical analyses were performed with Prism (GraphPad, v.10 and v.11). Unless otherwise noted, P values were calculated using two-sided Welch’s t-tests. Where applicable, mice were randomly assigned to treatment or control groups.
Experimental data were not excluded from statistical analyses except when technical errors occurred or confidence in the appropriate controls was lost. Measurements were taken from distinct biological samples, except for ear thickness, which was measured longitudinally in the same mice at multiple time points. Investigators were not blinded unless otherwise stated. No estimate of variance was made between groups.
All in vivo experiments were conducted with at least two independent cohorts unless specified otherwise. Unless noted, the article presents data from one instance of repeated experiments. The recurrence experiment in which mice recovered for 6.5 months before IMQ rechallenge was conducted only once. Targeted lipidomics analyses were conducted once. Bulk RNA-seq, scRNA-seq and snATAC–seq experiments were each conducted once using multiple biological samples per group, as indicated in the figure legends.
Histological analyses used tissues from a single experimental cohort for each comparison. Unless otherwise indicated, at least five mice per group were examined. For each mouse, three serial sections were assessed at each of at least two separately cut tissue levels. Thick-section confocal imaging was performed once using two mice per group, with three 200 µm sections imaged per mouse.
Reporting summary
Further information about the research design is available in the Nature Portfolio Reporting Summary linked to the article.
Source: www.nature.com