


Cooperative Foraging, Social Roles and Neural Decision-Making in Mice
This study investigated how mice cooperate during a spatial foraging task, how social roles such as leadership and following emerge, and how the medial prefrontal cortex (mPFC) represents partner location, choice, and cooperative behaviour. Behavioural tracking, neural imaging, electrophysiological recordings, chemogenetic and optogenetic manipulation, dominance assays, and multi-agent reinforcement-learning models were combined to examine social decision-making in mice.
Animals and Housing
Wild-type C57BL/6J female and male mice aged 2–6 months were obtained from The Jackson Laboratory. Animals were housed under a reversed 12-hour light–dark cycle, with lights off at 07:00 and on at 19:00. The housing environment was maintained at 18–23 °C and 40–60% humidity, with unlimited access to food and water except during behavioural training.
Training began when mice were approximately 2–3 months old, and experimental pairs were age-matched. During training and testing, mice were water restricted while maintaining 80–90% of their initial body weight. Experiments were conducted during the dark cycle. Each behavioural session lasted approximately 1 hour, during which mice received 0.5–1.5 ml of water through the task. Supplemental water was provided when necessary.
All procedures followed the National Institutes of Health Guide for the Care and Use of Laboratory Animals and were approved by the Icahn School of Medicine at Mount Sinai Institutional Animal Care and Use Committee.
Behavioural Apparatus
The cooperative foraging arena was an 18 × 18-inch square chamber made from white acrylic. Four reward zones were positioned at the centre of each wall. Each zone contained two adjacent water ports.
The ports were 3D printed from white and transparent resins and included infrared beams for nose-poke detection and white LEDs indicating port availability. Water was delivered through stainless-steel tubes controlled by solenoid valves. An infrared initiation sensor was placed at the centre of the arena to detect trial initiation.
Analogue signals from the ports were digitized using an Arduino Nano and acquired with a National Instruments USB-6001 data-acquisition system. LabVIEW controlled trial timing, LED signalling, water delivery, and data recording. An overhead Teledyne FLIR camera recorded mouse behaviour at 30 frames per second.
Video Tracking and Pose Estimation
Mouse movement and posture were tracked using the machine-learning tools SLEAP v1.3.3 and Ensemble Kalman Smoother v0.0.0. The nose, neck, and torso of each mouse were annotated in every video frame. These three points were connected to create a skeletal representation of each animal.
To distinguish animals within a pair, a small patch of back fur was shaved from one mouse. Approximately 4,200 frames from 10 mouse pairs were manually labelled to train the SLEAP model. The trained model was then used to estimate body landmarks in additional recordings. Ensemble Kalman Smoother post-processing improved tracking reliability by smoothing pose predictions over time.
Custom MATLAB scripts aligned LabVIEW behavioural events with video frames using LED onset and offset signals.
Behavioural Definitions
Mouse position was defined by the neck landmark. Neck position was also used to calculate movement speed and acceleration. Each reward zone was defined as a 10-cm-radius semicircle centred between the two reward ports.
- Arrival: the first video frame in which a mouse’s neck entered a reward zone.
- Reaction time: the interval between trial onset and arrival at the selected reward zone.
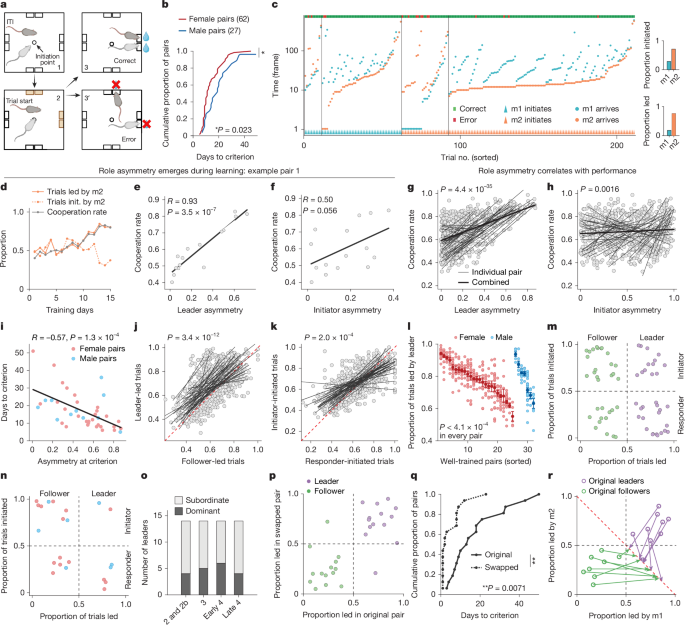
- Correct trial: both mice selected the same active reward zone and simultaneously nose-poked the associated ports.
- Mismatch error: the mice selected different active reward zones.
- Unrewarded error: either mouse selected an inactive reward zone.
- Omitted trial: the mouse or pair failed to respond within the permitted response window.
Cooperative Foraging Task
Mice were first water restricted to approximately 1 ml per day for at least 3 days and habituated to the experimenter and behavioural arena. Training consisted of several progressive stages.
Stage 1: Light-Guided Water Retrieval
Mice learned to associate an illuminated port with a water reward. Training occurred in a single reward zone separated from the remainder of the arena by an acrylic barrier. On each trial, either the left or right port was randomly illuminated. Nose-poking the illuminated port delivered water and switched off the LED. Mice typically advanced after 3 days.
Stage 2: Trial Initiation
Mice gained access to the entire arena, including all four reward zones and the central initiation point. A trial began when a mouse approached the initiation sensor. Both ports in one active reward zone then illuminated.
The mouse had 15 seconds to nose-poke an illuminated port. Poking an inactive port ended the trial and triggered a 6–10-second timeout. Mice progressed after reaching at least 80% correct performance.
Stage 3: Cooperative Foraging Shaping
Two same-sex cage mates that had completed Stage 2 were placed in the arena together. Either animal could initiate a trial, after which both ports in one reward zone were illuminated.
Each mouse had to nose-poke one of the illuminated ports in the same zone within 15 seconds. The animals could arrive at different times and wait for one another, but water was delivered only when both mice nose-poked simultaneously. An inactive-port response ended the trial and initiated a 6–10-second timeout.
Stage 4a: Well-Trained Cooperative Foraging
Either mouse could initiate a trial by crossing the central initiation point. The initiating mouse therefore began from a standardized location, whereas the partner’s position remained unconstrained and naturally variable.
Two of the four reward zones were randomly illuminated. Both mice had to select the same active zone and nose-poke one of its two ports to receive water. This shared action was defined as cooperation.
Trials ended without reward when the animals selected different active zones or when either mouse entered an inactive zone. Error trials were followed by a 6–10-second timeout in addition to a 3–8-second inter-trial interval. Early Stage 4a omissions were responses taking longer than 15 seconds, whereas late omissions exceeded 8 seconds.
Correct performance was calculated after excluding omitted trials. Training criterion was defined as at least 80% correct across three consecutive sessions. Pairs that failed to reach criterion within 50 days were excluded.
Social Role Assignment
After reaching criterion, each mouse was classified independently as a leader or follower and as an initiator or responder. Leadership was assessed by calculating the proportion of trials led by each mouse and comparing this value with chance performance of 0.5 using a two-tailed binomial test with α = 0.01.
The mouse that led significantly more trials was designated the leader. If neither mouse showed a significant bias, no leader was assigned. The same procedure was used to identify initiators and responders.
Leader asymmetry was calculated as the absolute difference between the proportions of trials led by the two mice. Initiator asymmetry was calculated in the same manner. These classifications represented session-level behavioural tendencies rather than fixed identities: a leader could follow, and a responder could initiate, on individual trials.
Unrewarded and omitted trials were excluded because social roles could not be assigned reliably. Cooperation rate was calculated as the number of correct trials divided by the total number of correct and mismatch trials.
Manual Annotation of Social Behaviour
Trial start and end times were extracted from behavioural recordings, and a 30-frame pre-trial buffer was added to each video segment. Concatenated videos were manually annotated frame by frame by trained observers using Avidemux v2.8.1. Start and end frames were recorded for each behavioural motif and used to generate Gantt charts for quality control.
The following social behaviours were analysed:
Synchronized Travel
Both mice travelled in parallel while maintaining similar linear and angular velocities and a consistent close distance. They arrived at the same reward zone together.
Track
One mouse slowed and turned its head toward the more distant partner. After detecting the partner’s movement, it adjusted its timing so both animals reached the reward ports nearly simultaneously.
Sharp Turn
The mice initially moved toward different active zones. One mouse then changed direction by more than 90 degrees and redirected its movement toward the zone selected by its partner.
Join
One mouse began moving toward an active zone while the partner was stationary or undecided. The partner subsequently aligned its trajectory with the first mouse, and both travelled toward the same zone.
Partner-Swapping Experiments
Groups of four same-sex cage mates were randomly divided into two cooperative foraging pairs. After both pairs reached criterion and social roles were assigned, partners were exchanged in two ways: leaders were paired with followers from another dyad, or leaders were paired with leaders and followers with followers.
When both animals had shaved identification patches, one mouse was marked with black dye. The new pairs then resumed training until they again reached the performance criterion.
Control Behavioural Tasks
Solo Foraging
Solo foraging was generally conducted after Stage 2 to measure individual reward-zone preferences without a social partner. After initiating a trial, two reward zones were randomly illuminated. The mouse received water by nose-poking any port in an active zone. Responses at inactive ports ended the trial without reward and were followed by a timeout.
Cooperative Foraging with Rule Reversal
In Stage 4d, the reward contingency was reversed. Mice were rewarded for choosing different active zones rather than the same zone. Selecting the same zone ended the trial without reward, while all other task parameters remained unchanged.
Non-Social Stimulus-Tracking Task
The non-social stimulus-tracking task used the same arena, but the opaque floor was replaced with a transparent base. A projector beneath the arena displayed a moving black elliptical stimulus measuring 3 × 6 cm.
Training included single-zone acquisition, initiation training, two-choice tracking, and trajectory-based stimulus tracking. During the final stage, stimuli replayed trajectories selected from a library of 20 well-trained cooperative foraging sessions. Half of the trajectories came from leader trials and half from follower trials.
Mice were rewarded when they tracked the stimulus to the corresponding reward zone and nose-poked the correct port within the response window. Training continued until the correct rate varied by less than 5% across three consecutive sessions.
Dominance Hierarchy Testing
Social dominance was assessed using three independent behavioural assays: the tube test, warm-spot test, and reward competition test. These tests measured competitive behaviour in different contexts and provided convergent estimates of social rank.
Tube Test
Mouse pairs were placed at opposite ends of a transparent acrylic tube measuring 12 inches in length and 1.25 inches in diameter. Because only one mouse could pass through at a time, the animal that forced its partner to retreat was classified as dominant.
Groups of four mice were tested in a round-robin design involving six pairwise contests. Testing continued daily until the hierarchy remained stable for four consecutive days.
Warm-Spot Test
Four cage mates were placed in a covered transparent arena containing a warm circular platform. A USB heating pad beneath the platform provided localized heat. The mice were acclimated on ice for 30 minutes before testing and then recorded for 20 minutes.
The time spent by each mouse on the warm platform was quantified using BORIS v9.2.3 and used to estimate social rank.
Reward Competition Test
Two mice competed for access to a single illuminated reward port. Each session included 20 trials separated by a 3-second inter-trial interval. After 2 days of habituation, animals completed two test sessions. In groups of four, all six pairwise combinations were tested in randomized order.
Elo-Based Dominance Scores
Dominance was quantified using a sequential Elo rating system. All mice began with a score of 1,000. For a contest between animals A and B, the expected probability that A would win was calculated as:
\[
E_A=\frac{1}{1+10^{(R_B-R_A)/400}}
\]
Ratings were updated after each contest using:
\[
R’_A=R_A+K(S_A-E_A)
\]
Here, \(S_A\) was 1 for a win, 0 for a loss, and 0.5 for a tie. The update parameter \(K\) was set to 20. Warm-spot rankings were converted into inferred pairwise outcomes, allowing all three assays to be analysed using the same Elo framework.
Viral Vectors and Stereotaxic Surgery
Adeno-associated viral vectors were obtained from Addgene or the Stanford University Virus Core. Vectors expressed hM4D(Gi), mCherry, GCaMP6f, GCaMP8m, GFP, or KALI1-eYFP under synapsin, CaMKIIα, or CAG promoters.
Mice were anaesthetized with ketamine and xylazine, maintained under 1–1.5% isoflurane, and secured in a stereotaxic frame. Viral injections were delivered through glass capillaries connected to a Nanoject III nanoinjector at 1–2 nl s−1. Coordinates were based on the Paxinos and Franklin mouse brain atlas.
Postoperative analgesia consisted of long-acting buprenorphine or carprofen. Chemogenetic inhibition targeted the mPFC or orbitofrontal cortex using hM4D(Gi). Optogenetic inhibition of the mPFC used KALI1-eYFP and bilateral implanted optical fibres.
For miniscope imaging, a GRIN lens was implanted above the mPFC after viral delivery of GCaMP6f or GCaMP8m. The lens and microscope baseplate were secured with adhesive and dental acrylic. Viral expression, implant position, and targeting accuracy were verified histologically. Only correctly targeted animals with usable recordings were included.
Chemogenetic and Optogenetic Manipulation
For chemogenetic experiments, mice received clozapine N-oxide at 5 mg kg−1 by intraperitoneal injection 30 minutes before testing. Control sessions involved saline injections, and a separate mCherry control group was used to evaluate potential non-specific CNO effects.
Wireless optogenetic stimulation was delivered through implanted fibres using a Teleopto system. Stimulation occurred on one-third of trials according to a pseudorandom schedule. Light was delivered at 590 nm at approximately 0.8 mW per hemisphere, with stimulation applied throughout the trial or during defined periods after trial initiation.
One-Photon Calcium Imaging
Calcium activity was recorded during well-trained Stage 4a cooperative foraging. One mouse was imaged per session, while the partner wore a dummy scope of equivalent weight. Neural activity and behavioural videos were synchronized frame by frame.
Suite2p was used to identify regions of interest and extract calcium signals. Cascade was used to estimate spike rates. Neuropil fluorescence was corrected by subtracting 70% of the local neuropil signal. Dynamic baselines were calculated using Gaussian smoothing and moving minimum and maximum filters before computing ΔF/F.
Animals were excluded when viral targeting, expression, imaging quality, or calcium signal quality was insufficient.
Electrophysiological Validation
Acute extracellular recordings were used to validate mPFC inhibition. Recordings were obtained with 64-channel silicon probes positioned stereotaxically in the mPFC and digitized at 25 kHz.
Signals were high-pass filtered and sorted using Kilosort3. Spike clusters were manually curated with Phy. Recording locations were verified histologically using fluorescent DiO or DiI labelling.
Chemogenetic inhibition was validated by comparing baseline activity with activity following CNO administration. KALI1-mediated optogenetic inhibition was tested across multiple light intensities and pulse repetitions.
Unsupervised Behavioural Classification
LISBET v0.3.0 was used to generate 64-dimensional, self-supervised embeddings of mouse body kinematics. SLEAP coordinates were converted into pseudo-DeepLabCut coordinates compatible with the pretrained LISBET model.
To remove task-specific variables, analyses were restricted to correct trials and trajectories were rotated so that the selected reward zone occupied a common orientation. Embeddings were calculated using 20-frame temporal windows and compared with manually annotated behavioural motifs using a modified silhouette score.
Spatial Decision-Making Analysis
Mouse choices during cooperative foraging were compared with solo-foraging behaviour to determine how partner position and heading influenced decisions. Trials were rotated into a common configuration, and long trials, errors, and omissions were excluded.
Logistic regression models estimated the probability of selecting the north reward zone from the animal’s heading, partner heading, and partner location. Interaction terms measured how the partner changed self-orientation sensitivity and directional choice bias.
Additional generalized linear models incorporated the heading and distance of both leader and follower. Models were trained on 90% of trials and evaluated on 10% held-out data across 100 random splits. Statistical significance was assessed against choice-label-shuffled null distributions using 10,000 bootstrap iterations.
Neural Choice and Social-Role Selectivity
Neurons selective for reward-zone choice were identified using one-way ANOVA on calcium responses during the 1-second period before trial completion. Choice selectivity strength was quantified using:
\[
\mathrm{SI}=\frac{\mathrm{s.d.}(\mu_i)}{\bar{\mu}}
\]
Support vector machine classifiers decoded four-way reward-zone choices from population calcium activity. Neural signals were analysed from 2 seconds before to 2 seconds after trial completion using cross-validation.
Leading-versus-following selectivity was measured with an auROC-based index:
\[
\mathrm{SI}=2(\mathrm{auROC}-0.5)
\]
Positive values indicated stronger activity during leading, whereas negative values indicated stronger activity during following. Statistical significance was assessed using stratified label shuffling that controlled for reward-port choice.
Spatial Neural Coding
Neural activity was mapped according to the allocentric position of the recorded mouse, the allocentric position of the partner, and the partner’s egocentric position with or without alignment to the recorded animal’s heading.
Spatial maps used 5 × 5-cm bins and excluded frames in which either mouse was within 10 cm of a reward port. Neurons were classified as spatially selective only when they met criteria for spatial information, spatial coherence, and within-session stability.
Partner distance was decoded using 5-cm bins spanning 0–35 cm. Egocentric partner angle was divided into 15 bins spanning −180 to 180 degrees. Logistic regression classifiers were evaluated using fivefold cross-validation and compared with circularly shifted neural-data controls.
CEBRA Behavioural Embeddings
CEBRA v0.5.0rc1 was trained separately on behavioural variables such as partner distance and egocentric partner angle. Eighty percent of trials were used for training and 20% for testing. Embeddings were compared with temporally shuffled controls.
Behavioural variables were divided into five equal-sized groups, and a modified silhouette score quantified the organization of the resulting neural embeddings.
Trial-by-Trial Partner-Position Analysis
Neural activity was measured during the 2 seconds before the recorded mouse arrived at a reward zone. Social receptive fields were defined as egocentric regions in which partner presence generated more than half-maximal neuronal activity.
Neurons were categorized as front-tuned or rear-tuned according to the angular position of their receptive fields. Trial-level activity was converted into within-neuron percentile ranks and used in logistic regression models to predict leadership, following, or mismatch errors.
Multi-Agent Reinforcement Learning Model
A forward multi-agent reinforcement-learning model simulated two agents navigating an 11 × 11 grid. Agents learned to reach randomly activated reward zones and occupy the same zone simultaneously.
Each agent learned a state-value function using temporal-difference learning. Available actions included staying still and moving up, down, left, or right. Rewards were provided for successful cooperation, whereas penalties were assigned for inactive-zone choices, mismatch errors, omissions, and movement costs.
Multi-Agent Inverse Reinforcement Learning
Foraging trajectories were discretized into a 10 × 10 grid using 5-cm spatial bins. Each mouse had nine possible actions, including diagonal movements. The task was modelled as a two-agent Markov decision process with 10,000 joint states and 81 joint actions.
The joint reward function was decomposed into individual spatial-value maps and an interaction term:
\[
r(s_1,s_2)=\alpha m(s_1)+\alpha n(s_2)+\beta\phi(d(s_1,s_2))
\]
Here, \(m\) and \(n\) represented individual spatial preferences, while \(\phi\) represented the value of the distance between partners. Parameters were estimated using a maximum-entropy policy and regularized coordinate-ascent optimization.
Models were trained on 80% of trials and evaluated using test-set log likelihood. Hyperparameters included a discount factor of γ = 0.90 and a prior variance of \(\sigma_0^2=1.0\). Nested models were compared using χ2 tests.
Additional models incorporated the partner’s egocentric angle by separating front and rear partner positions. Individual reward functions were also estimated by marginalizing the joint policy over the partner’s actions.
Trajectory Simulation and Neural Value Decoding
Observed starting positions were used to simulate individual foraging trajectories from inferred policies. The partner’s observed trajectory was retained, allowing the model to predict the recorded mouse’s reward-zone choice and cooperative success.
To test whether mPFC activity represented model-derived value, linear decoders predicted inferred value from population neural activity. Data were divided into training and testing sets, and performance was measured using the test-set R2. Circularly shifted neural signals generated the null distribution.
Statistics and Reproducibility
Behavioural, chemogenetic, optogenetic, calcium-imaging, and electrophysiological experiments used independent animal cohorts. Sample sizes were based on previous work and established laboratory experience rather than formal power calculations.
Animals were randomly assigned to treatment groups when applicable. Experimenters were blinded whenever possible, although blinding was not feasible for experiments requiring mouse identification or role assignment. Representative behavioural and neural examples were selected from datasets that reflected population-level results.
Animals and datasets were excluded only according to predefined criteria, including unsuccessful training, incorrect viral targeting, poor implant placement, inadequate imaging fields, or low-quality neural signals. The exact number of animals, pairs, sessions, and neurons used in each analysis was reported with the corresponding results.
Use of Large Language Models
Large language models, including ChatGPT by OpenAI and Claude by Anthropic, were used for language editing and refinement. All scientific analyses, interpretations, and conclusions were developed by the authors.
Reporting Summary
Additional information regarding study design, experimental procedures, sample sizes, and reproducibility is available in the Nature Portfolio Reporting Summary associated with the article.
Source: www.nature.com