


NASA Tracks a Powerful 2026 El Niño Through Ocean Heat, Sea Levels and Changing Ocean Color
A climate phenomenon rarer than a solar eclipse and more powerful than a single storm system is unfolding this fall—and NASA is closely tracking it from space.
El Niño is a natural climate pattern that occurs approximately every two to seven years in parts of the equatorial Pacific Ocean. It is characterized by higher-than-normal water temperatures and can disrupt weather patterns around the world.
NASA scientists are monitoring trade winds reversing across parts of the Pacific Ocean. This shift redistributes ocean heat, changes rainfall patterns and raises sea levels in the eastern Pacific.
As of October, the National Oceanic and Atmospheric Administration (NOAA) reported an 83% chance that the strongest El Niño since 1950 was underway. People around the world are already experiencing its effects, including farmers, firefighters and coastal communities.
NASA is using satellite data to follow El Niño from its epicenter in the equatorial Pacific Ocean. Here are the key signs scientists are watching.
1. Kelvin Waves Carry Warm Water Across the Pacific
One of the first clues appeared in January 2026, when warm-water swells known as Kelvin waves appeared in satellite images near Micronesia in the western Pacific Ocean.
Kelvin waves are slow-moving pulses of water that can stretch thousands of miles. Like an underwater highway, they transport heat from the western Pacific toward the east.
As warm water heats the air above it, the air rises and changes atmospheric pressure. These changes weaken or even reverse the trade winds, which normally blow from the Americas toward Asia. As a result, sea levels and ocean temperatures in the eastern Pacific rise further—helping trigger the chain reaction associated with El Niño.
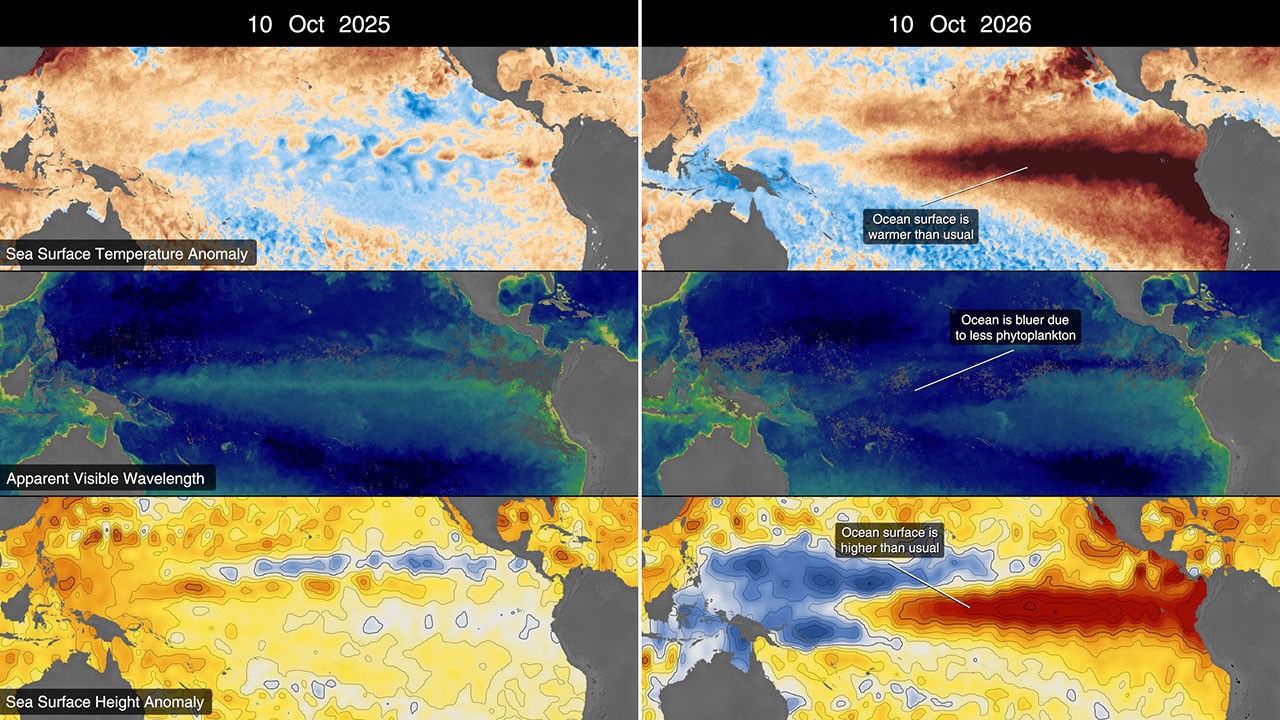
By early April, the Kelvin waves had reached the eastern Pacific Ocean, and sea surface temperatures began to increase. Warm water expands, raising local sea levels by as much as 30 to 40 centimeters, or 1 to 1.3 feet, in some areas.
Higher-than-normal water levels were observed moving toward South America and north along the coast toward California. Meanwhile, areas near Indonesia and northern Australia experienced sea levels 6 to 8 inches, or 15 to 20 centimeters, below normal.
“Kelvin waves are like the heartbeat of El Niño,” said Josh Willis, project scientist for the Sea Surface Mission at NASA’s Jet Propulsion Laboratory in Southern California. “And our ocean-surface satellites allow us to peer into the ocean and see every heartbeat.”
Scientists have used satellite altimeters to measure ocean height with high precision since 1993, creating an uninterrupted data record that continues today. The Sentinel-6 satellite carries advanced radar altimeters that survey millions of square miles of ocean each day. The observations complement data from NOAA’s ocean sensors and buoys that float on the surface and dive below it.
2. Pacific Ocean Temperatures Rise Above Normal
Warmer-than-normal ocean water is one of the best-known indicators of El Niño. Sea surface temperatures in the eastern Pacific Ocean are already about 3 degrees Fahrenheit, or 1.7 degrees Celsius, above the long-term average and could rise by another fraction in the coming months, Willis said.
Satellites equipped with microwave and infrared radiometers can observe through and around clouds while measuring thermal energy at the ocean surface. Satellite observations in 2026 mapped a band of warmer-than-normal water that expanded throughout the spring.
The dark red band stretches across millions of square miles, from the center of the Pacific Ocean to the coasts of South America. Ocean temperatures can influence weather patterns around the world because the air above the water carries heat and moisture into the atmosphere, fueling storms and rearranging rainfall patterns.
3. Ocean Color Reveals a Decline in Phytoplankton
El Niño can also change the color of the ocean. In recent months, parts of the equatorial Pacific have become visibly bluer, and NASA satellites are tracking these subtle color changes.
“Some people think water is just blue, but it’s amazing how many different colors the ocean has,” said Matthew Keri, principal investigator for the PACE satellite team at NASA’s Goddard Space Flight Center in Greenbelt, Maryland.
Some of the ocean’s colors come from microscopic plants called phytoplankton, which form the foundation of the marine food web. Thousands of phytoplankton species exist in shades of blue-green, brown and green.
During this El Niño, colors are fading in the typically green, phytoplankton-rich Pacific region along the equator. This is an expected effect of the climate pattern.
Phytoplankton thrive in cold, nutrient-rich water. When El Niño weakens the trade winds, less nutrient-rich deep water rises to the surface. With less food available, phytoplankton populations can decline, potentially creating cascading effects throughout the marine food web and forcing other marine species to move to new feeding grounds.
This is the first El Niño observed by NASA’s PACE satellite since its launch in 2024. The satellite’s Ocean Color Instrument measures the ocean in hundreds of wavelengths of visible, near-infrared and ultraviolet light.
Researchers use PACE data to track changes in phytoplankton and calculate the average color of the ocean. They simplify the spectrum of light into a single measurement known as the apparent visible wavelength.
The 2026 map shows the green area along the equator in the western Pacific shrinking as more blue hues appear, indicating lower phytoplankton levels. By contrast, the 2025 map shows that the green areas stabilized over time.
“You’re expecting what you think is going to happen,” Kaeli said. “But it’s great to be able to visually see the results of the data products we’re working on in real time.”
NASA Continues Tracking El Niño From Space
NASA scientists will continue monitoring the signs and effects of this El Niño using a constellation of Earth-observing satellites.
“Every time El Niño occurs, it affects almost everyone in some way,” Willis said. “Many people have seen what the ocean can do, and we’re looking to the ocean to understand why.”
View and download NASA’s El Niño data visualizations here.
Source: science.nasa.gov