


Patient Biospecimens, Clinical Data and Tumour Genomic Analysis
All patient biospecimens were collected under Memorial Sloan Kettering (MSK) Institutional Review Board protocols 06-107, 12-245, 14-244 and 22-404. Sample sizes were not predetermined using a statistical method. Single-cell RNA sequencing (scRNA-seq) datasets from matched normal colon, primary colorectal cancer (CRC) tumours and metastatic lesions were obtained from a previously published study10. Patient-derived organoids (PDOs) were established and validated from two primary tumours, MSK125P and OKG146P, and two liver metastases, MSK125Li and OKG146Li, as previously described7,10.
Tumour whole-exome sequencing (WES) was performed by recapturing DNA originally processed for targeted exon sequencing with MSK-IMPACT67. Median WES target coverage was 129× for tumour samples and 101× for normal samples. WES data were analysed using the TEMPO pipeline, available on GitHub. The OncoKB precision oncology knowledgebase, an FDA-recognized human genetic variant database curated by MSK experts68, was used to classify oncogenic alterations and variants of unknown significance. Only somatic alterations annotated by OncoKB as oncogenic, likely oncogenic or predicted oncogenic were included in downstream analyses.
Archival formalin-fixed, paraffin-embedded (FFPE) tissue blocks from patients with ZFP36L2 wild-type or mutant tumours were identified using WES data from tumour DNA originally collected for MSK-IMPACT. Tissue processing, FFPE section selection and histopathological interpretation were supervised by an expert gastrointestinal pathologist (J.S.).
Single-Cell RNA Sequencing Analysis of Patient CRC Samples
Normalized gene-expression matrices were downloaded from the Human Tumour Atlas Network (HTAN) Data Portal (http://humantumouratlas.org/publications/hta8_crc_moorman_2024) and processed as previously described10. Analyses were limited to patient-matched primary tumour and liver metastasis pairs from 25 patients. After quality filtering, 38,272 cells remained, including primary tumour cells (13,102), metastatic cells (12,215), intestinal stem cells (ISC; 1,145), absorptive precursor cells (2,805), enterocytes (1,214), BEST4+ enterocytes (1,339), secretory precursors (3,818), goblet cells (1,720), tuft cells (751) and enteroendocrine cells (163). Differential-expression, pathway and correlation analyses were restricted to this epithelial-cell compartment.
Single-Cell Data Visualization
Two-dimensional cell embeddings were generated with Scanpy v.1.9.1. A k-nearest-neighbour (KNN) graph was constructed from principal components using Euclidean distance with k = 20. Cells were visualized using the ForceAtlas2 force-directed layout, and subsequent plots were generated with Matplotlib v.3.6.0.
Gene Signature Score Calculation
Gene signature scores were calculated with the Scanpy v.1.9.1 score_genes function. This method compares the mean expression of genes in a target signature with matched reference genes. To reduce bias caused by differences in baseline expression, z-scored expression data were used as input.
Identification of ISC-Like Tumour Cell States
To identify malignant epithelial cells with an intestinal stem cell-like transcriptional programme, the dataset was first restricted to malignant epithelial cells. Raw counts from primary tumour and metastatic cells were normalized by total-count normalization and log-transformed. The 3,000 most highly variable genes (HVGs) were used for principal component analysis (PCA), neighbourhood graph construction with n_neighbours = 20 and Leiden clustering.
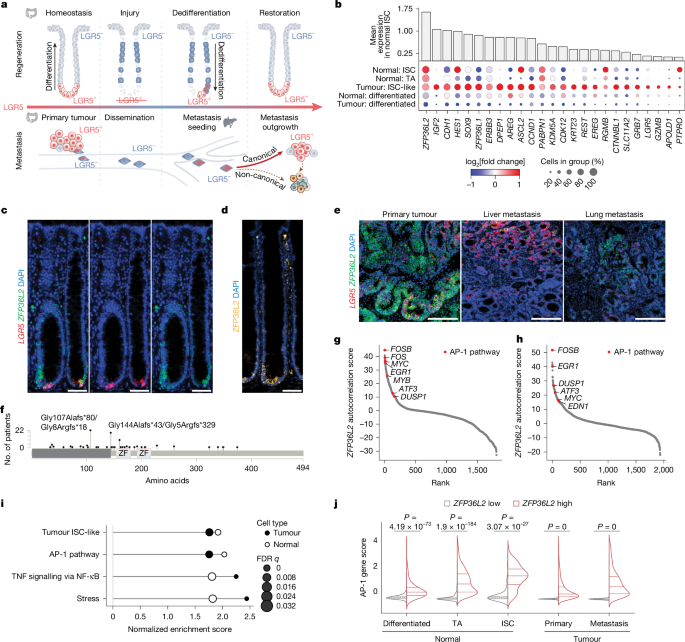
Stemness was assessed by calculating the median cluster-level expression of ISC marker genes from the Hotspot-derived tumour ISC-like gene module 29 (Supplementary Table 1a), as previously described10. The bimodal distribution of cluster-level scores was used to define an ISC-like threshold. This tumour-derived threshold was also applied to normal cell types. ISC-like signature scores were calculated from z-normalized expression using the Scanpy score_genes function (Fig. 1b and Extended Data Fig. 1a).
Differential Gene Expression Between Normal and Tumour ISC-Like Cells
Differential gene expression (DEG) analysis was performed with the Wilcoxon rank-sum test implemented in scanpy.tl_rank_genes_groups. Normal and tumour cells were compared after stratification by ISC-like annotation using the log-normalized expression matrix. Analysis was restricted to genes from the previously defined tumour ISC-like Hotspot module 2910, and the most significant genes were selected for visualization (Fig. 1b). Log2 fold changes were calculated relative to each gene across the specified cell-type groups.
To further characterize tumour ISC-like activity, mean imputed expression for each gene in module 29 was calculated across canonical ISC cells. Genes were ranked according to mean imputed expression to identify ISC-enriched transcripts.
Gene Autocorrelation Signatures in Normal and Tumour Cells
Hotspot v.0.9.169 was used to calculate pairwise local gene correlations from the KNN graph. This approach identifies genes with high local autocorrelation and is designed to reduce the effects of gene dropout and technical noise when detecting context-specific co-expression programmes.
Analyses were performed separately for tumour cells (25,317 cells) and normal cells (12,955 cells). The 2,000 most highly variable genes were selected from the untransformed expression layer, with ZFP36L2 manually included. Ribosomal, mitochondrial and long non-coding RNA genes, as well as genes with non-informative variation, were excluded. A 50-nearest-neighbour graph was generated from the precomputed PCA embedding, and raw UMI counts were restored to the counts layer. Hotspot analysis used a depth-adjusted negative-binomial model with neighbourhoods defined by 15 nearest neighbours. Moran’s I spatial autocorrelation scores were calculated for all genes. Genes with a false discovery rate (FDR) of <0.05 were retained for downstream analysis (Fig. 1i and Extended Data Fig. 1g).
Gene Set Enrichment Analysis
Gene set enrichment analysis (GSEA) was performed using GO biological-process, Hallmark, PID, KEGG and previously defined Hotspot gene sets10 (Supplementary Table 1b). The prerank function in GSEApy v.0.14.0 was used with 10,000 permutations and default parameters.
Statistical Analysis of Patient scRNA-seq Data
Pairwise comparisons of PID–AP-1 pathway65 scores, tumour ISC-like Hotspot module 29 scores10 and ZFP36L2 expression were performed across cell-type groups using Mann–Whitney U-tests. Multiple-testing correction was performed with the Bonferroni method, with adjusted q < 0.05 considered significant.
Mouse Colon Epithelial Cell scRNA-seq Analysis
Mouse scRNA-seq Data Acquisition and Quality Control
Mouse colon epithelial scRNA-seq data were downloaded from the Gene Expression Omnibus (GEO; GSE168448)66. Cells with mitochondrial transcript fractions above 0.2 were removed. Additional outliers were identified using the median absolute deviation (MAD) method and criteria adapted from previous studies70,71. Cells meeting at least two of five predefined library-size, gene-count, highly expressed gene, feature-distance or mitochondrial-content criteria were excluded. Same-sample doublets were identified and removed with scDblFinder v.1.16.072.
Normalization, Highly Variable Genes, PCA and Denoising
Count data were median-normalized and log-transformed using a pseudo-count of 1. The top 2,000 HVGs were selected with Scanpy v.1.9.8 using the Seurat v.3 method73,74. PCA was performed using 280 components, which explained 75% of the variance. Denoising was conducted with MAGIC74,75,76 through the Scanpy external API with default settings, except that all 280 principal components were used for neighbourhood calculations.
Mouse Cell-Type Annotation
Cell types were annotated by scoring denoised expression against cell-type-specific marker gene sets with Scanpy’s score_genes function, which implements a previously described scoring method77. Each cell was assigned to the cell type with the highest score.
Mouse Experimental Methods
Mouse Strains, Randomization and Experimental Design
All animal procedures were approved by the Institutional Animal Care and Use Committee of Memorial Sloan Kettering Cancer Center. C57BL/6J, Vil1cre, Lgr5eGFP-IRES-creERT2 and NSG mouse strains were obtained from The Jackson Laboratory. Zfp36l2fl/fl mice40 were provided by M. Turner, and Lgr5DTR-eGFP mice5 were provided by F. de Sauvage. Genotyping primers are listed in Supplementary Table 4b.
Only female NSG mice were used for xenograft experiments. All other studies used equal proportions of male and female mice, with littermates distributed across experimental groups. Sample sizes were not determined statistically; groups contained 5–15 animals per condition based on prior experience with xenograft and colitis models and the 3Rs principles. Mice were randomly assigned to groups, and blinding was used whenever feasible.
DSS-Induced Colitis and Colonic Regeneration
Experimental cohorts were bred on a C57BL/6J background and included littermate controls. Intestinal epithelial-specific Zfp36l2 knockout mice (Zfp36l2IEC) were generated by crossing Zfp36l2fl/fl mice with Vil1cre mice. At 6–8 weeks of age, mice received 3.5% (w/v) dextran sulfate sodium (DSS; molecular weight 36–50 kDa; MP Biomedicals) in drinking water for 7 days, followed by regular water for 7 days. Body weight was recorded daily. Caecal and colonic tissues were collected, processed as Swiss rolls, fixed in 4% paraformaldehyde and embedded in paraffin for haematoxylin and eosin staining, immunostaining or FISH.
LGR5–eGFP Quantification by Crypt Flow Cytometry
Lgr5eGFP-IRES-creERT2 mice were crossed with Vil1cre and Zfp36l2fl/fl mice to generate Lgr5eGFP-IRES-creERT2+;Vil1cre+;Zfp36l2IEC mice and littermate controls. Colons from 6–8-week-old mice were flushed with PBS, opened longitudinally and cut into approximately 1-cm segments. Tissue was incubated in PBS containing 8 mM EDTA, 0.5 mM DTT and 10 U ml–1 DNase I at 4 °C for 60 min with gentle shaking. Crypts were released by vigorous shaking, pelleted and dissociated with TrypLE. Cell suspensions were treated with DNase for 5 min at room temperature and filtered through 40 μm strainers.
Viable epithelial cells were identified by forward and side scatter and exclusion of DAPI. Lgr5eGFP-IRES-creERT2–;Vil1cre+;Zfp36l2WT mice served as gating controls. Two independent experimental batches were pooled for analysis.
In Vivo Lgr5DTR Cell Ablation
Lgr5DTR-eGFP+ and littermate Lgr5DTR-eGFP− controls were generated by breeding. Lgr5DTR-eGFP+ZFP36L2IEC mice were produced by crossing Lgr5DTR-eGFP+;Vil1cre+ and Zfp36l2fl/fl mice with appropriate littermate controls. Diphtheria toxin (DT; 0.005 μg μl–1 in PBS) was administered intraperitoneally at 0.05 μg g–1 body weight every 48 h for four doses. Mice were 8–10 weeks old. Colons were collected at the indicated time points, processed as Swiss rolls and fixed in 4% paraformaldehyde for 24 h at room temperature before transfer to 70% ethanol and paraffin embedding.
In Vitro Lgr5DTR Ablation and Dedifferentiation
Colon organoids were established from Lgr5DTR-eGFP+;Vil1cre+;Zfp36l2fl/fl and control mice. Approximately 1,000 crypts were embedded in 40 μl Matrigel and cultured in mouse WRENAFI (mWRENAFI) medium containing advanced DMEM/F12, GlutaMAX, HEPES, N-acetyl-l-cysteine, B27, N2 and Primocin, supplemented with EGF, Noggin, A8301, FGF2, IGF-I, NGS-WNT and R-spondin1.
After stable organoid lines were established, 20,000 single cells were seeded per 40 μl Matrigel and cultured for 4 days. Cultures were then treated with 0.6 μg ml–1 DT or vehicle for 24 h. LGR5–eGFP+ cell depletion was confirmed by flow cytometry. Viable DAPI-negative cells were sorted, embedded at 2,000 cells per 40 μl Matrigel and cultured for 5 days. Regenerated organoids were quantified using BioTek bright-field imaging with whole-dome z-projection, and eGFP+ cells were measured by flow cytometry.
Orthotopic CRC Xenograft Experiments
Six-week-old NSG mice were housed under specific pathogen-free conditions with controlled temperature, humidity and a 12-h light–dark cycle. Animals received standard chow or irradiated chow containing 2,500 ppm doxycycline, with water available ad libitum.
For orthotopic caecal and intrasplenic transplantation, CRC organoids expressing thymidine kinase–eGFP–luciferase and doxycycline-inducible shRNAs against ZFP36L2 or Renilla control were further transduced with pLenti-PGK-Akaluc. Transplantation was performed as previously described7,10. To generate the OKG146Li-MS2 line, approximately 500,000 OKG146Li organoid cells were injected into mouse liver in 50% Matrigel. Tumours were recovered, minced and cultured in HISC medium with antibiotics. This in vivo selection was repeated twice.
For caecal injection, 5 × 10⁵ cells from primary tumour organoids MSK125P and OKG146P or liver metastasis organoids OKG146Li and MSK107Li were suspended in 10 μl of 50% Matrigel and 50% PBS and injected into the caecal submucosa. Engraftment was confirmed by bioluminescence imaging (BLI) one week later. Signal-negative animals were excluded. Mice were then placed on doxycycline chow and monitored weekly by BLI for 15 weeks before euthanasia.
For splenic-vein injections, mice received doxycycline chow 24 h before surgery. MSK107Li and OKG146Li-MS2 organoids were treated with doxycycline ex vivo for 7 days, and 5 × 10⁵ cells were injected into the spleen, followed immediately by splenectomy. BLI was performed after surgery to establish the week-0 baseline. Animals were maintained on doxycycline for 10–15 weeks or until the humane endpoint.
BLI was performed with an IVIS Spectrum Xenogen system and analysed using Living Image v.2.50. Groups contained at least five age-matched and sex-matched mice. Animals were monitored daily. Humane endpoints included distress, impaired grooming, hunched posture, weight loss exceeding 20%, tumour burden above 10% of body mass, body condition score below 2 or route-specific maximum durations. No experiment exceeded these criteria. Histopathological scoring was performed blinded.
Mouse Organoid Dedifferentiation Assay
Colons from three 6–8-week-old mice of each genotype were processed to isolate crypts. Approximately 1,000 crypts were embedded in 40 μl Matrigel and cultured in mWRENAFI medium. Stable organoid lines were dissociated, and 2,000 cells were embedded per 40 μl Matrigel with 10 μM Y-27632 for 3 days. Organoids were then cultured for 2 days in mENAFI medium lacking NGS-WNT and R-spondin1 to induce differentiation. Loss of LGR5+ ISCs was confirmed by GFP flow cytometry. Differentiated organoids were dissociated, viable cells were sorted and 2,000 cells were replated per 40 μl Matrigel to measure dedifferentiation by organoid formation. Five to six technical replicates from three biological replicates were pooled for analysis.
Multiplexed Tissue Staining and Imaging
Collagen Embedding of Patient-Derived Organoids
Day-7 CRC PDOs were recovered from Matrigel and suspended in neutralized collagen I. Collagen domes were formed in tissue capsules, incubated for 30 min at 37 °C and cultured overnight in tissue-culture medium. Capsules were washed with PBS, fixed in 4% paraformaldehyde for 24 h at room temperature and stored in 70% ethanol at 4 °C before paraffin embedding.
RNA Fluorescence In Situ Hybridization
FFPE embedding and sectioning were performed by the MSKCC Molecular Cytology Core. Five-micrometre sections were processed on a Leica Bond RX system, baked, dewaxed and subjected to EDTA-based epitope retrieval. Single-probe FISH used ready-to-use Advanced Cell Diagnostics RNA probes hybridized for 2 h at 42 °C. RNAscope detection was performed with the RNAscope 2.5 LS Reagent kit–Brown, with fluorescent CF594/Tyramide used in place of DAB. Slides were counterstained with DAPI and mounted in Mowiol 4–88.
For double FISH, hLGR5-C1 and hZFP-C2 probes were hybridized to 5-μm FFPE sections for 2 h at 42 °C and detected with an RNAscope LS Multiplex Reagent kit. Alexa Fluor 488 and CF594 Tyramide reagents were used for fluorescence detection. Probes included Hs-ZFP36L2, Mm-Zfp36l2, Mm-Lgr5, Hs-LGR5, Hs-GDF15, Hs-HILPDA, Hs-GADD45A, positive-control Hs-PPIB and negative-control dapB.
Multiplex FISH with Immunofluorescence
After FISH staining and scanning, coverslips were removed and slides were processed using the immunofluorescence protocol described below.
Single Immunofluorescence Staining
Five-micrometre FFPE sections were dewaxed on a Leica Bond RX system and subjected to EDTA-based antigen retrieval for 20 min at 100 °C. Primary antibodies were incubated for 1 h at room temperature. Leica Bond Polymer anti-rabbit HRP or the appropriate linker system was then applied. Fluorescent signal was detected using Alexa Fluor or CF Tyramide amplification reagents. Slides were counterstained with DAPI, mounted in Mowiol 4–88 and stored at −20 °C before imaging.
Multiplex Immunofluorescence
Multiplex immunofluorescence was performed sequentially using the single-staining procedure. Secondary detection used Leica Bond Post-Primary rabbit anti-mouse linker for human samples or rabbit anti-mouse linker for mouse samples, followed by Leica Bond Polymer anti-rabbit HRP. Epitope retrieval was repeated between staining rounds to remove previously bound antibodies. The primary antibodies targeted ZFP36L2, MUC2, pan-cytokeratin, KI67, CK20, CK5, CHGB, DDX6, G3BP1 and PABPC1. Slides were counterstained with DAPI, mounted in Mowiol 4–88 and stored overnight at −20 °C.
FISH and Immunofluorescence Imaging
FISH and immunofluorescence slides were scanned using a Pannoramic scanner with a ×40/0.95 NA objective.
Quantification of Mouse Crypt FISH and IF
Thirty-one crypts were exported as TIFF files using Slide Viewer and analysed with ImageJ/FIJI. DAPI-based thresholding and watershed segmentation were used to identify cells. The Lgr5 channel was thresholded to create a distance map, which was overlaid with segmented cells to determine marker positivity and distance from Lgr5.
Quantification of Tumour Marker FISH and IF
Regions of interest were exported as TIFF files and analysed in ImageJ/FIJI. Cells were segmented using DAPI thresholding and watershed processing. Fluorescence intensity and area were measured for each marker, and marker positivity was classified on a per-cell basis.
Patient-Derived CRC Organoid Experimental Methods
Patient-Derived CRC Organoid Culture
CRC organoids were expanded in HISC medium containing advanced DMEM/F12, GlutaMAX, HEPES, N-acetyl-l-cysteine, B27, N2 and Primocin, supplemented with EGF, Noggin, A8301, FGF2 and IGF-I. Where indicated, organoids were cultured in IGFF medium lacking EGF, Noggin, A8301, FGF2 and IGF. Doxycycline was added at 2 μg ml–1 where specified, and medium was changed every 2 days. Organoid identity was verified by short tandem repeat analysis, and all lines tested negative for mycoplasma using the MycoAlert PLUS kit.
For downstream experiments, day-7 organoids were released from Matrigel with 2 mM EDTA in DPBS at 4 °C for 30–60 min and dissociated with TrypLE at 37 °C. The reaction was stopped with wash buffer, and cells were filtered through a 40 μm strainer. Cells were embedded at 375 cells per μl Matrigel for passaging and 50 cells per μl for organoid-formation and IC50 assays. Lentiviral transduction was performed as previously described42, followed by antibiotic selection with puromycin, blasticidin or geneticin.
Plasmid Construction and Lentiviral Transduction
Doxycycline-inducible ZFP36L2 knockdown constructs were generated by inserting miR-30a-based shRNA sequences into the pTRIPZ lentiviral vector. Non-targeting control constructs were obtained from Addgene. For ZFP36L2 knockout, sgRNAs targeting ZFP36L2 were cloned into the doxycycline-inducible Cas9 vector TLCV2. Transduced organoids were selected with puromycin, induced with doxycycline, sorted for eGFP expression and expanded as single clones. Knockout was confirmed by western blotting.
Wild-type human ZFP36L2, eGFP-tagged constructs, a frameshift mutant and ADAR-fusion constructs were generated by PCR, Gibson assembly or site-directed mutagenesis. HyperTRIBE constructs contained the hyperactive E488Q ADAR catalytic domain fused to WT or frameshift-mutant ZFP36L2, followed by a T2A-eGFP reporter. H2B–mCherry was used for nuclear labelling in live-cell imaging. Plasmid sequences are listed in Supplementary Table 4a.
Western Blotting
Approximately 2 million organoid cells were recovered from Matrigel with EDTA, washed and lysed in RIPA buffer containing protease and phosphatase inhibitors and benzonase. Lysates were sonicated, and protein concentration was measured using a BCA assay. Fifty micrograms of protein per sample were separated by SDS–PAGE, transferred to PVDF membranes and blocked with 5% non-fat milk in TBST. Membranes were incubated overnight with antibodies against β-actin, GAPDH or ZFP36L2, followed by HRP-conjugated secondary antibodies. Signals were detected using an iBright CL1000 system and SuperSignal West Femto substrate.
Reverse Transcription and Quantitative PCR
Total RNA was extracted with the RNeasy Mini kit, and cDNA was synthesized from 2 μg RNA. Quantitative PCR was performed using TaqMan assays for ZFP36L2, GAPDH and ACTB on an ABI QuantStudio 7 Pro system. Relative expression was calculated using the \({2}^{-\Delta \Delta {C}_{t}}\) method and normalized to GAPDH or ACTB.
CRC Organoid Dedifferentiation and scRNA-seq
OKG146P organoids expressing shZFP36L2 or shCtrl were cultured in HISC medium containing doxycycline for 7 days before scRNA-seq. Parallel organoids were cultured in IGFF medium for 7 days to induce differentiation and then returned to complete HISC medium for 7 days to promote dedifferentiation into an ISC-like state. Continuously HISC-cultured organoids served as controls.
Single-cell suspensions were labelled with TotalSeq hashtag antibodies, sorted as viable DAPI-negative cells and pooled in equal numbers. Libraries were prepared using the Chromium Single Cell 3′ v.3.1 platform. Up to 10,000 cells per sample were targeted. Cell viability exceeded 90%. Libraries were sequenced on an Illumina NovaSeq S4 using 28-cycle read 1, 8-cycle i7 indexing and 90-cycle read 2.
scRNA-seq Processing and Quality Control
Ambient RNA contamination was removed with CellBender v.1.0.0, and doublets were identified with DoubletDetection v.3.0. Cells with library sizes outside 3 MADs below or 5 MADs above the median were removed. Cells with fewer than 500 counts, fewer than 400 detected genes, more than 20% mitochondrial transcripts or other poor-quality metrics were excluded. Hashtag-associated genes were removed to limit multiplexing artefacts.
Normalization and Batch Correction
Expression data were normalized with Scran v.3.20 and log-transformed. The 5,000 most variable genes were identified with Seurat v.3. Batch correction was performed using scVI with 100 latent dimensions and mitochondrial content included as a covariate.
Dimensionality Reduction and Clustering
PCA retained 280 components explaining 75% of the variance. Cells were clustered using Leiden clustering at a resolution of 1.8, and UMAP was used for visualization. Differential expression was assessed with the Wilcoxon rank-sum test.
Local Variability Analysis
Local variability was measured using KNN entropy, calculated as the Shannon entropy of ZFP36L2 expression across each cell’s 15-nearest-neighbour graph. Expression variability between conditions was displayed with boxplots and kernel-density plots.
Differential Abundance Analysis
MELD80 was used to divide the UMAP embedding into transcriptionally similar neighbourhoods and quantify relative differences in regional abundance between experimental conditions, including shZFP36L2 and shCtrl.
Cell-State Classification
PhenoGraph81 was used for graph-based cell-state classification. An affinity matrix was constructed from nearest-neighbour relationships, and Harmony82 was used to correct batch effects. Cell-state labels were assigned by propagating annotations from reference patient-derived cell states.
Bulk RNA Sequencing
Total RNA was extracted from organoids using the RNeasy Mini kit. Three technical replates were prepared for each sample. Following RiboGreen quantification and Agilent BioAnalyzer quality control, 300 ng of high-quality RNA with RIN values of 9.8–10 was used for poly(A) selection and TruSeq library preparation. Barcoded libraries were sequenced on an Illumina NovaSeq 6000 PE100 flow cell, generating an average of 109 million paired reads per sample. Ribosomal reads accounted for 0.4–0.7% of reads, and mRNA bases represented approximately 92% of the total.
Bulk RNA-seq Data Analysis
Adapters were removed with Cutadapt v.4.8. Reads were aligned to the human hg38 reference genome using STAR v.2.7.11b. Gene-level counts were generated with HTSeq v.2.0.5, and differential expression was analysed with DESeq2 v.1.42.0.
HyperTRIBE RNA-Editing Analysis
WT or frameshift-mutant ZFP36L2 was fused to the hyperactive E488Q ADAR catalytic domain to identify interacting mRNAs through A-to-I editing detected as A-to-G changes in RNA-seq data48. Following doxycycline induction, eGFP-positive cells were sorted and RNA-seq libraries were prepared. Reads were trimmed with Cutadapt and aligned to hg38 and construct sequences using STAR. RNA-editing sites were identified with GATK HaplotypeCaller and filtered to retain strand-specific A-to-G or U-to-C substitutions. Known dbSNP variants were excluded. Editing frequencies were evaluated with a beta-binomial test and adjusted using the Benjamini–Hochberg method.
Comparison of Gene Decay Rates
MSK107Li and OKG146Li PDOs expressing shCtrl or shZFP36L2 were cultured with doxycycline and treated with or without 5 μg ml–1 ActD for 5 h. RNA was extracted, sequenced and analysed as described above. Gene decay rates were calculated by comparing treated and untreated normalized counts in knockdown and control samples using the following formula:
$$\mathrm{Gene}\times \mathrm{ZFP}36{\rm{L}}2\,\mathrm{dependency}={\log }_{2}\left[\frac{\mathrm{gene}\times \mathrm{mean}\,\mathrm{count}\,\mathrm{in}\,\mathrm{shZFP}36{\rm{L}}2(\mathrm{treated})/\mathrm{shZFP}36{\rm{L}}2(\mathrm{untreated})}{(\mathrm{gene}\times \mathrm{mean}\,\mathrm{count}\,\mathrm{in}\,\mathrm{shCtrl}(\mathrm{treated})/\mathrm{shCtrl}(\mathrm{untreated})}\right]$$
SLAM-seq for RNA Metabolic Labelling and Decay Kinetics
RNA decay kinetics were measured using SLAM-seq52 with a SLAM-seq Kinetics kit and QuantSeq 3′ mRNA-seq library preparation. Newly synthesized RNA was metabolically labelled with 4sU, chemically alkylated and detected through diagnostic T > C conversions. Because 4sU is light-sensitive, samples were protected from white light throughout labelling and library preparation.
A viability titration identified 500 μM 4sU as a non-toxic concentration. Organoids were labelled for 6 h, with fresh 4sU-containing medium added every 2 h. Samples were collected immediately after labelling and after a chase with HISC medium containing 50 mM uridine for 2, 5 and 12 h. RNA was extracted with TRIzol, alkylated with iodoacetamide and used to generate strand-specific 3′ mRNA-seq libraries with unique dual indices.
SLAM-seq Processing and RNA Half-Life Analysis
SLAM-seq reads were processed using the nf-core/slamseq pipeline v.1.0.0 in Nextflow. Reads were trimmed, aligned with Slamdunk, screened for genomic T > C variants and quantified for total and converted reads. Counts were summarized at the UTR and gene levels, and quality-control metrics were compiled with MultiQC. Human organoid data were aligned to GRCh38 using the 3′ UTR annotations and configurations described previously83.
Conversion rates were background-corrected using matched unlabelled samples. Because residual 4sU in Matrigel delayed peak labelling, the 2-h time point was treated as the first effective decay point for 5,888 genes. Half-lives were estimated by fitting a single-exponential decay model to the 2-, 5- and 12-h time points, using t1/2 = ln(2)/k. Comparisons included genes with a control-condition model fit of R2 exp > 0.6.
Live-Cell Confocal Microscopy
Stably transduced, doxycycline-inducible eGFP, fsZFP36L2–eGFP, ZFP36L2–eGFP and meGFP organoids were seeded in a 1:1 mixture of culture medium and Matrigel on Ibidi glass-bottom chamber slides. Imaging was performed with a Nikon CSU-W1 SoRa spinning-disk confocal microscope using a ×60, 1.49 NA oil-immersion objective, 300 ms exposure, 5% laser power and 1 μm z-stack intervals. Experimental treatments and imaging windows are provided in the figure legends. For nuclear–cytoplasmic shuttling studies, organoids were co-transduced with H2B–mCherry and imaged using continuous 0.2 μm z-stacks.
Condensate Tracking and Image Analysis
Time-lapse videos were corrected for drift with the Correct 3D Drift Fiji plugin using the condensate channel and restricting correction to the x–y plane. Background fluorescence was reduced with a 50 μm rolling-ball subtraction. Three-dimensional condensates were detected and tracked with TrackMate 7 using a difference-of-Gaussians detector with a 1.25 μm sigma and the Simple LAP tracker. Maximum linking and gap-closing distances were 4 μm and 2 μm, respectively. Tracks spanning fewer than two frames were excluded. Remaining trajectories were overlaid on maximum-intensity projections for visualization.
Fluorescence Recovery After Photobleaching
FRAP was performed with a Leica Stellaris confocal system using a ×63, 1.4 NA oil-immersion objective. Doxycycline-inducible eGFP, fsZFP36L2–eGFP and WT ZFP36L2–eGFP organoids were induced 24 h before imaging. A 1.5 × 1.5 μm region of interest was bleached at 35% laser power for 15 frames, followed by 30 frames of recovery imaging. Fluorescence intensity was quantified with Fiji, and the mobile fraction was calculated as:
$$\mathrm{Mobile}\,\mathrm{fraction}=\frac{F(\infty )-F(0)}{F(\mathrm{pre})-F(0)}$$
Here, F(∞) is the steady-state fluorescence after recovery, F(0) is the intensity immediately after bleaching and F(pre) is the pre-bleach fluorescence intensity.
Statistics, Reproducibility and Data Exclusion
Sample sizes were not predetermined using statistical methods. The number of samples (n) and statistical tests are reported in the relevant figure panels and legends. In vitro experiments were independently repeated at least three times with similar results unless otherwise indicated. Staining experiments included at least three biological replicates. Mice that died within 24 h of surgery because of procedure-related complications were excluded; no other data were excluded.
Reporting Summary
Additional information about the research design is available in the Nature Portfolio Reporting Summary linked to this article.
Source: www.nature.com