


By Shira Ozeren Hachoglu, Security Research Engineer at Picus Security.
Blue Report 2026: Why Cybersecurity Prevention Scores Do Not Tell the Full Story
A prevention score shows which attacks security controls recognize. It does not always show what those controls can actually stop.
Now in its fourth year, the Blue Report 2026 from Picus Labs measures how enterprise prevention and detection controls perform in production. The report analyzes more than 338 million attack simulations conducted in real customer environments between January and June 2026.
The headline finding suggests a recovery: the average enterprise prevention rate increased from 62% to 69%, returning to its 2024 peak.
However, this average across the security stack hides significant weaknesses. The same controls that block widely recognized attack tools may allow quieter variations of the same techniques to bypass defenses.
The outcome is determined not only by the security products an organization deploys, but also by whether those products understand the attacker’s behavior and have been tested against alternative execution methods.
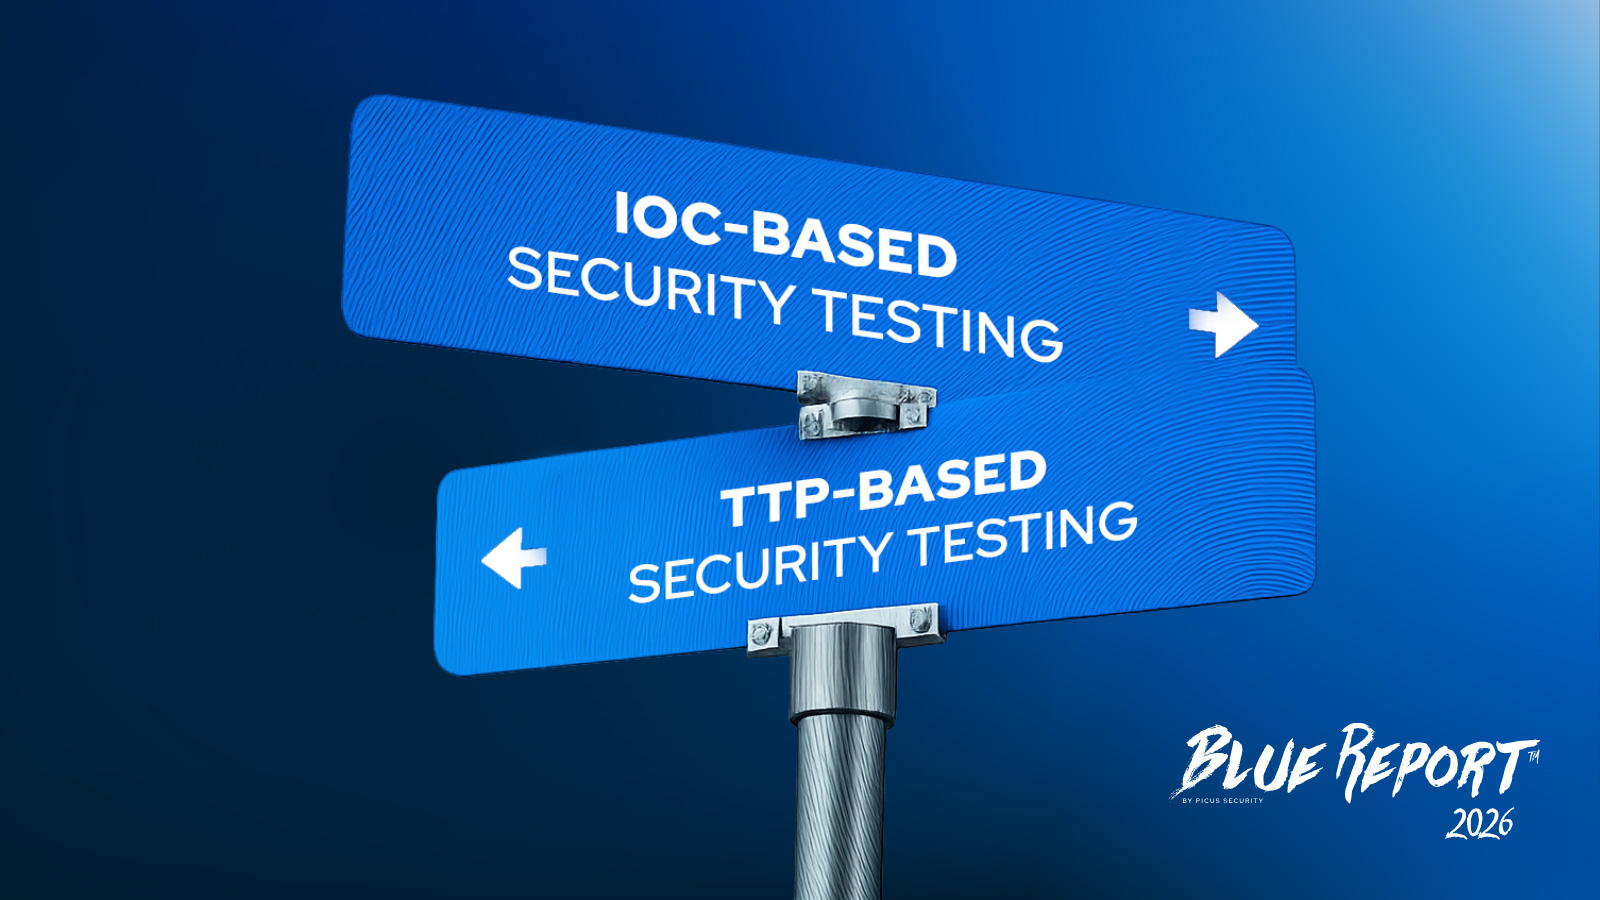
IOC-Based and TTP-Based Security Tests Measure Different Things
The effectiveness of a defense depends on the question being asked.
IOC-based tests determine whether a control recognizes known malicious artifacts. These tests may involve malware samples or download attempts delivered through perimeter controls such as firewalls, web proxies, and secure email gateways.
For perimeter security, this is an appropriate measurement. These controls are designed to identify and block known malicious content before it reaches users or systems.
TTP-based behavioral tests determine whether a control can stop an action, regardless of how it is performed. The question is not, “Can the security tool detect Mimikatz?” Instead, it is, “Can a process on this host obtain credentials?”
This is the question endpoint, intrusion detection, and security monitoring controls must answer. By the time these controls are involved, an attacker is often already executing code in the environment.
Attack artifacts can be modified cheaply. The underlying behavior is much harder to change.
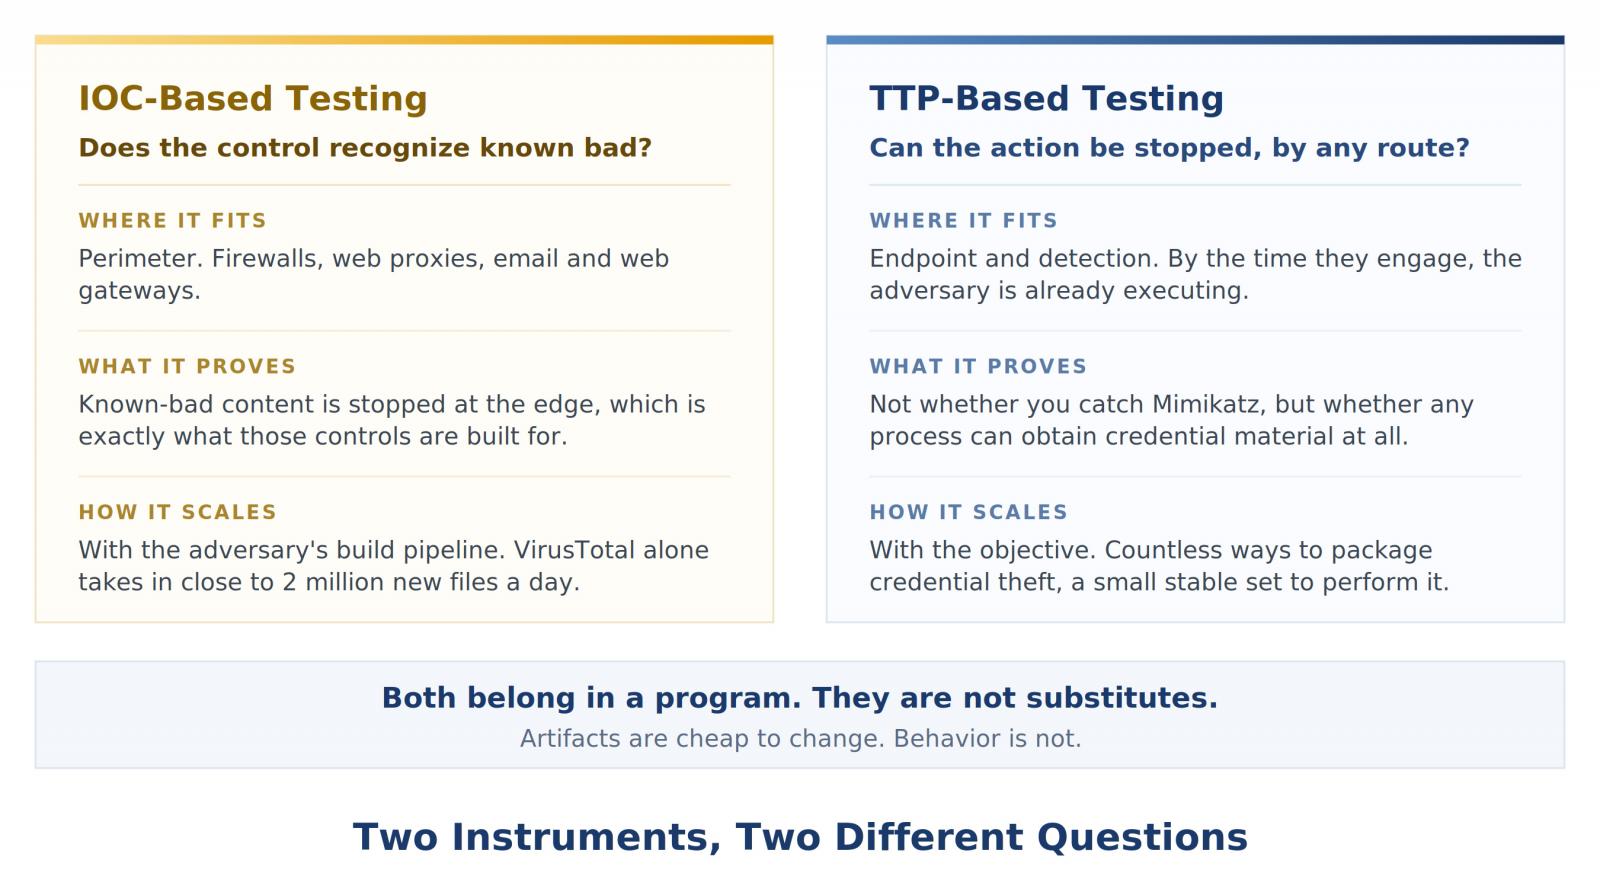
Both testing approaches are necessary. IOC-based testing validates protection at the perimeter, while TTP-based testing reveals whether security controls can detect and stop attacker behavior after an intrusion.
The difference between these approaches is structural and important. Unfortunately, the gap between artifact-based protection and behavioral coverage can be substantial.
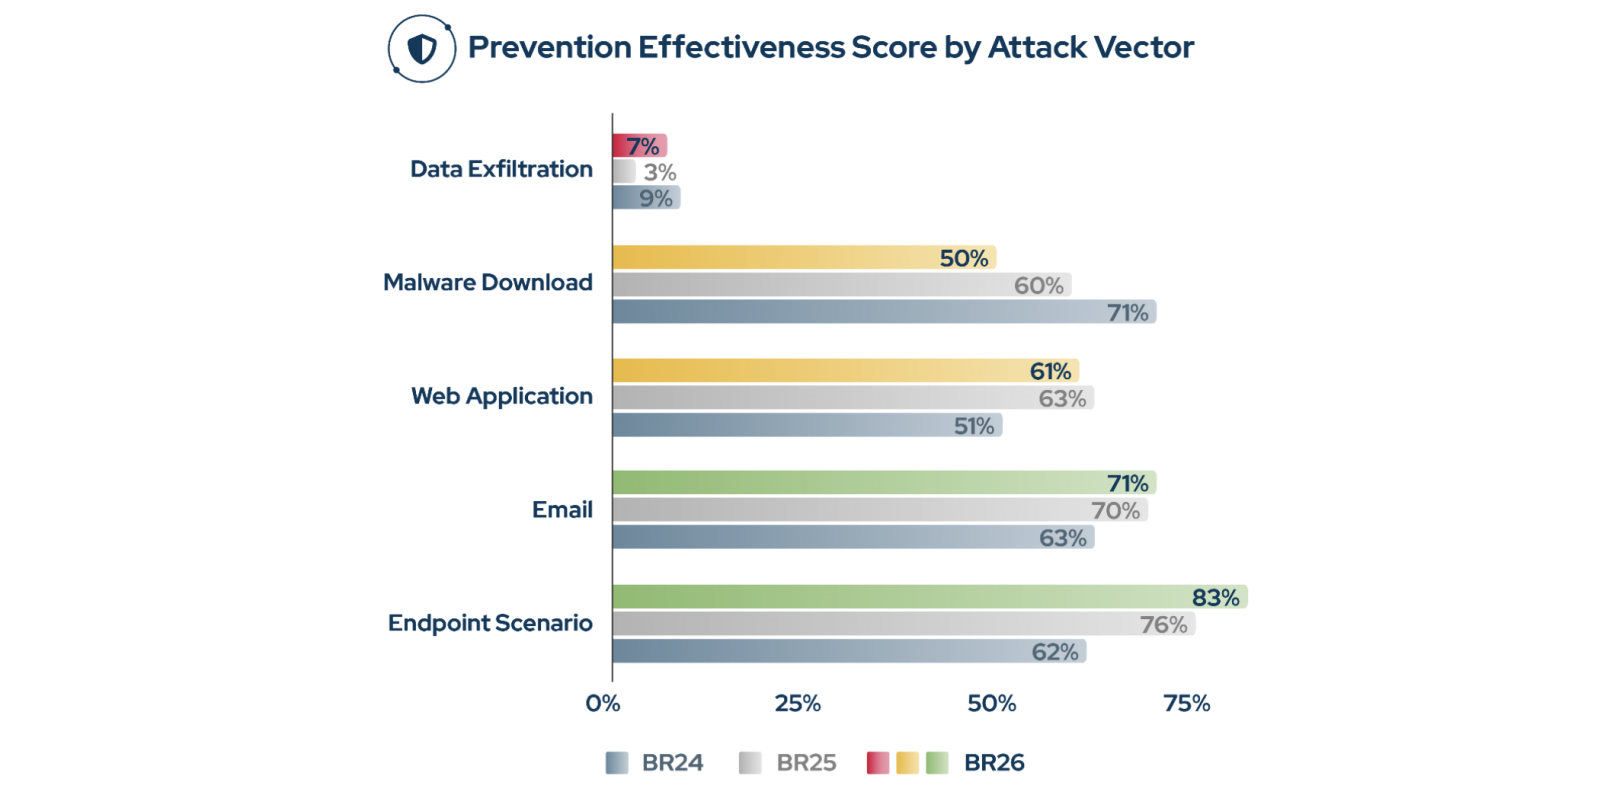
According to this year’s data, IOC-based protection against malware downloads fell to 50% across customer environments, down from 60% in 2025 and 71% in 2024.
Even security layers that traditionally rely on signatures are becoming less effective. More importantly, a passing result at this layer says little about whether the underlying behavior is detectable.
A security control may block the version of an attack it recognizes. If the same behavior is performed through a quieter route, the control may still report coverage even though the attack succeeds.
Blue Report 2026 shows why organizations must test attacker behavior—not just the specific tools or steps already known to security products.
Changing How Mimikatz Dumps Credentials Reduces Prevention From 94% to 3%
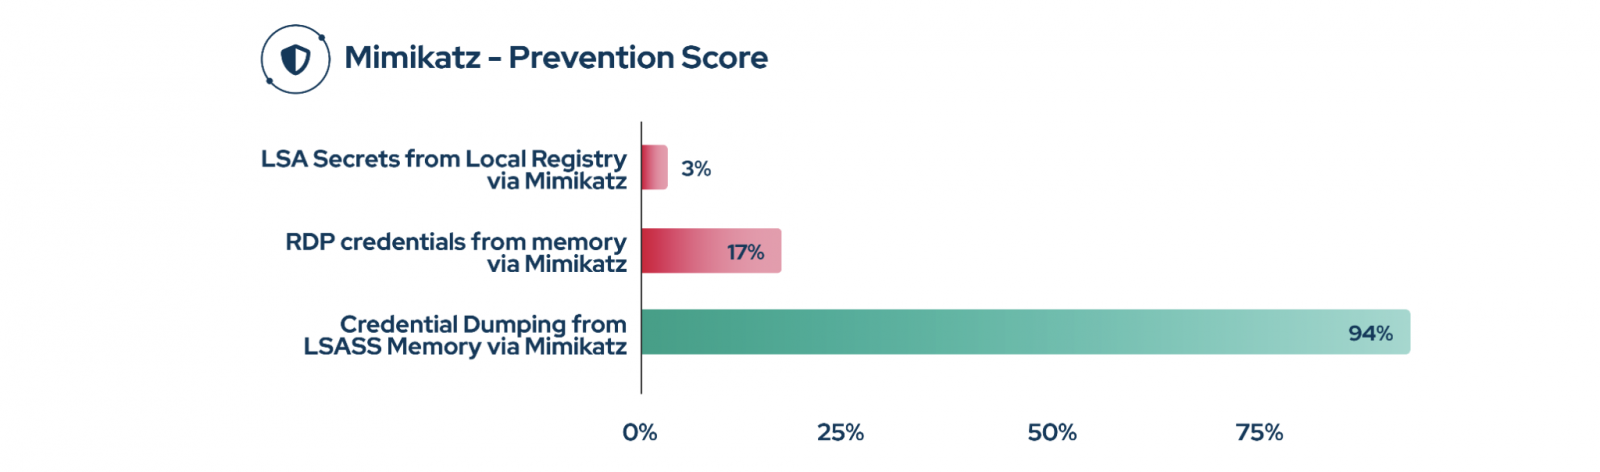
Using Picus autonomous penetration testing, researchers tested the same tool, Mimikatz, in three different ways to achieve the same objective. The prevention results varied dramatically.
-
Dumping credentials from LSASS process memory, the traditional method, was blocked in 94% of attempts.
-
Using the same tool to retrieve RDP credentials from another memory location was blocked in only 17% of attempts.
-
Reading LSA secrets from the local registry was blocked in just 3% of attempts.
All three methods are related to the MITRE ATT&CK technique OS Credential Dumping (T1003). In each case, the attacker’s objective is the same: obtain valuable credentials.
The only meaningful difference was the route used to reach those credentials.
The reason for this gap becomes clearer when examining the underlying behavior.
LSASS credential dumping is a well-known and highly monitored activity. The process opens a handle to lsass.exe and reads its memory, creating events that security vendors have tracked for years.
Reading LSA secrets from the registry is different. It can run as SYSTEM and access registry hives in a way that may resemble legitimate privileged activity. A control designed to detect LSASS access may not trigger when the same credentials are obtained through the registry.
Even the 94% prevention result may be less robust than it appears. The test used a recognizable build of an open-source tool, meaning detection may have been based on how the tool was compiled rather than on the credential-dumping behavior itself.
-
Renaming or recompiling signature-related strings changes the file hash and other identifying markers.
-
Reflective loading can prevent the code from being written to disk, reducing the chance of file-based detection.
-
Attackers can use legitimate Microsoft-signed utilities, such as ProcDump or comsvcs.dll, to create a memory dump and analyze it offline.
The result is the same in every case: the attacker obtains credentials. The behavior and objective remain consistent, while the signature changes.
Post-Breach Prevention Falls to 37%
Credential dumping is only one example of a broader problem inside the network. The overall prevention score of 69% reflects how well security controls stop attacks across the full environment, including perimeter defenses.
Using autonomous penetration testing, Picus measured what an attacker could accomplish after gaining access as an authenticated user. Across these post-breach attack simulations, only 37% of actions were blocked.
In other words, perimeter controls stopped approximately two out of every three attacks. After an attacker gained access, prevention dropped to roughly one in three actions.
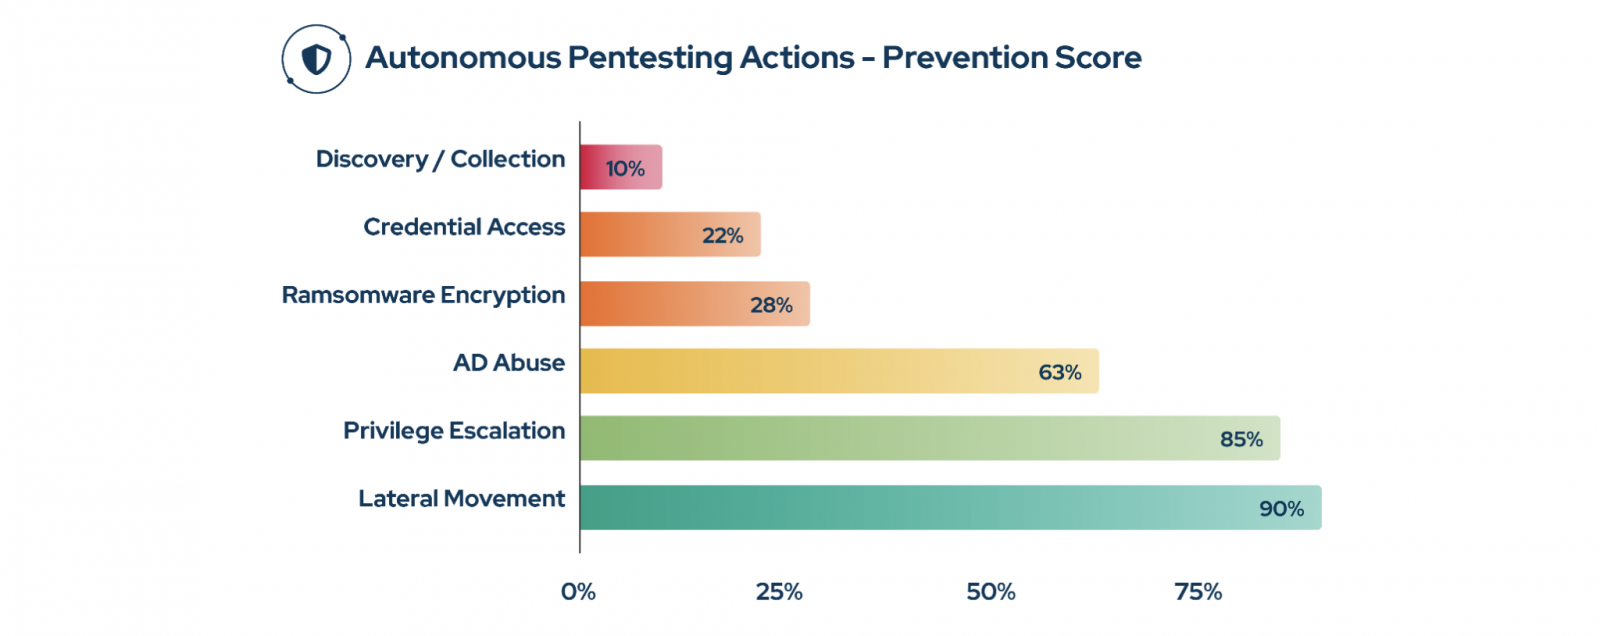
Highly visible actions were detected more often. Lateral movement was detected approximately 90% of the time, UAC bypass activity approximately 85% of the time, and credential reuse and Active Directory abuse approximately 63% of the time.
However, detection and prevention rates declined sharply for quieter techniques.
Credential access through passive memory and registry methods was blocked only 22% of the time. Local registry secret extraction was blocked in less than 1% of tests. Discovery and collection activity achieved a prevention rate of just 10%, with tools such as SharpHound able to enumerate domains and collect local files with little resistance.
These results show how attackers can progress toward their objectives without triggering a recognizable indicator.
How to Close the Gap Between Prevention and Detection
Organizations should use both IOC-based and TTP-based security validation and interpret the results separately.
Known-failure testing provides a baseline for perimeter controls. Firewalls, web proxies, web application firewalls, and secure email gateways should be tested with known malicious samples and download attempts. These tests show whether perimeter defenses are working, but they do not reveal how systems behave after an attacker gains access.
Behavioral validation is essential for endpoint and detection layers. EDR, IDS, SIEM, and related technologies should be tested against every route an attacker could use to obtain credentials. This includes LSASS memory access, registry secrets, alternate memory locations, native operating system tools, and recompiled or modified attack tools.
Testing only the best-known attack steps can create a dangerous false sense of security. A control may successfully detect one implementation while missing several other methods that produce the same outcome.
Manual testing does not scale across complex environments. An orchestration layer can execute multiple behavioral variations of an attack across an organization and validate each variation against deployed security controls.
Security coverage should be proven by behavior, not by a single recognizable step.
The good news is that closing these gaps does not necessarily require adding more security products. Organizations first need to understand which existing controls can break the attack chain. Each exposure can then become a documented decision to patch, mitigate, monitor, accept with evidence, or address through additional defensive measures.

Read the Full Blue Report 2026
The findings above represent only one part of the Blue Report 2026. Picus Labs’ fourth annual study examines how enterprise prevention and detection controls perform in production environments rather than in laboratory tests.
The full report includes:
-
Cybersecurity prevention and detection scores by industry and region.
-
The most exploited vulnerabilities and why many were blocked in fewer than 25% of tests.
-
Prevention results for leading threat groups and ransomware.
-
Detection weaknesses, including a log score below 58% and an alert rate of only 14%.
Download Blue Report 2026 to see how your industry compares and where to focus your security validation efforts first.
Sponsored and written by Picus Security.
Source: www.bleepingcomputer.com