


Mouse models and experimental housing
All animal studies conducted at the University of California, Los Angeles (UCLA), followed the US National Institutes of Health (NIH) Guide for the Care and Use of Laboratory Animals and were approved by the UCLA Chancellor’s Animal Research Committee (ARC protocols 2009-043, 2020-002, 2017-039 and 2022-016). Mice were housed with unrestricted access to food and water under a 12-h light–dark cycle at 20–22 °C and 40–60% humidity. Animals were 2–5 months old, healthy, had no obvious behavioural abnormalities, had not participated in previous studies and were euthanized during the light cycle. Wild-type C57BL/6N mice were obtained from an in-house colony, The Jackson Laboratory (JAX) or Taconic Biosciences. Approximately equal numbers of male and female mice were used, and no sex-related differences were observed.
RiboTag mice (B6N.129-Rpl22tm1.1Psam/J, JAX stock 011029) were crossed with Aldh1l1cre/ERT2 BAC mice (B6N.FVB-Tg(Aldh1l1-Cre/ERT2)1Khakh/J, JAX stock 029655) that had been backcrossed to a C57BL/6NTac background. GCaMP6f mice (Ai95D, C57BL/6J, JAX stock 028865) were also crossed with Aldh1l1cre/ERT2 BAC mice. Ponesimod behavioural studies were performed at ONO Pharmaceutical under Institutional Animal Care and Use Committee approval.
Arl13bf/f;Aldh1l1cre/ERT2 mice were group housed at the University of Calgary, with four to five same-sex mice per cage, under a 12-h light–dark cycle at 21 °C and with unrestricted access to water and standard chow. These studies were approved by the University of Calgary Health Sciences Animal Care Committee and conducted in accordance with Canadian Council of Animal Care guidelines. Arl13bf/f and Ift88f/f mice72,73 were provided by J. Guo and maintained at UCLA. Experimental groups were assigned randomly. Blinding was not always possible because of study design and resource limitations; however, automated software was used whenever feasible to reduce subjectivity during behavioural testing.
Ethics statement for human brain tissue
Human postmortem brain samples were obtained from the Harvard Brain Tissue Resource Center, part of the NIH NeuroBioBank. Procedures were approved by the Mass General Brigham Institutional Review Board and followed institutional policies, NIH regulations and the Health Insurance Portability and Accountability Act. Written consent for brain donation was obtained from the legal next-of-kin or an authorized representative. All samples were de-identified before distribution.
Tamoxifen injections for inducible astrocyte gene expression
To induce astrocyte-specific RPL22–HA expression, hemizygous Aldh1l1cre/ERT2;RiboTag mice74,75 received tamoxifen (75 mg kg–1; Sigma-Aldrich, T5648) in corn oil once daily for 5 days at 6–8 weeks of age. Mice were euthanized 2–3 weeks later for astrocyte RNA sequencing. Arl13bf/f;Aldh1l1cre/ERT2 mice received tamoxifen at 200 μg per mouse per day on postnatal days 7–9 and were euthanized 4 weeks later for RNA-seq analysis.
Chronic restraint stress (CRS)
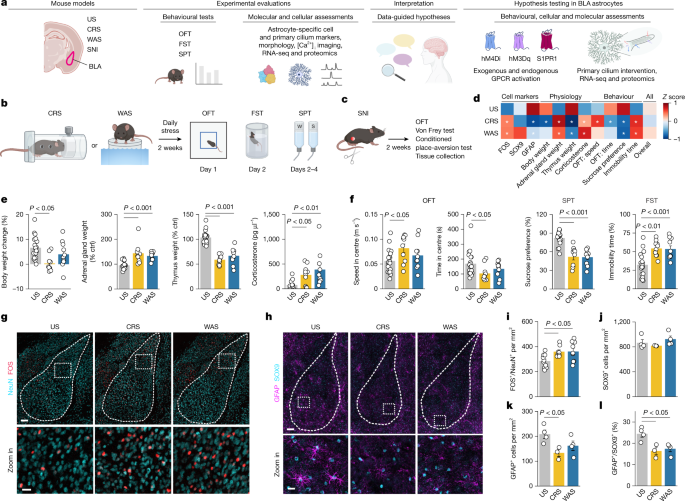
Mice were weighed and placed in restrainers measuring 2.5 cm in diameter × 9.5 cm (551-BSRR, Plas-Labs) for 6 h daily, from 10:00 to 16:00, over 14 consecutive days. Unstressed control (US) mice remained in their home cages. Light intensity was maintained at approximately 50 lux, and all mice were returned to their home cages after each stress session.
Water-avoidance stress (WAS)
Mice were weighed and placed on a platform measuring 5 cm in diameter × 10 cm, positioned in a plastic tank measuring 45 cm × 25 cm × 25 cm, for 2 h daily from 10:00 to 12:00 over 14 days. The tank contained water at 25 °C up to 1 cm below the platform surface. US mice remained in their home cages. Light intensity was approximately 50 lux, and mice were returned to their home cages after each session.
Spared nerve injury (SNI) model
Surgical procedures were performed under continuous isoflurane anaesthesia, with induction at 5% and maintenance at 1–2% (v/v). Anaesthesia depth was monitored throughout. Before surgery, mice received subcutaneous buprenorphine (0.1 mg kg–1; Buprenex). The incision area was cleaned three times with 10% povidone iodine and 70% ethanol. The sciatic nerve was exposed, and the common peroneal and tibial branches were tightly ligated with 6-0 silk sutures and transected distally; the sural nerve was left intact. Muscles and skin were closed with 4-0 silk sutures. Sham-operated mice underwent nerve exposure without ligation or transection.
After surgery, mice recovered overnight in cages partially positioned on a low-voltage heating pad. Buprenorphine was administered twice daily for up to 2 days. Physiological and behavioural testing—including open-field tests (OFTs), conditioned thermal place-aversion tests and von Frey testing—was performed 2 weeks after SNI. As expected76, SNI produced mechanical and thermal allodynia and hyperalgesia in the sural nerve territory.
Open-field test (OFT)
The open-field apparatus was a 40 cm × 40 cm square arena enclosed by 30-cm-high plastic walls. The centre zone was defined as the area within 10 cm of the walls. Illumination in the centre was maintained at 50 lux. Mouse activity was recorded for 15 min with an overhead camera. Centre-zone time, entries, speed and total distance travelled were quantified using ANY-maze software (v.6.3, Stoelting).
Sucrose preference test (SPT)
Mice were individually housed and acclimated to two water bottles. On the second day, they received one bottle of water and one containing 1% sucrose. On the third day, mice were fasted and given pre-weighed bottles containing water or 1% sucrose for 16 h, from 18:00 to 10:00. Bottles were re-weighed after testing. Sucrose preference was calculated as: (1% sucrose intake/(water intake + 1% sucrose intake)) × 100. Mice were euthanized after the SPT.
Forced swim test (FST)
Mice were placed in a cylinder measuring 12 cm in diameter × 30 cm in height and filled with water to a depth of 20 cm. Swimming behaviour was recorded for 6 min under 50 lux illumination, and the total duration of immobility was measured.
Von Frey mechanical pain test
Mechanical pain thresholds were assessed 21 days after SNI using von Frey filaments with forces of 0.04, 0.07, 0.16, 0.4, 0.6, 1 and 2 g. Mice were placed individually on a wire-mesh floor and acclimated for up to 1 h. Filaments were applied vertically to the plantar surface of the SNI-treated hind paw. Paw withdrawal or flicking was scored as a positive response, and thresholds were calculated using the established up–down method77.
Conditioned-place temperature-aversion test
Temperature aversion was assessed using a two-plate apparatus (33 cm × 16.5 cm × 30 cm; Thermal Place Preference-2, BIO-T2CT, Bioseb) enclosed with Plexiglass. During acclimation, both plates were set to 25 °C and mice explored the apparatus for 10 min. For two conditioning trials, the test plate was set to 19 °C while the reference plate remained at 25 °C; visual cues were placed outside the test side. Trials lasted 10 min and were separated by approximately 3 h.
On the second day, both plates were set to 25 °C and the visual cues remained in place. Mice explored the apparatus for 10 min while activity was recorded by an overhead camera. Time spent on each plate was analysed with Bioseb software. Place preference was calculated as: (time on test plate/(time on test plate + time on reference plate)) × 100.
Blood and tissue collection
Following isoflurane anaesthesia and euthanasia, 0.5 ml blood was collected from the abdominal vena cava into heparinized 1.5 ml tubes. Both adrenal glands and the thymus were removed and weighed. Blood was centrifuged at 1,500g for 15 min to obtain plasma. Corticosterone concentrations were measured using an ELISA kit (Enzo, ADI-900-097) according to the manufacturer’s instructions.
Ponesimod treatment
Ponesimod (30 mg kg–1) or vehicle (0.25% (w/v) methylcellulose containing 0.05% (v/v) Tween 80) was administered intraperitoneally once daily, 1 h before CRS. On behavioural-test days, a single dose was administered 1 h before testing. Blood and brain tissue were collected after testing for corticosterone measurement and immunohistochemistry (IHC), respectively. US and CRS mice received the same ponesimod dose, whereas vehicle controls received vehicle alone. Calcium-imaging experiments used a single ponesimod or vehicle injection.
The FDA approval package for ponesimod (application 213498; www.accessdata.fda.gov/drugsatfda_docs/nda/2021/213498Orig1s000TOC.html) reports more than 50% inhibition of binding to endothelin ETA receptors, MAO-B and Ca2+/calmodulin-dependent protein kinase II (approximately 74%, 62% and 63%, respectively). These effects are likely limited at clinically relevant concentrations because the reported inhibition constant for S1PR1 is approximately 1,750-fold lower than the screening concentration (5.7 nM versus 10 μM). Nevertheless, potential off-target activity should be considered in future studies of S1PR1 and other GPCRs.
LPS-induced neuroinflammation
Neuroinflammation was induced by intraperitoneal injection of LPS (5 mg kg–1) as previously described78. After 24 h, reduced ambulation in the OFT confirmed the behavioural effect of neuroinflammation, after which mice were euthanized for tissue collection.
Stereotaxic AAV microinjections
Stereotaxic surgery was performed under continuous isoflurane anaesthesia, with induction at 5% and maintenance at 1–2% (v/v). Mice were secured in a stereotaxic frame and received subcutaneous buprenorphine (0.1 mg kg–1) before surgery. The incision site was disinfected three times with 10% povidone iodine and 70% ethanol. Two 2–3 mm craniotomies were made with a high-speed drill while saline was applied to prevent heating. Bilateral injections were guided by a stereotaxic apparatus and bevelled glass pipettes. BLA coordinates were 1.45 mm posterior to bregma, 3.20 mm lateral to the midline and 3.75 mm below the pial surface.
AAVs were delivered with a syringe pump. Pipettes remained in place for at least 10 min before slow withdrawal, and wounds were closed with 4-0 silk sutures. Mice recovered overnight on a low-voltage heating pad and received buprenorphine twice daily for up to 2 days. Experiments began at least 2 weeks after injection. Viral titres were adjusted to 1.0 × 10¹³ genome copies per ml in sterile 0.1 M PBS. Viruses included 0.15 μl AAV2/5 GfaABC1D-tdTomato (Addgene, 44332), GfaABC1D-hM4Di–mCherry (92286), GfaABC1D-hM3Dq–mCherry (92284), GfaABC1D-cyto–GCaMP6f (52925), GfaABC1D-LCK–GFP (105598), GfaABC1D-LCK–BioID2-BioID2–HA (176741), GfaABC1D-eGFP (176861) and GfaABC1D-Cre-4x6T (196410).
Immunohistochemistry (IHC)
For transcardial perfusion, mice were euthanized with isoflurane and perfused with 0.1 M PBS followed by 10% buffered formalin (Fisher, SF100-20). Brains were post-fixed overnight at 4 °C and cryoprotected in 30% sucrose in 0.1 M PBS for at least 48 h. Serial 40 μm coronal sections containing the amygdala were cut at −20 °C and processed for IHC.
Sections were washed in PBS and blocked for 1.5 h at room temperature in 10% normal goat serum, 0.5% Triton-X100 and 0.1 M PBS. Primary antibodies were applied overnight at 4 °C with agitation. Antibodies included guinea pig anti-NeuN, rabbit anti-FOS, chicken anti-mCherry, chicken anti-GFAP, rabbit or guinea pig anti-S100β, rabbit anti-HA, rabbit anti-septin 2, rabbit or rat anti-ARL13B, rabbit anti-S1PR1, rabbit anti-AC3, rabbit anti-SOX9, goat anti-collagen IV and biotinylated WFA. For collagen IV staining, sections were pre-treated with pepsin before antibody incubation.
After washing, sections were incubated for 1 h with Alexa Fluor-conjugated secondary antibodies or streptavidin Alexa Fluor 647. Sections were mounted in ProLong Glass Antifade and imaged with an Olympus FV3000 confocal microscope using ×4, ×10, ×40 and ×60 objectives. Laser settings were held constant within each experiment. Images were acquired as maximum-intensity projections with 0.5–1.0 μm z-steps and processed using ImageJ (v.1.53u–1.54p). Non-ciliary ARL13B background was occasionally thresholded in figure images to improve visualization of primary cilia; no thresholding was applied to images showing ARL13B rat or AC3 staining or to other IHC images.
Three-dimensional IHC reconstructions were generated in Imaris. Image stacks were segmented using the Surpass mode, with a 0.3–0.4 μm surface grain size and background-subtraction thresholds based on the largest sphere diameter of 1–1.6 μm. Manual thresholds were selected to preserve the appearance of the stained cilium and render it as a single volume. Astrocyte soma surfaces were reconstructed using absolute-intensity thresholding. Imaris MeasurementPro was used to extract volume measurements.
RNAscope analysis of mouse and human tissue
Fixed-frozen mouse tissue was sectioned coronally at 20 μm and mounted on glass slides. Dual ISH–IHC was performed with Multiplex RNAscope v.2 and the integrated co-detection workflow (ACDBio, 323180 and 323110). Sections were baked, washed, heat-treated, dehydrated and incubated with anti-S100β antibodies before protease treatment. Probes targeted mouse Arl6, a custom mouse Arl3 probe or mouse S1PR1. Signal amplification was performed with AMP 1-FL, AMP 2-FL and AMP 3-FL, followed by Opal 520 and Opal 570 development. Sections were counterstained and imaged by confocal microscopy using 1 μm z-steps. Astrocyte somata were identified by S100β staining, and RNA puncta were quantified per soma.
For human amygdala tissue, an RNAscope Multiplex Fluorescent Reagent kit v.2 was used with an astrocyte-specific C1 probe for ALDH1L1 and an S1PR1 C2 probe. Fresh-frozen amygdala sections (18 μm) from four neurotypical individuals (two male and two female) were fixed in 4% paraformaldehyde, dehydrated and treated with hydrogen peroxide and protease IV. Signals were developed with TSA Vivid Fluorophores 570 and 650. Slides were counterstained with DAPI, treated with TrueBlack to reduce lipofuscin autofluorescence and mounted with ProLong Gold Antifade. Four ×20 z-stack images were acquired from the basolateral amygdala per sample. A total of 632 ALDH1L1-positive nuclei were counted manually in Fiji, and results were reported as the percentage of S1PR1-positive astrocytes per case.
Astrocyte calcium imaging in acute brain slices
Mice were anaesthetized with isoflurane, decapitated and brains were rapidly placed in ice-cold modified artificial cerebrospinal fluid (aCSF) containing sucrose, NaCl, KCl, MgCl2, NaHCO3, NaH2PO4 and d-glucose, continuously bubbled with 95% O2 and 5% CO2. Coronal or sagittal sections 300 μm thick were cut with a vibratome and equilibrated for 30 min at 33 °C in normal aCSF. Slices were then maintained at 21–23 °C and used within 6 h.
Astrocytes were imaged at room temperature using an Olympus Fluoview 1000 confocal microscope with a ×40 water-immersion objective. GCaMP fluorescence was excited with a 488 nm laser, and images were acquired at 1 frame s–1. GPCR agonists were dissolved in water, whereas DCZ and ponesimod were dissolved in DMSO and diluted into aCSF immediately before use. Image series were analysed in ImageJ, with xy drift corrected and z-drifted cells excluded. Fluorescence traces were converted to ΔF/F values using regions of interest identified with GECIquant. Calcium events were defined as signals at least threefold above baseline noise and quantified with custom R scripts using findpeaks, AUC and tidyverse functions.
Astrocyte RNA extraction from Aldh1l1cre/ERT2;RiboTag mice
Astrocyte-enriched RNA was extracted from Aldh1l1cre/ERT2;RiboTag mice as previously described75. Amygdala tissue from 16 mice aged 2–3 months (eight males and eight females) was collected, with four mice pooled per sample. A portion of cleared lysate was used as an input fraction, and the remaining lysate was incubated with mouse anti-HA antibody and magnetic beads overnight at 4 °C to immunoprecipitate ribosome-associated astrocyte RNA. RNA was purified with a Qiagen kit (74034), and concentration and quality were assessed using an Agilent 2100 Bioanalyzer.
Astrocyte RNA sequencing and bioinformatic analysis
RNA samples with an RNA integrity number above 7.8 were used for multiplexed library preparation with TruSeq Stranded Total RNA with Ribo-Zero Gold. MACS and Ift88f/f bulk samples were prepared with SMART-Seq mRNA and NexteraXT. Samples from each experiment were pooled to minimize batch effects. Sequencing was performed on NovaSeq 6000 or NovaSeq X Plus instruments, generating at least 80 million reads per sample. Reads were demultiplexed with Illumina Bcl2fastq2, aligned to the mouse mm10 genome with STAR and uniquely mapped at a rate of 75 ± 16%.
Previously published datasets from 13 CNS regions58 were combined with the amygdala dataset using RUVr batch correction. Differentially expressed genes (DEGs) were identified with limma-voom and an adjusted P value below 0.05. Astrocyte-enriched genes were defined by log2[IP/input] > 1, adjusted P < 0.05 and IP FPKM > 1. Region-specific genes were identified by comparing amygdala IP samples with the mean of IP samples from the other 13 regions. Gene Ontology pathway analysis was performed with Enrichr. RUVr was also used to remove unwanted variation from US, CRS and WAS datasets. Cortical astrocyte S1pr1 expression for Fig. 6 was calculated by averaging SCX, MCX and VCX expression values58.
Cilium-related gene analysis
A 770-gene cilium-related list was generated by combining genes associated with the Gene Ontology terms ‘cilium’ (GO:0005929), ‘cilium assembly’ (GO:0060271), ‘cilium organization’ (GO:0044782) and ‘axoneme’ (GO:0005930). The list overlapped by 60% with the Syscilia Gold Standard SCGv1 and by 42% with the broader CiliaCarta cilia-related gene list. The complete gene set is provided in Source Data Fig. 4.
In vivo BioID2 protein labelling and pull-down
Three weeks after AAV delivery of BioID2 or GFP control vectors, mice received subcutaneous biotin (24 mg kg–1; Millipore Sigma, RES1052B-B7) once daily for 7 days. Mice were used 16 h after the final injection. For each purification, amygdala tissue from eight mice was pooled, using equal numbers of males and females.
Tissue was homogenized in lysis buffer containing EDTA, NaCl, HEPES and protease inhibitors, followed by addition of a detergent-based lysis buffer. Samples were sonicated, centrifuged and ultracentrifuged before SDS treatment and heating. Pyruvate carboxylase-conjugated agarose beads were used for pre-clearing, followed by overnight incubation with streptavidin magnetic beads. Beads were washed sequentially with SDS, detergent/LiCl buffer, NaCl and ammonium bicarbonate. Biotinylated proteins were eluted with biotin, Rapigest SF and ammonium bicarbonate at 60 °C for at least 2 h.
Mass spectrometry analysis of biotinylated proteins
Immunoprecipitation eluates were reduced with tris(2-carboxyethyl)phosphine, alkylated with iodoacetamide and cleaned using the SP3 protocol. Proteins were digested overnight with Lys-C and trypsin, followed by SP3 peptide clean-up and LC–MS/MS analysis. Peptides were separated by reversed-phase chromatography and analysed using Bruker timsTOF HT diaPASEF or Thermo Fisher Astral data-independent acquisition workflows.
ARL13B–BioID experiments used cortex rather than amygdala because the large number of mice required for proteomics made amygdala collection impractical. Cortex was selected because astrocytes in this region contain ARL13B-positive primary cilia and cortical and amygdala astrocytes show molecular similarity.
Data were searched with DIA-NN (v.1.8.1) against a UniProt mouse-protein database. Statistical analysis used limma (v.3.60). Proteins were classified as hits when log2[BioID2/GFP] > 1 and adjusted P < 0.05. Gene Ontology analysis was performed with Enrichr. Published evidence was used to assess the likely primary-cilium localization of TULP3, ARL3, IFT74, TOGARAM1, MAP4, SNAP29, RAB34, EHD1, DLG1, EZR, INPP5E and IFT43.
Molecular cloning and PHP.eB AAV production
ARL13B–BioID2 and GFP plasmids were generated by digesting Astro-BioID2 (Addgene, 176740) or Astro-GFP (Addgene, 176861) at the XhoI site. ARL13B cDNA was amplified from Addgene plasmid 23288095 and inserted using In-Fusion cloning (Takara Bio). Plasmids were packaged into PHP.eB AAVs in-house according to a published method96.
Retro-orbital delivery of PHP.eB AAVs
Eight-week-old mice received 1012 genome copies per mouse of AAV-PHP.eB-GfaABC1D-ARL13B-BioID2-HA or AAV-PHP.eB-GfaABC1D-ARL13B-GFP by retro-orbital injection to achieve brain-wide astrocyte expression97. Biotin was administered as described above. The entire cortex was dissected for streptavidin pull-down of biotinylated proteins. Plasmids are available through Addgene under identifiers 253927 and 253928.
CilioGenics probability scoring
CilioGenics data were downloaded from https://ciliogenics.com/?page=Home98. Proteins were classified according to their CilioGenics scores as high probability (1), medium probability (1–0.5) or low probability (<0.5).
MACS-based astrocyte isolation and quantitative PCR
Amygdala tissue from three to four adult mice was pooled for each sample and dissociated with papain at 37 °C under continuous 95% O2/5% CO2. Tissue was centrifuged, resuspended in cold PBS, filtered through a 70 μm strainer and treated with Debris Removal solution. Cells were incubated with FcR-blocking beads and ACSA-2 beads, washed in BSA–EDTA and passed through an MS column on a MACS magnet. RNA was extracted with a Qiagen kit, and cDNA was synthesized with SuperScript IV.
qPCR primers for Aldh1l1, Rbfox3 and Aif1 were previously described100. Additional primers targeted Slc1a3, Mbp and Ppia. Expression was calculated from Ct values normalized to the housekeeping gene Ppia and reported as the ratio between astrocyte-enriched and input fractions.
Human amygdala astrocyte single-nucleus RNA sequencing
Frozen amygdala samples from 120 brain donors were obtained from the Harvard Brain Tissue Resource Center. Groups of 20 specimens, including donors with PSDs and unaffected controls, were processed together. Nuclei extraction, gel-bead emulsion generation and library preparation followed the 10x Chromium Single Nuclei 3′ v3.1 protocol. Reads were aligned to hg38 using Drop-seq (v.2.5.4), and CellBender was used to remove ambient RNA. Dropulation assigned nuclei to donors using transcribed single-nucleotide polymorphisms, while scPred models were used for cell-type classification.
Astrocyte counts from each donor were pseudo-bulked after excluding nuclei with fewer than 200 detected genes. Donors with fewer than 30 astrocytes were excluded, leaving 109 donors: 71 with PSDs and 38 unaffected controls. The mean age was 65.07 ± 17.21 years, and 53 donors were women. Differential expression was analysed with edgeR using quasi-likelihood negative-binomial regression. TMM normalization, expression filtering and Benjamini–Hochberg correction were applied. Age, sex and collection batch were included as covariates. The present analysis focuses on primary-cilium-related genes in amygdala astrocytes; a subsequent study will report results for all amygdala cell types.
Statistical analysis and data presentation
Each experiment included at least three replicates. Sample sizes were informed by previous studies using comparable models. Unless otherwise stated, statistical tests were performed in OriginPro 2024. Bar graphs show means with s.e.m. error bars and individual data points. Sample sizes, statistical comparisons and significance levels are reported in the figure panels. The value of n represents the number of cells or mice, as specified for each experiment.
Data normality was assessed in OriginPro 2024. Parametric or nonparametric tests were selected accordingly. Analyses included unpaired two-tailed Student’s t-tests, two-tailed Mann–Whitney tests and one-way or two-way ANOVA. Comparisons involving three or more groups used one-way ANOVA with Tukey’s post-hoc test or Kruskal–Wallis ANOVA with Dunn’s test. Statistical significance was defined as P < 0.05; values above 0.05 were reported as not significant, while values below 0.01 and 0.001 were reported as <0.01 and <0.001, respectively. Transcriptomic and proteomic analyses used an adjusted P < 0.05 unless otherwise stated. No data points were excluded. Source Data files contain the values used to generate the figures, and all statistical results are provided in Supplementary Table 1.
Reporting summary
Additional details about the experimental design are available in the Nature Portfolio Reporting Summary linked to this article.
Source: www.nature.com