


Mice and Animal Housing Conditions
All mice were group-housed, and all experiments followed procedures approved by the Institutional Animal Care and Use Committees at Massachusetts General Hospital and Tufts University School of Medicine, as well as NIH animal-care guidelines. Mice were maintained in a 12-h light–dark cycle (7:00–19:00) at 22–24 °C and 30–50% humidity, with unrestricted access to food and water. Cntnap2−/−, Pvalbcre, Amigo2cre and Rpl22HA mouse lines were obtained from Jackson Laboratory (strains 017482, 017320, 030215 and 011029, respectively).
AAV Viruses and Genetic Constructs
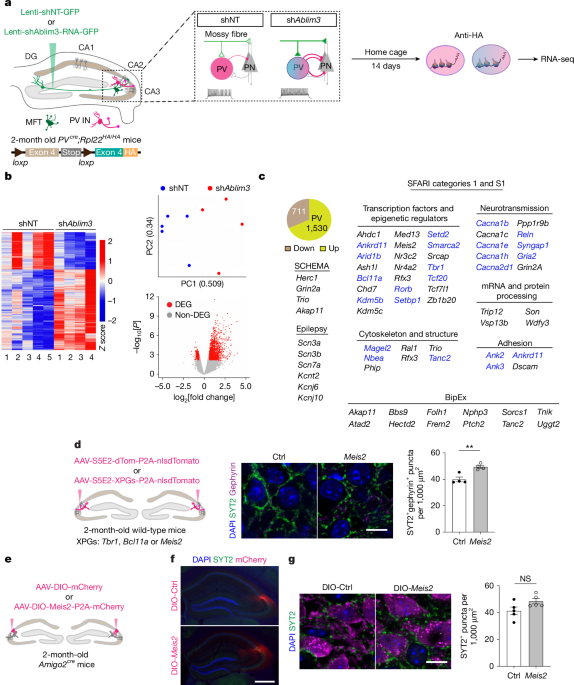
AAV-S5E2-dTom-nlsdTom plasmid (plasmid 135630), AAV5-CamKIIa-hChR2(H134R)-eYFP (26969), AAV-S5E2-ChR2-mCherry (135634) and AAV PHP.eB virus were purchased from Addgene. AAV-S5E2-XPGs-nlsdTom viruses were produced by subcloning mouse Meis2 (NM_001346036.1), Bcl11a (NM_016707.3), Tbr1 (NM_009322.3) or dSACas9/VP64 into the AAV-S5E2-dTom-nlsdTom plasmid. AAV-U6-sagRNA#1#2-Syn1-P2A-mCherry and AAV-Herc1gRNA#1-CAGGAAAAAGCCTGGTCTTCA-#2-AAAACAAATTCATGTGTATGT-Syn1-P2A-mCherry constructs were generated by VectorBuilder. AAV-EF1a-DIO-mCherry was obtained from UNC, while AAV-EF1a-DIO-Meis2-mCherry was generated by VectorBuilder. Cal-Light plasmids, including pAAV-pCMV-Myc-TM-KA2-CaM-NES-TEV-N-AsLOV2-TEVseq-tTA, pAAV-hSYN-M13-TEV-C-P2A-tdTomato and pAAV-TRE-eGFP, were provided by the Hyun Laboratory. AAV.PHP.eB viruses were produced by the Boston Children’s Hospital Viral Core. Because the constructs differ, S5E2-dTom-P2A-nlsdTom controls produce dTomato throughout the neuron, whereas S5E2-Meis2-P2A-nlsdTom produces nuclear-localized dTomato.
Immunohistochemistry Protocol
Mice received viral injections 2 weeks before perfusion. Animals were anaesthetized with intraperitoneal ketamine and xylazine (10 mg ml–1 and 1.6 mg ml–1, respectively), transcardially perfused with 4% paraformaldehyde (PFA), and their brains were removed and post-fixed overnight at 4 °C. Brains were then incubated in 30% sucrose–PBS for 2 days, embedded in OCT medium (Fisher HealthCare), and sectioned at 35 μm using a Leica cryostat. Sections were stored in PBS containing 0.01% sodium azide at 4 °C. For immunostaining, free-floating sections were permeabilized and blocked for 2 h in PBS containing 0.3% Triton X-100 and 10% normal donkey serum. Sections were incubated overnight at 4 °C with primary antibodies diluted in PBS containing 10% normal donkey serum and 0.1% Triton X-100. After three 10-min PBS washes, sections were incubated with secondary antibodies for 2 h at room temperature, washed three additional times, mounted on glass slides and coverslipped using DAPI Fluoromount-G (SouthernBiotech).
Confocal Image Acquisition and Image Analysis
For parvalbumin (PV) and synaptotagmin-2 (SYT2) puncta analysis, images were collected from three hippocampal sections per mouse by investigators blinded to treatment and genotype. High-resolution images of the stratum lucidum were acquired using a Leica SP8 confocal microscope and LAS software at 2,048 × 2,048 pixels. Single-plane images of the CA2 and CA3ab subfields were captured with a ×63 oil-immersion objective and ×43 digital zoom. Puncta density was averaged from 18 images per mouse in CA3 and 12 images per mouse in CA2. PV+ and SYT2+ puncta were quantified using the StarDist 2D plugin and particle-analysis tools in Fiji ImageJ. Threshold settings were kept constant across all images. Cal-Light-labelled dCA3a cells were counted manually. To minimize background fluorescence, GFP images were thresholded using Yen entropy maximization62.
Primary and Fluorescent Secondary Antibodies
The study used the following primary antibodies: PV (rabbit, Swant PV25, 1:5,000, RRID: AB_10000344; goat, Swant PVG213, 1:1,000, RRID: AB_2721207); RGS14 (mouse, NeuroMab 75-170, 1:500, RRID: AB_2179931; rabbit, Proteintech 16258-1-AP, 1:500, RRID: AB_2179918); SYT2 (mouse, Abcam AB154035-1001, 1:250, RRID: AB_2916272); RFP (rabbit, Rockland 600-401-370, 1:1,000, RRID: AB_2209751; goat, Sicgen AB1140-100, 1:500, RRID: AB_2877097); FOS (guinea pig, Synaptic Systems 226-004, 1:3,000, RRID: AB_2619946); GFP (chicken, Invitrogen A10262, 1:500, RRID: AB_2534023); gephyrin (rabbit, Synaptic Systems 147-008, 1:500, RRID: AB_2619834); MEIS2 (rabbit, Proteintech 11550-1-AP, 1:400, RRID: AB_2143028); BCL11A (mouse, Abcam ab19487, 1:500, RRID: AB_444947); TBR1 (rabbit, Abcam ab31940, 1:200, RRID: AB_2200219); GFAP (chicken, Millipore AB5541, 1:2,000, RRID: AB_177521); IBA1 (rabbit, FujiFilm 019-19741, 1:500, RRID: AB_839504); and SST (mouse, Santa Cruz G-10, 1:500, RRID: AB_831726). Jackson ImmunoResearch fluorescent secondary antibodies were used at 1:500: Alexa-Fluor-488 donkey anti-rabbit IgG (711-545-152); Cy3 donkey anti-rabbit IgG (711-165-152); Alexa-Fluor-488 donkey anti-mouse IgG (715-545-151); Cy3 donkey anti-mouse IgG (715-165-151); Alexa-Fluor-488 donkey anti-chicken IgG (703-545-155); Cy3 donkey anti-goat IgG (705-165-147); Alexa-Fluor-647 donkey anti-guinea pig IgG (706-605-1481); and Cy3 donkey anti-guinea-pig IgG (706-165-148).
RNAscope RNA In Situ Hybridization and Immunofluorescence
RNAscope in situ hybridization was performed using the RNAscope Multiplex Fluorescent Reagent Kit v.2 (323100, Advanced Cell Diagnostics). Mice were perfused with PBS followed by 4% PFA. Ten-micrometre brain sections were mounted and dried at –20 °C for 2 h, washed in PBS, dehydrated through 50%, 70% and 100% ethanol, and air-dried. Sections were treated with RNAscope hydrogen peroxide for 10 min at room temperature, followed by RNAscope 1× Target Retrieval Reagent for 10 min at 95 °C. After washing with double-distilled water and 100% ethanol, sections were dried and treated with RNAscope Protease III for 30 min at 40 °C. Probes targeting Rgs14 (MmRgs14, 416651), Pvalb (Mm-Pvalb-C2, 421931-C3) and Meis2 (Mm-Meis2-C3, 436371-C3) were applied for 2 h at 40 °C. Signal amplification was performed using AMP1, AMP2 and AMP3, followed by channel-specific HRP and TSA fluorophores (Opal 520, 570 and 690; Akoya Biosciences). Images were collected with a Leica SP8 confocal microscope. All Pvalb+ cells were outlined, and Meis2 fluorescence intensity was quantified.
RNA Sequencing of Hippocampal Tissue
Tissue Collection and RNA Extraction
Hippocampal CA2/CA3 tissue was collected 2 weeks after injection of lentivirus expressing shAblim3 or shNT into the dentate gyrus (DG) of 2-month-old PVcre;Rpl22HAf/f mice. Brain tissue from six male and female mice was pooled for each sample and snap-frozen. Ribosome-associated RNAs were isolated by immunoprecipitation with anti-HA magnetic beads (Pierce, 88836) for 3 h at 4 °C30,63, followed by elution using the RNeasy Plus Micro Kit (Qiagen). RNA was stored at –80 °C. RNA integrity was assessed with an Agilent TapeStation, and concentrations were measured using a Qubit 4.0 Fluorometer (Life Technologies). Only samples with an RNA integrity number above 8.0 were used for sequencing-library preparation.
RNA-Seq Library Preparation, Illumina Sequencing and Bioinformatics
Total-RNA sequencing libraries were prepared with the Clontech SMARTer v.4 kit (Takara) and sequenced on an Illumina HiSeq 2500 platform, generating 20–30 million 50-bp reads per sample. STAR aligner64 mapped reads to the mouse mm9 (GRCm37) reference transcriptome. Gene-level read counts were generated with the unstranded HTSeq count function (v.0.6.0)65. EdgeR66 was used to estimate expression levels and identify differentially expressed transcripts. Genes with at least 1 count per million reads in one or more samples67 were retained. Differentially expressed genes were defined as those showing a minimum 1.5-fold change and FDR < 0.05.
Reverse Transcription Quantitative PCR
Hippocampal DG and CA2/CA3 regions were collected and snap-frozen68. cDNA was generated from RNA isolated from PVcre;Rpl22HA/HA mice injected into the DG with shNT or shAblim3. RNA concentration was measured with a NanoDrop spectrophotometer, and equal RNA quantities were reverse transcribed using the SuperScript IV First-Strand Synthesis System (Invitrogen). RT–qPCR was performed with SYBR Green chemistry (Bio-Rad) and PrimerBank primers69. The primer sequences were: Ablim3-F 5′-GGTCCGTGTCCACAACAAC-3′; Ablim3-R 5′-GTCCCGGCAGCTATCACAG-3′; Bok-F 5′-CCACAGACAAGGAGCTGGT-3′; Bok-R 5′-TAGCCAAGGTCTTGCGTACA-3′; Dsp-F 5′-CGGACATTCATGCGAGATAC-3′; Dsp-R 5′-GCCTTGAACTGGGAACACTC-3′; Bcl11a-F 5′-TGGTATCCCTTCAGGACTAGGT-3′; Bcl11a-R 5′-TCCAAGTGATGTCTCGGTGGT-3′; Meis2-F 5′-CAGGGTGGTCCAATGGGAATG-3′; Meis2-R 5′-GGGGGTCCATGTCTTAACTGAG-3′; Tbr1-F 5′-CAAGGGAGCATCAAACAACA-3′; Tbr1-R 5′-GTCCTCTGTGCCATCCTCAT-3′; Herc1-F 5′-GAAGATGTGGATGCAGCAGA-3′; Herc1-R 5′-GGTCTGTCCGGTGAAGGATA-3′; Gapdh-F 5′-GCTTGTCATCAACGGGAAG-3′; and Gapdh-R 5′-TTGTCATATTTCTCGTGGTTCA-3′. Primers for MEIS2 target genes were: Cdh2-F 5′-AGCGCAGTCTTACCGAAGG-3′; Cdh2-R 5′-TCGCTGCTTTCATACTGAACTTT-3′; Chd7-F 5′-GGAGAACCCTGAGTTTGCTAGCGCAGTCTTACCGAAGG-3′; Chd7-R 5′-CCCTGAAGTAGAGGCGACAG-3′; Kirrel3-F 5′-TCGGAGAATGAATGAAGGTCAAG-3′; Kirrel3-R 5′-GATGGCACACAGCAGAGTCA-3′; Reln-F 5′-CTGTGTCATACGCCAAGAACA-3′; Reln-R 5′-GGGGAGGTACAGGATGTGGAT-3′; Syt2-F 5′-AGAACCTGGGCAAATTGCAGT-3′; Syt2-R 5′-CCTAACTCCTGGTATGGCACC-3′; Tanc1-F 5′-CGAGCGCCACACACATAAC-3′; Tanc1-R 5′-AGGCAGTGCTGCTTGTGAG-3′; Kcnab1-F 5′-TTCCGCACTGTCGCTATCATC-3′; Kcnab1-R 5′-AGCATGAAACTCTGAGTCCTGA-3′; Pvalb-F 5′-CATTGAGGAGGATGAGCTG-3′; and Pvalb-R 5′-AGTGGAGAATTCTTCAACCC-3′.
Gene Set Enrichment Analysis
Gene set enrichment analysis was conducted using software developed through a joint project between UC San Diego and the Broad Institute (https://www.gsea-msigdb.org/gsea/index.jsp). Analyses used default settings and an FDR threshold of < 0.05. Mouse MSigDB v.2024.1.Mm was used to evaluate pathway and Gene Ontology enrichment70,71.
Stereotactic AAV Injection and Optical Fibre Implantation
Mice received preoperative carprofen (5 mg kg–1, subcutaneously) and were anaesthetized with ketamine and xylazine (10 mg ml–1 and 1.6 mg ml–1, intraperitoneally) or 1.75% isoflurane. Animals were secured in a stereotaxic frame, and burr holes were drilled at the injection sites. Hamilton microsyringes or Nanoject digital microinjectors were lowered into position and left in place for 8 min before infusion. Virus was delivered at 50 nl min–1. Coordinates relative to bregma were: dorsal DG, –1.8 mm AP, ±1.35 mm ML and –2.25 mm DV; dorsal CA2/CA3, –1.8 mm AP, ±2.45 mm ML and –2.35 mm DV. Recombinant AAVs were injected at a titre of 1 × 10¹³, with 100 nl delivered per site. Syringes remained in place for 10 min after infusion before being withdrawn, and incisions were closed with coated Vicryl sutures.
For Cal-Light tagging experiments45, viruses were mixed at a 1:1:1 ratio and injected in a total volume of 300 nl. One week later, mice received AAV-S5E2 control or AAV-S5E2-Meis2 and underwent optical-fibre implantation above CA2/3. Animals recovered for 2 weeks before behavioural testing. Virus-injection coordinates were –1.80 mm AP, ±2.28 mm ML and –2.20 mm DV; optical-fibre coordinates were –1.80 mm AP, 2.28 mm ML and –1.80 mm DV. Following surgery, mice recovered in a clean cage on a heating pad set to 36 °C. Animals received daily carprofen injections (5 mg kg–1, intraperitoneally) for 3 days9.
Tetrode Electrode Implantation
Two weeks after viral injection, mice underwent a second surgery for tetrode implantation. Under 1.75% isoflurane anaesthesia, three skull screws and a custom 16-channel twisted-wire electrode assembly were implanted. Each tetrode consisted of four twisted 75-µm nichrome wires (California Fine Wire), cut at an angle spanning 0.5 mm. Electrodes were positioned in the dorsal hippocampus as follows: DG, –1.8 mm AP, +1.35 mm ML and –2.25 mm DV; CA1, –1.8 mm AP, +1.35 mm ML and –2.18 mm DV; CA3, –1.8 mm AP, +2.45 mm ML and –2.35 mm DV; and CA2, –1.8 mm AP, +2.45 mm ML and –2.31 mm DV. Electrodes were connected to Mill-Max pins and secured to the skull with dental cement. The recording electrode and electrode-bundle connectors were anchored with C&B Metabond (Parkel) and TEETs Denture Material (Cooralite Dental Mfg).
In Vivo Electrophysiological Recording
Implanted mice were connected to an RHD 32-channel headstage (C3314, Intan Technologies) through a custom Omnetics-to-Mill-Max adaptor. Behaviour was recorded with a monochromatic Flea3 USB3 camera at 30 frames s–1. Electrophysiological signals were sampled at 30 kHz using Open Ephys and an ultrathin SPI cable. Video and electrophysiological recordings were synchronized using TTL pulses and camera-frame strobes. Ten-week-old mice explored their home cage for 2 h before social interaction, interacted with a novel sex-matched juvenile mouse for 5 min, and were then recorded for an additional 2 h. Movement was tracked without markers using DeepLabCut72. Snout velocity below 1.5 cm s–1 was classified as immobility.
Detection of NREM Sleep Periods
Local-field potential (LFP) processing and ripple detection were performed with a custom Python script. CA1 LFP recordings were converted to microvolts and downsampled to 1,000 Hz. NREM sleep was identified using a spectrogram calculated with a 10-s window and 1-s step across 0–300 Hz. The first principal component of z-transformed spectral power and theta dominance (5–10 Hz power divided by 2–16 Hz power) were extracted. NREM periods were defined as intervals in which PC1 exceeded the 75th percentile for at least 5 s and theta dominance was low73.
Hippocampal Sharp-Wave Ripple Analysis
Ripple events were detected during NREM epochs using downsampled CA1 LFP recordings. Signals were bandpass-filtered from 100–250 Hz with a third-order Butterworth filter and z-scored. The ripple-band signal was rectified and filtered again from 1–20 Hz to calculate its power envelope74,75. Events were identified when the envelope exceeded 2 Z, reached a peak above 5 Z, lasted 20–150 ms and were merged when the interval between events was under 20 ms76,77. Events were rejected when the DG-channel envelope simultaneously exceeded the high threshold, indicating an artefact.
For each valid ripple, start and end times, peak-power time and peak-LFP time were recorded. Ripple duration was measured in milliseconds. Peak power represented the maximum normalized deviation of the envelope from baseline, using the median and median absolute deviation. Peak LFP amplitude was the maximum absolute amplitude within the event boundaries. Time–frequency representations were generated from raw LFP recordings surrounding each event using a continuous complex Morlet wavelet transform in PyWavelets78. Power from 100–250 Hz was displayed on a decibel scale.
Mouse Behavioural Testing Procedures
Two weeks after viral injection, mice were handled for 3 days to habituate them to handling, transport and the behavioural testing environment. Tests were performed in this order: open field (OF, day 1), visual-cue habituation (day 2), novel object location (NOL) followed by novel object recognition (NOR, day 3), and social recognition and discrimination (day 4). All tests used 40 × 40 cm chambers (MazeEngineers). Videos were recorded with Freezeframe (Actimetrics) and analysed using EthoVision XT 15 (Noldus). Centre-point tracking measured locomotion, while nose-point tracking quantified object and social interactions. An interaction was scored when the test mouse’s nose was within 1 cm of the object or stimulus mouse9.
Behavioural Protocol for PV Interneurons, SYT2 and Synaptic Puncta
Mice were handled for 7 days to habituate them to handling, transport and the testing context. On day 8, animals were exposed for 10 min either to the context alone or to the context containing one stimulus mouse inside a pencil cup. Mice were returned to their home cages and perfused 90 min later.
Behavioural Protocol for Meis2 Expression and MEIS2 Intensity
Mice were handled for 3 days before testing and habituated to the context for 1 h. On day 4, mice were exposed for 10 min either to the context alone or to a stimulus mouse enclosed in a pencil cup. Animals were returned to their home cages and perfused 10 min later.
Open-Field Test
Mice were transported to a holding room and habituated for 1 h before testing. Total distance travelled and time spent in the centre of the open-field arena were measured over 30 min9.
Novel Object Location and Novel Object Recognition
Two identical objects measuring 2 × 4 × 6 cm were placed 5 cm from one wall of the open-field chamber. Mice explored the objects for 5 min before returning to their home cages for 2 h. One object was then moved to the opposite side, and mice explored the rearranged configuration for 5 min. After a 10-min home-cage interval, one object was replaced with a novel object measuring 4 × 4 × 6 cm. Mice explored the objects for a further 5 min. Object investigation was quantified when the nose point was within 2 cm9.
Social Recognition and Social Discrimination Test
Strain-, age- and sex-matched stimulus mice were habituated to a pencil-wire cup in the open-field chamber for 3 days before testing, for 15 min per day. The task included three trials separated by 5-min intervals: habituation with two empty cups, recognition with one empty cup and one stimulus mouse, and discrimination with a novel and a familiar mouse. Test mice were placed in the centre of the chamber for 10 min. Stimulus locations were counterbalanced, and social investigation was measured when the test mouse’s nose was within 1 cm of the stimulus mouse9.
Cal-Light Tagging of Socially Active Neurons
Social Behaviour and Cal-Light Neuronal Tagging
Before behavioural testing, mice were housed in holding cages for at least 1 h, using the same cage each day. Animals completed a 3-day habituation protocol in an open-field chamber containing two empty cups. On the final 2 days, mice were connected to lightless fibre-optic cables. One day later, a novel stimulus mouse was placed beneath one cup for a 10-min session. When the subject approached within 5 cm, blue light was delivered through the fibre-optic cables to activate Cal-Light tagging. Four hours later, mice returned for a second 10-min session with a familiar mouse beneath the same cup and were perfused 90 min later. For social-versus-contextual comparisons, the first session contained no stimulus mouse. For light-versus-no-light comparisons, animals completed one 10-min novel-social session with or without blue-light stimulation and were perfused 5.5 h later.
Optical Fibre Construction and Laser Stimulation
Optical fibres were constructed from 200-μm-core, 0.37 numerical-aperture multimode fibre (Thorlabs) inserted into 230-μm-core zirconia ferrules 701 (Precision Fiber Products). Fibres were glued, polished and connected to the laser cable. Cal-Light activation used a 100-mW, 475-nm blue laser diode (OEM Laser Systems). When the subject entered the predefined zone, light was delivered at 1 kHz and 5–7 mW using an external arbitrary waveform generator (Agilent).
Ex Vivo Hippocampal Electrophysiology
Mice were 2–3 months old at viral transduction. After 2–3 weeks, animals were anaesthetized with ketamine and xylazine and transcardially perfused with ice-cold, choline chloride-based ACSF containing (mM): 92 choline chloride, 2.5 KCl, 1.25 NaH2PO4, 30 NaHCO3, 20 HEPES, 25 glucose and 10 MgSO4·7H2O. Brains were rapidly removed, and 300-μm coronal dorsal-hippocampal slices were prepared with a Leica VT1000 vibratome. Slices recovered in 33 °C normal ACSF for 30 min and then cooled to 20–22 °C for 1 h. Normal ACSF contained (mM): 124 NaCl, 2.5 KCl, 1.25 NaH2PO4, 24 NaHCO3, 5 HEPES, 12.5 glucose, 2 MgSO4·7H2O and 2 CaCl2·2H2O. Solutions were adjusted to pH 7.4 and 305 mOsm and continuously oxygenated with 95% O2/5% CO2.
Whole-cell recordings were amplified, low-pass filtered at 1.8 kHz with a four-pole Bessel filter and digitized using a Multiclamp 700B and Digidata 1550B system (Molecular Devices). Slices were perfused continuously with normal ACSF at more than 2 ml min–1. Neurons were identified using infrared differential interference contrast microscopy and epifluorescence. CA2 and CA3ab pyramidal neurons were distinguished by anatomical position and electrophysiological characteristics. Patch pipettes had 4–5 MΩ resistance and contained (mM): 120 CsMeS, 4 MgCl2, 1 EGTA, 10 HEPES, 5 QX-314, 0.4 Na3GTP, 4 MgATP, 10 phosphocreatine and 2.6 biocytin, adjusted to pH 7.3 and 290 mOsm. For current-clamp recordings, CsMeS and QX-314 were replaced with 130 mM potassium gluconate. After formation of a GΩ seal, cells were voltage-clamped at –70 mV. Input resistance, resting membrane potential and capacitance were measured. Recordings were excluded when series resistance exceeded 30 MΩ or changed by more than 20%.
Optically evoked EPSCs and IPSCs were elicited with 1-ms, 473-nm light pulses above the dentate-gyrus hilar mossy-fibre pathway. Responses were recorded at 1.5 times threshold, with EPSCs isolated at –70 mV and IPSCs at 0 mV. Ten-pulse trains were delivered five times with 20-s intervals and 100-ms inter-pulse intervals.
Electrically evoked EPSCs and IPSCs were produced with 0.2-ms stimulation from a bipolar tungsten electrode placed either on the DG mossy-fibre pathway or in the stratum oriens between CA2 and CA3a to activate Schaffer collaterals. DCG-IV (1 µM), TTX (1 µM) and 4AP (100 µM) were used for pharmacological pathway validation.
Long-term potentiation of EPSCs and long-term depression of IPSCs were induced using theta-burst stimulation (TBS), consisting of four pulses at 100 Hz, repeated four times with 200-ms inter-burst intervals and 10-s intervals between trains. Stimulation was set to 1.5 times EPSC threshold. Recordings included a 10-min baseline, TBS and 40 min of post-stimulation recording. Synaptic plasticity was calculated as the percentage change between the final 5 min of baseline and the final 5 min of recording.
Intrinsic membrane properties were assessed in current clamp. Action potentials were evoked with ascending 10-pA current steps lasting 500 ms at a holding potential of –70 mV. Neurons showing asynchronous rapid firing within the first 50 ms followed by firing failure were classified as bursting cells and excluded. In selected experiments, excitatory synaptic transmission was blocked with CNQX (10 µM) and d-AP5 (50 µM).
Spontaneous EPSCs and IPSCs were recorded at –70 mV and 0 mV, respectively. CNQX prevented inward events during EPSC recordings, while gabazine (10 µM) eliminated events during IPSC recordings. Miniature EPSCs and IPSCs were recorded after TTX application (1 µM). Events were detected using a minimum threshold of root mean square 2 × 1.5. Data were acquired with Clampex and analysed with Clampfit v.11 (Molecular Devices) and EasyElectrophysiology v.2.8.0.
Electrocorticography Implantation Surgery
All ECoG surgeries and experiments followed Tufts University Institutional Animal Care and Use Committee guidelines. Six- to seven-month-old Cntnap2−/− and Cntnap2+/+ mice that had previously received CA2/CA3 AAV injections were anaesthetized with isoflurane (3% induction, 1.5% maintenance; 2 l min–1 oxygen). Mice received buprenorphine (0.1 mg kg–1, subcutaneously) and local bupivacaine (4 mg kg–1, subcutaneously). Four 0.7-mm burr holes were drilled without penetrating the dura. Coordinates were: anterior holes, –0.6 mm AP and 2 mm left or right of the midline; posterior holes, –2.6 mm AP and 2.5 mm left or right of the midline. Four 0.25-cm stainless-steel screw electrodes with silver wires (8403, Pinnacle Technologies) were secured with dental cement and superglue and soldered to a headmount (8402, Pinnacle Technologies). Mice recovered for at least 7 days before chronic ECoG recording and received buprenorphine as needed for 3 days after surgery.
Chronic ECoG Recording and Seizure Analysis
After recovery, a 100× preamplifier with a 1-Hz high-pass filter (8213, Pinnacle Technologies) was connected to the implanted headmount and a commutator. Mice were housed in round acrylic recording chambers with access to food and water on a standard light–dark cycle. ECoG signals were recorded continuously at 1 kHz using LabChart Pro (AD Instruments) for at least 14 days. Recordings were filtered at 100 Hz and manually reviewed by an experienced investigator blinded to genotype. Seizure duration and occurrence time were documented for all identified events.
SLEAP-Based Social Behaviour Tracking
Mice were pair-housed for more than 2 weeks before recording. On the recording day, the cage lid was removed and the cage was placed overnight inside a recording chamber with food and water. Behaviour was recorded continuously for 8 h under infrared illumination. A 1-h segment beginning 1 h after chamber placement was selected for analysis. SLEAP44 was used to estimate the poses of freely behaving mice. A multi-instance, bottom-up U-Net model was trained using 2,751 labelled instances from 917 frames and validated with 306 instances from 102 frames. Six body parts were labelled: nose, right ear, left ear, head, body centre and tail base. The average distance between predicted and ground-truth nodes was 4.3 pixels. Videos were recorded at 23.97 fps, and training used a batch size of 6 with 360° rotation augmentation.
Identity tracking was performed using a flow tracker with centroid similarity and Hungarian matching across a four-frame window. Identity switches were manually reviewed and corrected. Data were analysed with a Python script adapted from SLEAP analysis examples (https://sleap.ai/notebooks/Analysis_examples.html). Missing nodes were linearly interpolated, and trajectories were smoothed using a Savitzky–Golay filter. Nose-to-nose, nose-to-centre and nose-to-rear distances were calculated. Social interactions were defined using thresholds of 61, 100 and 70 pixels, respectively. These thresholds were validated against manually scored recordings.
Sex as a Biological Variable
Both male and female mice were included in most experiments, with efforts made to balance sex across experimental groups. However, sex ratios were not identical in every group, and some sample sizes may have been insufficient to support adequately powered sex-based statistical comparisons.
Statistics, Experimental Rigour and Reproducibility
Researchers were blinded to treatment conditions during data collection, scoring and analysis. Animals were assigned to groups according to genotype. Representative images and traces were selected from at least three independent biological replicates. Statistical analyses were performed in Prism v.10 (GraphPad). Minimum sample sizes were based on previous experimental experience, published literature and power analyses. Statistical significance was defined as P < 0.05, and exact P values are reported where possible. Nonparametric tests were used when data did not satisfy parametric assumptions. Grubbs’ or ROUT tests identified outliers using α or Q = 0.05 (Fig. 4k). Complete statistical information is provided in Supplementary Table 3.
Reporting Summary
Additional information about the research design, experimental procedures and reporting standards is available in the Nature Portfolio Reporting Summary linked to this article.
Source: www.nature.com