


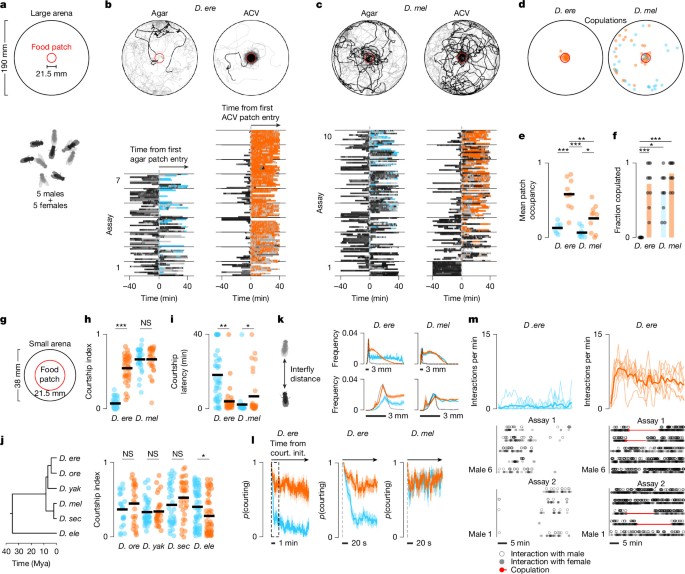
Researchers studied social, reproductive and sensory behaviours in several Drosophila species using controlled housing, behavioural arenas, virtual-reality systems, optogenetics and two-photon imaging. The experiments compared wild-type and genetically modified flies, including lines affecting olfactory receptors and neural populations involved in courtship and visual tracking. Behaviour was recorded and analysed under defined temperature, humidity, lighting, food, odour and visual-stimulus conditions.
Fly stocks and husbandry
Flies were housed at 25 °C and 50–65% relative humidity on a 12 h light/12 h dark cycle. Animals used in optogenetic experiments were reared in darkness. Stocks for behavioural experiments were maintained on standard molasses food. Lines used for two-photon imaging were reared on Würzburg food for at least five generations to improve robustness. Flies expressing optogenetic actuators were kept on sugar-yeast food to prevent exposure to retinal, the cofactor required for channelrhodopsin function.
Drosophila melanogaster stocks 71G01-Gal4 (39599) and UAS-GCaMP6s (42746) were obtained from the Bloomington Stock Center. Canton-S was provided by G. Maimon, Rockefeller University; CO4n and RG11n by J. Pool, University of Wisconsin–Madison; UAS-CsChrimson by V. Jayaraman, Janelia Research Campus; and VT029314 (LC10a)-LexA, LexAop-GCaMP6s by I. Ribeiro and B. Dickson, Janelia Research Campus.
Wild-type D. erecta (14021-0224.01), w− D. erecta (14021-0224.07) and D. yakuba (14021-0261.00) were obtained from the Cornell Stock Center. Ruta laboratory stocks of D. simulans, D. orena provided by D. Stern of Janelia Research Campus, D. erecta 71G01-Gal4, UAS-GCaMP6s, UAS-CsChrimson, ppk23-mutant flies, and D. erecta and D. yakuba Dsx-Gal4 lines were generated previously36 or shared by the indicated colleagues.
D. erecta VT029314 (LC10a)-Gal4, Fru-Gal4, Orco-Gal4, ΔOrco and ΔIr8a lines were generated in this study. The Orco-Gal4 line was used for labelling as shown in Extended Data Fig. 10. The 71G01-Gal4 driver labels approximately 1,052 of the 78 highly interconnected P1 neurons described in D. melanogaster34, with a similar number of neurons labelled in D. erecta36.
Transgene generation
The vector backbone pRC12B36, containing an ie1.mCherry minigene reporter, was used to clone a synthesized VT029314 enhancer fragment from an IDT gBlock upstream of Gal4 by Gibson assembly with NEB reagents. The construct was co-injected with hyTsps mRNA into embryos for transposase-mediated genome integration.
Chemosensory coreceptor knockouts were generated using CRISPR–Cas9-mediated homology-directed repair. The first three exons of Orco or the entire coding region of Ir8a were targeted, with insertion of a fluorescent marker cassette. The Orco cassette encoded mCherry under the viral ie1 promoter, whereas the Ir8a cassette encoded RFP under the D. melanogaster 3xP3 promoter.
For the D. erecta Orco-Gal4 line, 5,496 bp upstream of the Orco translation start site were cloned upstream of the Gal4 sequence in the pCaSpeR backbone with a gateway cassette, pCaSpeR-DEST3 (DGRC, 1029; Research Resource Identifier: DGRC_1029).
The Fru-Gal4 line was generated by first creating an attP landing site in the D. erecta fruitless locus. CRISPR–Cas9-mediated cleavage was performed in the intron 5′ of the exon containing the ATG start codon, as previously described53, and homology-directed repair was used to insert the attP sequence. The validated fruattP line was then used for site-specific integration of a splice acceptor-Gal4 element containing an ie1.mCherry transformation marker.
All transgenic D. erecta lines were generated in a wild-type genetic background except Orco-Gal4, which was constructed in a w− background. For experiments, all constructs were crossed into a wild-type (w+) background to exclude possible behavioural effects of the w− mutation.
Immunohistochemistry and microscopy
Adult brains were dissected in Schneider’s medium (Sigma) and immediately transferred to cold 1% paraformaldehyde (Electron Microscopy Sciences) for overnight fixation at 4 °C. Samples were washed three times in PAT3 buffer containing 0.5% bovine serum albumin, 0.5% Triton and phosphate-buffered saline at pH 7.4.
Brains were blocked for 90 min at room temperature in 3% normal goat serum. They were incubated with chicken anti-GFP antibody at 1:1,000 dilution (Abcam, ab13970) and mouse anti-brp antibody at 1:50 dilution (Developmental Studies Hybridoma Bank, nc82) for 3 h at room temperature, followed by overnight incubation at 4 °C. Samples were washed three times in PAT3 buffer and once in phosphate-buffered saline before mounting in Vectashield (Vector Laboratories).
Images were acquired with a Zeiss LSM 880 microscope using a Plan-Apochromat ×20 objective with 0.8 numerical aperture.
Free-behaviour assays
All free-walking behavioural assays were conducted at 25 °C and 50–65% relative humidity between 0 and 3 h after lights came on. Virgin males and females were collected after eclosion and group-housed separately by sex for 4–7 days. Flies were aspirated without anaesthesia, with females loaded before males.
Videos were recorded with FlyCapture 2 (v.2.13.3.61) at 30 or 42 frames per second using backlighting from a white Logan Electric light pad. A Point Grey FLIR Grasshopper camera (GS3-U3-32S4M-C, 3 MP) fitted with an HF12.5SA-1 Fujinon lens was used.
Central food patches were made from 2% agar (w/v) perfumed with 20% apple cider vinegar (ACV, v/v), 2% agar containing 20% P. candelabrum fruit pulp, or a 2% agar-only control.
Large arenas
Experiments used circular, slope-walled Delrin chambers 190 mm in diameter and 3 mm high, with a central 21.5-mm food patch. Five females were transferred into each chamber by mouth aspiration, followed by five males. Groups were recorded for 40 min after the males were loaded; single-individual assays lasted 20 min.
The centroid of each fly was tracked in every frame. Identity swaps were corrected manually with Caltech FlyTracker (v.1.0.5). Positional data were used in MATLAB (v.2023b, MathWorks) to infer trajectories, relative distributions and distances from the central food patch.
A fly was classified as part of a cluster when it was within three fly lengths of at least one other fly. A solitary fly was at least three fly lengths from all other flies in the arena. The timing and position of copulations were scored manually.
Grid arenas
Grid assays used modified 190-mm arenas with a 145-mm central food patch. A lattice of 13 black, fly-sized hemispherical plastic beads, each 3 mm in diameter, was arranged in a regular square array on the patch. The grid contained five equally spaced beads along the horizontal midline, separated by 30 mm along the edge; three equally spaced beads were positioned 30 mm above and below the midline, with one additional bead 30 mm farther above and below, all aligned along the midline.
Assays included either five males or one solitary male and lasted 20 min. In social-foraging assays, one randomly selected bead was replaced with an immobilized, decapitated female. Recording began after the males were aspirated into the arena.
Fly centroids and speeds were tracked frame by frame with AnimalTA (v.3.2.2)55, with manual correction of identity swaps where necessary. Bead positions were extracted for each assay. Distances between males and beads or the female, visits to visual targets, individual trajectories and relative distributions were calculated from positional data in MATLAB.
A visit was defined as spending at least 30 s within three fly lengths, approximately 9 mm, of a bead or the female. The first frame of a visit bout defined the approach time. A bead switch was recorded when a male visited a bead different from the one visited previously. Summary measures included the number of beads visited per male, bead approaches over time, the number of switches between beads, and the fraction of time spent at each bead or with the female. Male unilateral wing extensions, or singing, during approaches to beads or the female were tracked manually with BORIS (v.7.13.9)56.
Small arenas
Small-arena assays used circular, slope-walled Delrin chambers 38 mm in diameter and 3 mm high, with a central 21.5-mm food patch. Videos were recorded in 2 × 2 grids with the same camera setup. Females were aspirated first, followed by males, and recording began after the final fly was loaded. Each assay lasted 40 min.
Strain-variation assays were limited to D. melanogaster because additional D. erecta strains were unavailable. For heterospecific group assays, four pairs of D. simulans females and males were transferred first, followed by one D. erecta female and one male.
For ppk23-knockout assays, a D. melanogaster female target was placed in the arena, followed by a wild-type or D. erecta ppk23-mutant tester male aspirated onto ACV. In single-bead assays, a hemispherical black plastic bead approximately 3 mm in diameter was placed on the central food patch before one fly was introduced. These assays lasted 20 min.
Fly centroids and orientations were tracked with FlyTracker, and identity swaps were corrected manually. MATLAB was used to infer male reproductive behaviour from orientation, heading direction and position relative to visual stimuli and other flies. Measurements included approaches, tracking of other flies, close-range courtship and copulation.
An approach was defined as directed movement of at least 0.8 mm s−1 towards a stationary object, such as another fly or a bead, from a maximum distance of four fly lengths, approximately 12 mm. The male’s orientation had to be within 60° of the line connecting his centroid to the target’s centroid, narrowing to 45° at distances of up to 1.5 fly lengths, or 4.5 mm.
Courtship comprised periods when a male approached or tracked another fly, or was within 1.5 fly lengths of a female with an angle of at least 45° subtending the line between the male’s and female’s centroids. The courtship index was calculated as the fraction of the assay spent courting:
Courtship index = time spent courting / assay length.
If a male copulated, the courtship index represented the fraction of time spent courting before copulation. To quantify the visual experience of males in groups under different chemosensory conditions, the angular position and width of other flies in the focal fly’s visual field were calculated frame by frame in MATLAB, as previously described57.
Free-behaviour visual virtual-reality assays
Visual virtual-reality assays used 38-mm-diameter, 3-mm-high Delrin chambers with slope walls coated in white self-adhesive vinyl paper from Livelynine. The coating increased reflectance and the contrast of projected shapes. Stimuli were projected directly onto the chamber surface with a DLP LightCrafter 4500 mini projector (Texas Instruments).
Tester males were aspirated into the chamber and allowed to acclimate for 5 min before stimulus projection. Recording then continued for 5 min with a Basler acA3088-57uc camera fitted with an 8 mm, f/1.8 lens (Edmund Optics) and pylon Viewer (v.6.3.0). For assays using pairs, the female was aspirated first and the male second; these assays lasted 40 min. Videos were recorded at 30 frames per second.
Except in visual-environment replay assays, the chamber contained either 30 μl of 2% agar (w/v) perfumed with 20% ACV (v/v) or a 2% agar-only control. For visual-environment replay, four equally spaced 30-μl dots were placed in a square at the chamber’s periphery so that the replay was not obstructed.
Constant-angular-velocity stimuli
Males were presented with a 3-mm-diameter dot rotating clockwise at 16 mm s−1 on a 7.5-mm radius, a dot rotating counterclockwise at 32 mm s−1 on a 15.5-mm radius, or both stimuli simultaneously. For mating assays, a female target was added and both visual stimuli were presented after the male was aspirated. Recording lasted 40 min or until copulation.
The positions of the visual stimuli, female and male were tracked with flyTracker. MATLAB was used to infer visual-object tracking from the male’s orientation, heading direction and position. Tracking was defined as directed movement towards a moving object within the orientation criteria used for approaches in the small-arena assays.
The tracking index was calculated as:
Tracking index = time spent tracking / assay length.
Visual-environment replay
Replay videos were generated from manually corrected FlyTracker trajectories recorded from one representative group of five D. erecta males and five females on ACV and one group on agar in a small 38-mm arena. Centroid positions and orientations were used to place a black ellipse at each fly’s position in every frame. Each ellipse had a 3-mm long axis aligned with the fly’s orientation.
A 5-min segment recorded at 30 frames per second was looped to create a 40-min video for each chemosensory condition. For the ACV condition, the selected segment represented a group dominated by courtship, before the accumulation of copulating pairs changed the visual environment to one with more sedentary flies. The agar video was taken from the same time point.
Replay of the agar or ACV visual environment was paired with either agar or ACV-perfumed agar. One female and one male were aspirated into the arena, and recording began with the replay. Male behaviour towards the female was scored manually with BORIS for 40 min or until copulation. Manual scoring was required because low-contrast ellipse projections sometimes obscured the flies and prevented automated detection. Behavioural data were used to calculate the tracking index.
Tethered virtual-reality assays
Tethering and preparation
Males 4–5 days old were briefly anaesthetized with CO2 for less than 30 s and tethered to a custom-milled plastic head plate similar to those used in previous studies38,58. A string across the cervical connective held the flies in place while the eyes and the back of the thorax were fixed to the head plate with UV-curable glue, using Loctite 3106 and Bondic. The string was then removed.
Flies recovered in a warm, humidified chamber at 25 °C and 50–70% humidity in darkness. After 30 min, they were transferred to an air-supported ball 5 mm in diameter for D. erecta or 6.35 mm for D. melanogaster and acclimatized for a further 45 min.
Virtual-reality system
The system was adapted from earlier hardware designs for presenting visual stimuli to tethered males38,59 and was extended to deliver odours with temporal precision. An aluminium base kept a Styrofoam ball afloat on an air stream. A custom 3D-printed holder accommodated either the original 6.35-mm ball used for D. melanogaster or the 5-mm ball used for D. erecta.
A conical screen surrounding the ball retained the original dimensions: approximately 220 mm at its large diameter, 40 mm at its small diameter and 60 mm high. The screen was made from holographic rear-projection film from Megicolim. Visual stimuli were rear-projected with a DLP 3010 Light Control Evaluation Module (Texas Instruments).
A high-contrast circular stimulus approximately 28° in diameter, corresponding to the angular size of a female fly 2 mm from the male, was projected onto the screen. It moved through a symmetric 150° arc at a constant angular velocity of 50° s−1.
Odours were delivered through Teflon tubing as a constant stream of humidified air at a low flow rate of 0.5 l min−1. The stream was directed towards the male’s head from the front at a 45° angle and approximately 2 mm from the fly, without obstructing the screen. The 1-cm-diameter tubing engulfed the entire male in the airflow.
Pure ACV odour was mixed with water vapour to a concentration of 50% using two digital mass-flow controllers. Solenoid valves controlled by a data-acquisition device (MMC 1408 FS) switched the output between pure air and ACV-containing air while maintaining a constant flow rate. The male’s position was tracked on the spherical treadmill with FicTrac (v.2.0), while MATLAB controlled visual stimuli and odour delivery on the same computer.
Experimental timing and anosmic mutants
Each assay lasted 210 s, including a 30-s baseline followed by 180 s of visual stimulation. ACV was delivered for 60 s beginning 90 s after the assay started, giving the male 60 s of visual stimulation before and after odour delivery.
To assess the role of olfaction in ACV-dependent visual tracking by D. erecta males, the researchers generated a transgenic line lacking the chemosensory coreceptors Orco and Ir8a. These coreceptors are part of the principal olfactory pathways previously implicated in detecting ACV volatiles60,61. Double mutants were tethered and tested using the same protocol.
The tracking index was defined as previously described36 to reflect the fidelity and vigour of a male’s pursuit of the visual target.
Optogenetic assays
Optogenetic experiments expressed the light-activated cation channel CsChrimson in olfactory sensory neurons using Orco-Gal4 or in P1 neurons using 71G01-Gal4. Flies were reared on retinal-free sugar-yeast food for 5–6 days, then transferred to food containing 400 μM all-trans-retinal for two days before testing. Control flies were transferred either to a new sugar-yeast food vial or, for genetic controls, to retinal-containing food. Genetic-control males carried CsChrimson without a Gal4 driver.
Optogenetic activation used 625-nm light from Cree Xlamp XP-E2 red LEDs. Three experimental configurations were used.
Free-behaviour optogenetics
Small 38-mm assay chambers with central 21.5-mm food patches made from ACV-perfumed 2% agar or agar alone were backlit with blue light. A decapitated, immobilized female or a 3-mm hemispherical bead was placed at the centre. After a male was aspirated into the chamber, assays lasted 6 min and included two 2-min baseline periods separated by a 2-min period of red light pulsed at 5 Hz with 0.1-s pulses.
For assays involving a decapitated female, red light was delivered from below through the Delrin using nine high-power LEDs. The intensity at the chamber surface was approximately 7 μW mm−2. For bead assays, red light was delivered from above using five high-power LEDs.
FlyTracker was used to track male behaviour. Position, orientation relative to the female and heading direction were used to quantify courtship and calculate the courtship index described above.
Free-behaviour projector optogenetics
Small 38-mm chambers were coated with white adhesive film and illuminated from above with a LightCrafter 4500 mini projector. Only the blue LED channel was used for background illumination; the red and green channels were switched off.
P1 neurons labelled by 71G01-Gal4 were activated with five high-power red LEDs positioned above the chamber. Assays lasted 6 min and included two 2-min baseline periods separated by 2 min of constant red light delivered in addition to the background illumination.
Male behaviour was tracked with flyTracker. Position, orientation relative to the female and heading direction were used to calculate the tracking index. Tracking was defined as directed movement towards a moving object within the approach-orientation criteria used in the small-arena assays:
Tracking index = time spent tracking / assay length.
Population behaviour was summarized as the fraction of males courting across assays over time.
Tethered optogenetics
Males were tethered as described for the virtual-reality experiments. Assays lasted 210 s, beginning with a 30-s baseline followed by 180 s of visual stimulation. A 1.5-mm optic fibre from Edmund Optics was coupled to a 650-nm high-power red LED from LED Engin mounted on an Ohmite heat sink and positioned directly above the fly’s head.
Orco-positive olfactory sensory neurons were activated with 5-Hz light pulses of 0.1 s for 60 s beginning 90 s after the assay started. The tracking index was calculated as described above.
Two-photon functional imaging
Fly preparation
Males were tethered as described above. After recovery, the head plate was filled with saline containing 108 mM NaCl, 5 mM KCl, 2 mM CaCl2, 8.2 mM MgCl2, 4 mM NaHCO3, 1 mM NaH2PO4, 5 mM trehalose, 10 mM sucrose and 5 mM HEPES. The solution was adjusted to pH 7.5 and an osmolarity of 265 mOsm.
Without anaesthesia, a 30-gauge needle was used to cut the cuticle above the antenna and between the eyes. The cuticle was removed with forceps to provide optical access to the central brain, and tracheae covering the brain were also removed. Flies were transferred to the ball and allowed to recover in darkness for 45 min.
Imaging procedure
Imaging was performed with an Ultima two-photon laser-scanning microscope (Bruker Nanosystems) using a Chameleon Ultra II Ti:Sapphire laser. Samples were excited at 920 nm, and emitted fluorescence was detected with a GaAsP photomultiplier tube from Hamamatsu. Images were acquired in Prairie View (v.5.6, Bruker) with a ×40 Olympus water-immersion objective with 0.8 numerical aperture.
To reduce projector-related noise, the red and green LED channels were switched off and blue-light filter paper from Rosco was placed in front of the projector lens. After the male’s resting period on the ball, the objective was lowered over the brain to identify the region of interest. A small region was centred to produce an imaging rate of 4–8 Hz, and laser power was kept low to reduce stress.
Regions of interest were drawn in one hemisphere, depending on the neural population examined. For P1 and LC10a imaging, the region was placed in the LPC and AOTu neuropil, respectively, where axonal projections were densest. For fru and dsx imaging, a larger region encompassing neurites in both the LPC and adjacent AOTu was used to capture neural activity simultaneously.
For moving visual stimuli, experimental timing and tracking-index calculations followed the tethered virtual-reality protocol. For pheromone-tapping experiments, a virgin conspecific female aged 4–8 days was mounted on a micromanipulator and presented in six touch bouts separated by 30 s, allowing neural activity to return to baseline between taps.
Pheromone and ACV responses in Dsx-positive neurons in the LPC were assessed in the same region for each animal. The order of odour and pheromone presentation was randomized.
Imaging analysis
Imaging data were processed and analysed in Fiji (v.2.14.0, NIH). Frames were motion-corrected and aligned along the x and y axes with the Template Matching plugin. Residual projector noise was reduced with the Despeckle function. An ROI covering the entire neural population of interest and its neuropil was drawn to extract average fluorescence.
For each recording, fluorescence was normalized in MATLAB to the mean fluorescence during the first 30 s, used as the baseline F0. The fluorescence change was calculated as:
ΔF/F0 = ( Fi − F0 ) / F0,
where i denotes the current frame. Because imaging was performed at a lower frame rate than behavioural recording, behavioural data were downsampled by linear interpolation at the imaging time points.
For pheromone and ACV imaging of Dsx-positive neurons, ΔF/F values were normalized by matching pheromone responses across species and adjusting odour responses accordingly.
Statistical analysis and reporting
MATLAB was used for statistical analyses and plotting. Normality was assessed with the Shapiro–Wilk method, after which the appropriate parametric or non-parametric statistical test was selected. When multiple comparisons were made, appropriate post hoc tests were conducted as indicated in Supplementary Table 1. All statistical tests were two-tailed.
Further information on the research design is available in the Nature Portfolio Reporting Summary linked to the article.
Source: www.nature.com