


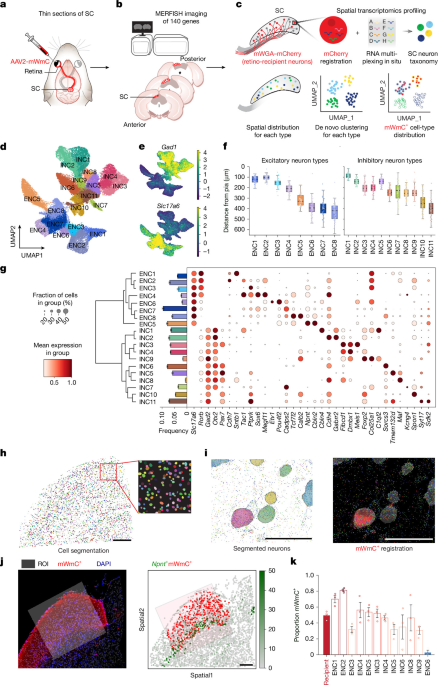
The study used genetically defined mouse lines, viral tracing, electrophysiology, two-photon calcium imaging and spatial transcriptomics to examine how retinal ganglion cells (RGCs) connect with neuronal populations in the mouse superior colliculus (SC). The experiments combined anterograde tracing with TransA-MERFISH, a 140-gene multiplexed RNA imaging panel, to identify retino-recipient SC cell types while preserving anatomical and protein information. Additional experiments tested circuit connectivity, axon depth, visual responses and the effects of ablating starburst amacrine cells.
Animals and genetic tools
All animal procedures were approved by the Institutional Animal Care and Use Committees at the University of California, San Francisco. Mice were maintained on a C57BL/6 background under specific-pathogen-free conditions, on a 12-hour light/12-hour dark cycle, with food and water available without restriction. Immunohistochemistry used postnatal day 30–90 (P30–P90) mice unless otherwise specified. Slice electrophysiology and in vivo calcium imaging were performed in young adults aged P60–P90, and SC MERFISH experiments used P30–P90 mice. Both sexes were included in approximately equal numbers. The researchers observed no sex-specific differences in retinotectal connectivity, electrophysiological recordings or calcium-imaging experiments. Genotypes were determined by PCR from toe biopsies.
The study used Kcng4-cre mice (JAX 029414), which mark all αRGC subtypes; Cartpt-cre mice (JAX 028533), which mark multiple subtypes of ooDSGCs; Foxp2-cre mice (JAX 030541), which mark five Foxp2-RGC subtypes classified as F-RGCs; and Tusc5-cre mice, generated in this study to mark all T5-RGCs. The specific retinal expression pattern of the Tusc5 knock-in line was verified in Extended Data Fig. 6, while a detailed characterization was stated to be in a separate manuscript in preparation by X.D. ChAT-Cre mice (JAX 006410) were used to label and manipulate starburst amacrine cells (SACs) in combination with AAV-mediated perturbations.
New FlpO mouse lines
To access excitatory SC neurons expressing Cdh7, the researchers inserted a FlpO recombinase cassette into exon 1 of the endogenous Cdh7 locus at chr. 1:109909967–110073002 using CRISPR–Cas9-mediated homology-directed repair. The donor construct contained the FlpO coding sequence flanked by 5′ and 3′ homology arms. Founder mice were screened by PCR with internal and external primer pairs, and the targeted locus was confirmed by Sanger sequencing across both insertion junctions. The recombination used sgRNA-Cdh7#1, AAAGATGAAGCTGGGCAAAGTGGAG, and sgRNA-Cdh7#2, TTTTCTACAGCTTATAGCTC. Two germline-transmitting founders were bred to establish the line. One line was validated against endogenous Cdh7 transcripts by RNAscope fluorescent in situ hybridization, as shown in Extended Data Fig. 5.
To access inhibitory SC neurons expressing Cbln4, a FlpO cassette was inserted into exon 1 of the endogenous Cbln4 locus at chr. 2:171878256–171885386 using the same general CRISPR–Cas9 homology-directed repair strategy. Targeting was verified by PCR across both recombination junctions and by Sanger sequencing. The guide used was sgRNA-Cbln4#1, TTGCGCACGCGGGCTCACCATG. Three germline-transmitting founders were bred, and one line was validated against endogenous Cbln4 transcripts by RNAscope, as shown in Extended Data Fig. 5j–q.
Viral vectors and tracing
The investigators used AAV2-CAG-mWGA-mCherry (mWmC; Addgene 263583) to label all RGCs and examine their output in the SC. A Cre-dependent version, AAV2-CAG-DIO-mWGA-mCherry (DIO-mWmC; Addgene 263584), was used to label defined RGC types. Both vectors were produced at Virovek using BAC-to-AAV technology. AAV2-CAG-ChR2-mCherry-WPRE (Addgene 100054) was used for CRACM experiments involving all RGCs, while AAV2-EF1α-DIO-ChR2(H134R)-mCherry (Addgene 20297) was used in Cartpt-cre mice to stimulate ooDSGC inputs.
AAV2-EF1α-FDIO-GFP-WPRE (Addgene 203843) labelled SC neurons in the Cdh7-FlpO and Cbln4-FlpO lines, and AAV8-EF1α-FDIO-GCaMP6s (Addgene 105714) labelled those neurons for in vivo calcium imaging. AAV2-Flex-taCasp3-TEVp (Addgene 45580) was used to selectively ablate retinal SACs in ChAT-Cre mice.
For FlpO-dependent retrograde tracing, the researchers used a modified AAV8-hSyn-FRT-TVA-P2A-EGFP-2A-oG, produced by X.C. EnvA G-deleted rabies-mCherry (Addgene 32636), obtained from the Salk GT3 Core, was then used with TVA-2A-oG to label presynaptic retinal neurons connected to defined SC starter populations. AAV2-CAG-membrane-bound YFP (AAV-CAG-mYFP; Addgene 263585) labelled projection axons, and its Cre-dependent version (AAV-CAG-DIO-mYFP; Addgene 263586) labelled axons from selected RGC populations.
For intraocular injections, approximately 0.5 µl of virus was delivered into the left eye with a sharpened glass micropipette. Serotype 2 AAVs targeting RGCs were standardized to 2 × 10¹³ genome copies. Animals were generally processed about four weeks after injection. Optogenetic experiments were analysed after at least six weeks, when mice were adults aged 6–10 weeks. For SAC ablation, 0.75 µl of AAV2-Flex-taCasp3-TEVp was injected at each of two dorsal and ventral sites in the eye; controls received the same volume of saline in the left eye. Calcium imaging was performed one month after injection.
TransA-MERFISH tissue preparation
The brain-preservation procedure was optimized to retain immunohistochemical staining while maintaining RNA quality. Young adult mice were deeply anaesthetized and perfused through the heart with ice-cold 0.9% NaCl, followed by ice-cold 4% paraformaldehyde (PFA) in 0.1 M phosphate buffer at pH 7.4. Brains were dissected and post-fixed overnight at 4 °C. The SC, approximately 10 mm3, was microdissected with its anteroposterior and dorsoventral orientations marked, cryoprotected in 30% sucrose in PBS for 2–4 hours, embedded in OCT and rapidly frozen in dry-ice-cooled 2-methylbutane. Approximately 12-µm coronal sections were collected under RNase-free conditions on Vizgen MERSCOPE slides.
About 10 sections were collected from the right SC at intervals of nine 12-µm slices, spanning approximately 100 µm along the anterior–posterior axis. The right SC receives contralateral retinal input from the injected left eye. Sections were selected using the Allen Mouse Brain Atlas and covered coordinates from −3.0 to −5.0 mm relative to Bregma. They included the full dorsoventral SC, from the superficial visual layers—the stratum zonale (SZ) and stratum griseum superficiale (SGS)—to the deeper motor-associated stratum griseum profundum (SGP) and stratum album profundum (SAP).
Sections were permeabilized overnight at 4 °C in 70% ethanol and then processed through an ethanol gradient. Protein staining used Vizgen Blocking Buffer C with murine RNase inhibitor, rabbit anti-RFP antibody at 1:100, and the Vizgen Anti-Rabbit Protein Stain Kit. After fixation in 4% PFA, sections were incubated with a custom 140-gene MERSCOPE panel at 37 °C for at least 36 hours and up to 48 hours. Following formamide washes at 47 °C, tissue was embedded in gel, cleared with proteinase K at 47 °C for 24 hours, stained with DAPI and PolyT, and imaged on a Vizgen MERSCOPE1.0 using the MERSCOPE 140 Gene Imaging Kit.
Gene-panel design and image analysis
The 140-gene panel was designed using adult SC single-nucleus RNA-sequencing data. Neuronal cells were reclustered with Seurat, and 19 Leiden clusters representing neuronal compartments were identified. Marker genes were ranked using a combined specificity and fold-change score. The researchers trained an XGBoost classifier using the top one to 10 non-redundant markers per cell type and evaluated performance with a 70:30 training/test split.
Classification accuracy plateaued at 0.8414 when nine markers per type were used, corresponding to 171 genes, and declined slightly to 0.8403 with 10 markers per type, or 190 genes. The MERFISH panel itself reached an accuracy of 0.91. It outperformed two control panels consisting of 140 genes randomly sampled either from the full expression matrix or from the 2,000 most variable genes. Each control-panel analysis was repeated 15 times. Two panel genes, Sgcd and Ppia, were excluded from some analyses because they showed low transcript detection and poor specificity in the TransA-MERFISH SC dataset.
The panel included markers for excitatory, inhibitory and subtype-specific neurons, including Ntng1, Meis1, Cpne4, Cacna2d1, Sgcd, Spon1, Kctd8, Gpc5, Ptprk, Nxph1, Robo1, Hs3st4, Sorcs3, Chrm3, Reln, Trpm3, Meis2, Prkd1, Epha3, Tfap2b, Etv1, Tshz2, Erbb4, Ebf3, Maf, Cdh7, Cbln4, Otx2, Gabrr2, Sox14, Dmbx1, Gad2, Foxp2, Pou4f2, Rorb, Slc17a6, Tac1, Kcng4, Calb1, Calb2, Gad1 and other genes listed in the study.
Each section produced seven 1.7-µm optical planes for DAPI, PolyT and mCherry/RFP channels. The researchers selected the right SC hemisphere, manually delineated regions of interest using processed DAPI images, and transformed transcript coordinates into image coordinates. Cell segmentation combined transcript locations with maximum-intensity DAPI projections. A fine-tuned Cellpose 2.0 model, based on the cyto2 model and trained on five regions containing about 200 manually curated cells each, was used to segment dim cells, small cells and adjacent cells that had initially been merged.
Segmentation tiles were stitched into complete masks, and the resulting cell-by-gene matrices were assembled as AnnData objects. Cells without transcript counts were excluded. Cell positions, mean mCherry intensity, registration metadata and estimated depth from the pial surface were integrated into the same dataset. The final region was further restricted to rectangular areas extending from the pia to the stratum opticum, while avoiding midline and lateral regions. Boundaries were assessed using the spatial expression of Npnt and Etv1.
Identifying retino-recipient SC cells
mWmC-positive cells were identified from mCherry fluorescence. Mean intensity was calculated across z-planes 1–6, excluding z0, and normalized by the number of planes. A local background estimate was obtained from an annulus surrounding each cell. Positive cells were first identified using a threshold derived from a low-fluorescence control region and were then reviewed by two independent annotators using the MERSCOPE Visualizer.
For background correction, the researchers applied rolling-ball subtraction to maximum-intensity projections of the RFP channel, using overlapping 4,096 × 4,096-pixel tiles and an 80-pixel rolling-ball radius. Residual local background from neuropil and axons was removed using concentric annuli around each soma. The local background was defined as the 25th percentile of annular intensities, and corrected intensity was calculated as I′(x,y) = max(I(x,y) − 0.7Bi, 0).
An automated depth-aware sliding-window method identified a control region. An 800-µm window was moved along the pial-to-deep axis in 100-µm increments; windows containing fewer than 15 cells were excluded. The lowest cumulative fluorescence signal defined the centre of the control region, which was expanded until it contained at least 600 cells. After trimming the brightest 2% of cells, the positive threshold was set at μctrl + 5σctrl. The researchers then used one-tailed Fisher’s exact tests and odds ratios to evaluate enrichment of mWmC-positive cells in neuronal subtypes. Positive enrichment was defined as log2(odds ratio) greater than zero.
Clustering and molecular classification
Two low-quality sections with substantially lower transcript counts were excluded. The remaining sections contained 47,740 cells, including 46,277 high-quality neuronal profiles after removal of a non-neuronal cluster. SCTransform normalization, principal-component analysis, neighbourhood graphs, UMAP and Leiden clustering were performed using Scanpy, Squidpy and R-based Seurat functions accessed through rpy2. The initial merged analysis used 15 principal components, 30 neighbours and a Leiden resolution of 0.8. The neuronal subset used 12 principal components and a resolution of 1.5, selected using variance-explained curves and the clustree package.
Clusters were annotated using canonical SC markers, hierarchical clustering, the Allen Institute’s MapMyCells tool and XGBoost classifiers trained against published SC single-cell and single-nucleus RNA-sequencing atlases. The results showed strong correspondence with established SC taxonomies, while in some cases providing finer molecular resolution.
To test whether molecular identity predicted retinal connectivity independently of laminar position, SC neurons were grouped into 50-µm depth bins within each animal. Cell-type labels were shuffled within each animal-by-depth stratum for 1,000 permutations, preserving the sublaminar distribution of mWmC labelling while disrupting cell-type identity. Observed counts were converted to per-animal z-scores and combined across animals using Stouffer’s method. Two-sided P values were calculated from the combined z-scores and corrected with the Benjamini–Hochberg false-discovery-rate procedure.
Histology and connectivity experiments
Retina and brain sections were fixed in 4% PFA, cryoprotected in 30% sucrose and processed for immunohistochemistry or RNAscope. Brain sections were cut coronally at 40 µm, while retinal cryosections were 20 µm thick. Antibodies included markers against GFP, RFP, SATB1, ChAT, CARTPT, TUSC5, RBPMS, SPP1, FOXP2 and ETV1. Secondary antibodies were conjugated to Alexa Fluor 488, 568 or 647.
RNAscope probes targeted Cdh7, Cbln4, Itga7 and Sntb1. Confocal images were collected under identical conditions, and single- and double-positive cells were counted manually in ImageJ. The confocal analysis was performed double-blind: one researcher collected images without knowing genotype, and a second researcher performed the analysis while blinded to the experimental group.
To measure RGC axon distribution, 20-µm confocal stacks were converted to maximum-intensity projections. Each right SC hemisphere was divided into five equal sections, and 200-µm-wide line scans were taken perpendicular to the pial surface to a depth of 500 µm. Fluorescence was normalized to the maximum intensity across images and smoothed using locally weighted scatterplot smoothing in MATLAB. Five mice of each genotype were used for each condition. When multiple neurons were recorded from one mouse, mouse identity was treated as the experimental unit or random effect.
CRACM and electrophysiology
For channelrhodopsin-assisted circuit mapping, Cre and FlpO drivers were combined to label SC neurons and manipulate RGCs independently. A 473-nm light source activated RGC axon terminals in the SC. Mice were perfused with a choline-based cutting solution, and 250-µm coronal SC slices were prepared with a vibratome. Slices were incubated at 32.5 °C and then maintained in artificial cerebrospinal fluid.
Targeted whole-cell recordings were performed from fluorescent SC neurons surrounded by labelled RGC axon terminals. Electrodes had resistances of 3–5 MΩ and contained a potassium-based internal solution. Signals were digitized at 10 kHz and filtered at 1 kHz. Five 2-ms light pulses were delivered in each trial. Tetrodotoxin at 1 µM and 4-aminopyridine at 100 µM were used to confirm monosynaptic connections, while CNQX at 10 µM and APV at 50 µM confirmed glutamatergic transmission. Biocytin, included at 0.5% in some recordings, was visualized with streptavidin after fixation.
Two-photon calcium imaging and visual stimuli
Eight-week-old transgenic mice received a craniotomy and 400 nl of AAV8-EF1α-FDIO-GCaMP6s in the right SC. A transparent silicone plug and a 5-mm coverslip were implanted, followed by a custom head plate. Mice were habituated to handling and head fixation at least four times after recovery.
Imaging was performed at 920 nm with a Neurolabware two-photon microscope and a Spectra-Physics MaiTai laser. The field of view measured 575 × 370 µm, was acquired at 15.5 Hz and contained 416 × 268 pixels. Imaging depths were 50–200 µm below the pia. Visual stimuli were presented on a tangent LCD screen 14 cm from the mouse, angled at 20 degrees in pitch and yaw. Drifting gratings moved in eight directions at 45-degree intervals, with a speed of 22.7° per second. Receptive fields were mapped with flashing 13.8° × 13.8° squares presented at positions in a 9 × 5 array. All stimuli were repeated six times.
Motion correction used NoRMCorre. GCaMP6s-positive cells were identified, calcium traces were extracted and neuropil signals were subtracted. Traces were aligned to stimulus timing through TTL signals. Cells with a direction-selectivity index (DSI) greater than 0.2 were classified as direction selective. DSI was calculated from the normalized vector sum of responses across the eight directions, and preferred direction was defined by the weighted vector sum. To assess the contribution of the ipsilateral eye to Cbln4-positive SC neuron responses, that eye was covered with a black box during imaging.
Behavioural testing and statistics
Optomotor responses were measured with the OptoDrum system (Striatech). Mice were acclimated before being placed on the platform, and drifting gratings moving at 12° per second were presented at spatial frequencies from 0.056 to 0.3–0.5 cycles per degree. Clockwise and counterclockwise motion was used to assess responses mediated by different eyes. The software tracked the head, body and tail and paused testing during grooming or if a mouse left the platform. False positives were manually rejected, and the spatial-frequency threshold was compared between the ablated and control eyes.
Measurements came from distinct biological samples, and no covariates were tested. No formal normality test was performed. Depending on the experiment, the researchers used unpaired two-sided Student’s t-tests, Kolmogorov–Smirnov tests, Fisher’s exact tests, Kruskal–Wallis tests or one-way ANOVA. Optogenetically evoked currents were averaged across five trials. Statistical significance was defined as P < 0.05, with thresholds of P < 0.01, P < 0.001 and P < 0.0001 represented by two, three and four asterisks, respectively. Unless otherwise stated, values are reported as mean ± s.e.m. The mWmC registration workflow was deposited at https://github.com/duanxlab/TransA-MERFISH.
Source: www.nature.com