


Cell Lines, Culture Conditions and Differentiation
HAP1 cells were cultured in Iscove’s modified Dulbecco’s medium (IMDM; Thermo Fisher Scientific) supplemented with 10% heat-inactivated fetal calf serum (FCS; BioSell) and 1% penicillin–streptomycin–glutamine (PSG; Thermo Fisher Scientific). HEK293T (293T), A549, HeLa, U2OS, BJEH and HCT116 cells were maintained in Dulbecco’s modified Eagle’s medium (DMEM; Thermo Fisher Scientific) containing 10% heat-inactivated FCS and 1% PSG. SH-SY5Y cells were cultured in DMEM supplemented with 15% FCS, 1% PSG and 1 mM sodium pyruvate. K562 cells were maintained in Roswell Park Memorial Institute 1640 (RPMI; Thermo Fisher) medium containing 10% heat-inactivated FCS and 1% PSG.
K562 differentiation was induced as previously described52. Briefly, cells were pretreated with 200 nM imatinib (MedChemExpress, HY-15463) in IMDM at 200,000 cells per ml for 24 h. Cells were then treated for 3 days with 1 µM decitabine (MedChemExpress, HY-A0004R) in HEMA medium consisting of IMDM, 20% FCS, 1% PSG, 2% bovine serum albumin (BSA; Sigma-Aldrich, A7030-50G), 0.5 mg ml–1 holo-transferrin (Merck-Sigma, T0665), 2 U ml–1 erythropoietin (MedChemExpress, HY-P7164) and 20 ng ml–1 insulin (MedChemExpress, HY-P0035).
HAP1 CHOPNeon wild-type (WT) and ∆HRI cells, together with clonal 293T ∆OMA1, ∆DELE1, ∆HRI and DELE1HA cells, were previously described21. All cell lines were initially tested for mycoplasma contamination.
CRISPR–Cas9 Gene Editing and Knockout Cell-Line Generation
To generate an endogenous, non-phosphorylatable EIF2S1 variant encoding eIF2αS49A,S52A, 293T cells were transfected with a pX330 CRISPR plasmid (Addgene, 42230) containing an sgRNA targeting exon 2 of EIF2S1, a donor vector encoding the serine-to-alanine substitutions at positions 49 and 52 with approximately 700 bp homology arms on each side of the sgRNA target, and a puromycin-resistance vector. After 24 h, cells were selected with puromycin (1 μg ml–1). Single-cell clones were isolated and screened by PCR and Sanger sequencing.
Clonal and polyclonal knockout cell lines were generated with the CRISPR–Cas9 system. For clonal 293T knockouts lacking OMA1, DELE1, HRI, HMOX1 and/or HMOX2, cells were transiently transfected with pX330 containing the relevant sgRNA together with a puromycin- or blasticidin-resistance vector. Lentiviral transduction with a pLentiCRISPR v.2 derivative (Addgene, 52961) containing the relevant sgRNA was used to delete OMA1, DELE1, HRI or NIX in A549, HeLa, U2OS, BJEH, HCT116, SH-SY5Y and K562 cells.
After 24 h of transfection or transduction, cells were selected with puromycin (1 μg ml–1) or blasticidin (10 μg ml–1). Knockout efficiency was evaluated by immunoblotting. Where indicated, clonal derivatives were obtained by single-cell cloning and validated using PCR, Sanger sequencing and immunoblotting. sgRNA and genotyping-primer sequences are provided in Supplementary Table 1.
Haploid Genetic Screen to Identify CHOP Regulators
Genome-wide mutagenesis of haploid HAP1 cells was performed as previously described21. Gene-trap retroviral particles were generated in 293T cells, concentrated by ultracentrifugation at 22,800 rpm for 2 h at 4 °C and stored overnight at 4 °C. To create a random insertional-mutagenesis library, 1.5 × 10⁷ haploid HAP1 CHOPNeon cells were transduced with concentrated viral particles 24 h after plating, followed by two additional transductions.
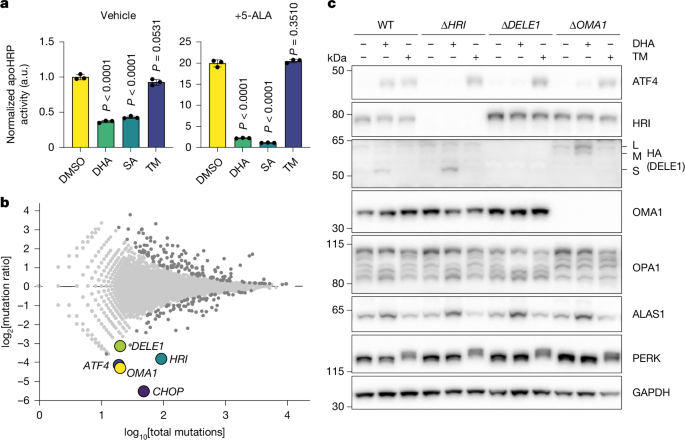
The mutant library was expanded, plated at 20% confluence across 20 T175 flasks (Sarstedt) and treated with 5 μM DHA for 9 h, 48 h after plating. Cells were harvested with 0.25% trypsin–EDTA (Gibco), filtered through a 40 μm cell strainer (Greiner, 542040) and fixed with one volume of BD Fix Buffer I (BD Biosciences) for 10 min at 37 °C. Fixation was stopped with PBS containing 1% FCS. After refiltration, approximately 1.5 × 10⁹ cells were permeabilized with one pellet volume of cold BD Perm Buffer III (BD Biosciences) for 30 min on ice.
Cells were blocked for 30 min at room temperature in PBS containing 1% FCS and 3% BSA. CHOP(Neon) fluorescence was enhanced by staining with anti-mNeonGreen antibody (ProteinTech, 32F6; 1:2,500) in PBS containing 1% FCS and 1% BSA for 2.5 h at room temperature on a rotor wheel. Cells were washed three times for 15 min with PBS containing 1% FCS and incubated with AlexaFluor 488-conjugated anti-mouse secondary antibody (Life Technologies; 1:500) for 1 h at room temperature in the dark. DAPI (Sigma-Aldrich, D9542) was included at 2.5 μg ml–1 for DNA counterstaining.
After three additional washes, cells were resuspended in PBS containing 1% FCS and stored at 4 °C until sorting on a BD Fusion cell sorter (BD Biosciences) using FACSDiva v.8.0.2 and a 70 μm nozzle. Staining specificity was assessed with a secondary-antibody-only control. Haploid cells were identified by DAPI DNA content. Approximately 107 cells from the bottom 4% of CHOP(Neon)-low and top 4% of CHOP(Neon)-high populations were sorted into PBS containing 10% FCS for genomic-DNA isolation.
Gene-Trap Insertion-Site Mapping and Analysis
Genomic DNA was extracted from sorted cells after overnight de-crosslinking at 56 °C using the QIAamp DNA Mini kit (Qiagen, 51306). Gene-trap insertion sites from CHOP(Neon)-high and CHOP(Neon)-low populations were recovered as previously described21. Amplified libraries were sequenced on a NextSeq1000 (Illumina) using 60-nucleotide reads. Indexed samples were demultiplexed while allowing one mismatch.
Reads were aligned to the human reference genome (hg19) and processed as previously described21. Bowtie53 v.1.0.1 was used for alignment with one mismatch permitted. Reads were then mapped to RefSeq protein-coding gene coordinates with intersectBED54 v.2.26.0. Only sense-orientation integrations were considered disruptive and included in downstream analysis.
For each gene, CHOP(Neon) regulators in DHA-treated cells were identified by comparing the number of unique gene-trap insertions in the query gene with the total number of insertions in each sample. CHOP(Neon)-high and CHOP(Neon)-low populations were compared using a two-sided Fisher’s exact test with Benjamini–Hochberg false-discovery-rate correction. Fishtail plots displayed the combined number of unique mutations on the x axis and the normalized high-to-low mutation ratio on the y axis. Plots were generated in GraphPad Prism 10.
Cell Treatments, Transfections and Viral Transductions
Unless otherwise specified, cells were treated for the indicated times with 20 μM CCCP (Sigma-Aldrich, C2759), 1 μM oligomycin A (Sigma-Aldrich, 75351), 10 μM antimycin A (Sigma-Aldrich, A8674), 10 μM tunicamycin (MedChemExpress, HY-A0098), 5 μM DHA (MedChemExpress, HY-N0176), 100 μM SA (Sigma-Aldrich, D1415), 20 μM NMPP (Cayman Chemical, Cay20846-5), 250 nM ISRIB (Sigma-Aldrich, SML0843), 20 μM haemin (Sigma-Aldrich, 51280), 5 mM GSH (Merck-Sigma, G4251), 10 mM NAC (Sigma-Aldrich, A9165), 100 μM FeCl2 (Sigma-Aldrich, 372870) or 100 μM DFO (Sigma-Aldrich, D9533).
For robust haem starvation with SA, NMPP or the combination, standard FCS was replaced with 5% haem-depleted FCS. Heat-inactivated FCS was incubated with 10 mM ascorbic acid for 8 h at 37 °C and dialysed three times against PBS. Haemin stocks were prepared as described previously55, except that ethylene glycol was used as the solvent. A 5 mM stock was prepared by dissolving 32.6 mg haemin chloride in 500 μl 1 M NaOH, 500 μl 0.5 M Tris and 8.4 ml ethylene glycol. The pH was adjusted to 7.4 with 600 µl 1 M HCl, and the stock was stored at −20 °C. A matching solution without haemin chloride served as the control.
For haem-rescue experiments, haemin was added 2 h before SA or NMPP treatment and 12 h before DHA treatment. shRNA expression from pLKO vectors was induced with 500 ng ml–1 doxycycline hyclate (Biomol, Cay14422-1) for 3 days. shRNA sequences are listed in Supplementary Table 1.
Cells were transfected with polyethylenimine (PEI 25,000; Polysciences) or Turbofectin (OriGene Technologies). PEI was used for 293T cells at a PEI-to-DNA ratio of 3:1, whereas Turbofectin was used for HAP1 cells at a ratio of 2.5:1. Reagents and DNA were diluted separately in OptiMEM (Gibco), incubated for 10 min at room temperature, combined by pipetting and incubated for a further 20 min before addition to cells at 50% confluence.
For analysis of ectopic HRI activity with or without haemin, 293T DELE1/HRI double-knockout cells were seeded in 24-well plates and transfected with 100 ng HRI plus 400 ng DELE1 or empty-vector DNA. After 4 h, cells were treated with the indicated haemin concentration and harvested 24 h after transfection. For HRI and/or DELE1 purification, 293T EIF2S1S49A,S52A WT or HRI-knockout cells were grown on 15 cm dishes, transfected with 30 μg plasmid DNA, treated with haemin 24 h later and collected after an additional 24 h.
Lentiviral and retroviral particles were produced as previously described21. Briefly, 293T cells were transfected with lentiviral packaging plasmids pCMVd8.2dVPR, pCMV-VSV-G and pAdVAntage, or retroviral packaging plasmids pCMV-Gag-Pol, pCMV-VSV-G and pAdVAntage, together with the indicated transfer vector encoding the relevant cDNA, Cas9 or sgRNA. After 48 h, viral supernatants were collected, filtered through a 0.45 μm syringe filter (Sarstedt) and diluted 1:2 for transduction in the presence of protamine sulfate. After 24 h, cells were selected for at least 48 h with puromycin (1 μg ml–1), blasticidin (10 μg ml–1) or hygromycin (300 μg ml–1), followed by 24 h of recovery in antibiotic-free medium.
DNA Cloning and Construct Validation
Coding sequences were amplified from human cDNA or synthesized as codon-optimized gene blocks (IDT), as listed in Supplementary Table 2. Point mutations were introduced by overlap-extension PCR or gene synthesis. Oligonucleotide sequences are provided in Supplementary Table 1. Amplified DNA was digested and ligated using standard molecular-cloning procedures. All constructs were verified by Sanger sequencing.
SDS–PAGE, Native Gel Electrophoresis and Immunoblotting
For denaturing protein analysis, cells were treated as indicated in the figure legends, washed with PBS and lysed in SDS sample buffer containing 60 mM Tris pH 6.8, 2% SDS, 10% glycerol, 0.01% bromophenol blue and 4% β-mercaptoethanol. For phosphatase treatment, cells were lysed for 15 min on ice in DISC buffer containing 30 mM Tris-HCl pH 7.5, 150 mM NaCl, 10% glycerol, protease inhibitor cocktail (Roche, 11697498001) and 1% NP-40. Lysates were clarified twice at 20,000g for 10 min at 4 °C. FastAP buffer and thermosensitive alkaline phosphatase (Thermo Fisher Scientific, EF0654) were added to the supernatants, followed by incubation at 37 °C for 1 h. Reactions were stopped with SDS sample buffer.
Samples were denatured at 95 °C for 10 min. Equal protein amounts were separated by SDS–PAGE and transferred to PVDF membranes (Millipore) using semi-dry transfer with a Bolt system (Thermo Fisher Scientific) and transfer buffer containing 190 mM glycine, 25 mM Tris and 20% ethanol. Routine immunoblots used 4–12% Bolt gradient gels and MOPS or MES running buffers. HRI phosphorylation was analysed on 7.5% Tris–glycine gels using buffer containing 25 mM Tris, 192 mM glycine and 0.1% SDS.
Membranes were blocked for 1 h at room temperature in TBST containing 25 mM Tris-HCl pH 7.6, 150 mM NaCl, 0.02% Tween 20 and 5% dry milk. Primary antibodies were incubated for 2 h at room temperature or overnight at 4 °C. Membranes were washed three times with TBST and incubated for 1 h with HRP-conjugated goat anti-rabbit or anti-mouse secondary antibodies (Bio-Rad) diluted in TBST containing 5% dry milk. After three further washes, enhanced chemiluminescence solution56 was applied and signals were recorded using a Bio-Rad ChemiDoc MP system. Antibody information is provided in Supplementary Table 3.
DELE1- and HRI-containing protein assemblies were analysed by native gel electrophoresis. Cells were treated as indicated, washed with PBS and lysed for 20 min on ice in NativePAGE sample buffer (Thermo Fisher) containing protease inhibitors and 0.02% digitonin (Sigma-Aldrich, D141). Extracts were clarified twice at 20,000g for 10 min at 4 °C. NativePAGE G-250 additive was added to 0.025% (v/v), and samples were separated on 3–12% Bis-Tris Mini gels using NativePAGE cathode and anode buffers. NativeMark protein standards (Fisher Scientific) were used to estimate complex molecular masses. Proteins were transferred to PVDF membranes with NuPAGE transfer buffer and detected by immunoblotting.
Mitochondrial Membrane Isolation and Subfractionation
For cytosolic and mitochondrial haem measurements, 293T WT cells were treated with 5 μM DHA for 6 h. Cells were scraped, washed with PBS and pelleted at 450g for 5 min. Pellets were resuspended in homogenization buffer containing 20 mM HEPES-KOH pH 7, 220 mM mannitol, 70 mM sucrose and 20 μM EGTA. Cells were lysed on ice by passing the suspension through a 25 G needle attached to a 1 ml syringe for three cycles of 10 passes, with cooling between cycles.
Cell debris was removed by two centrifugation steps at 700g for 5 min at 4 °C. The supernatant was centrifuged at 8,000g for 15 min at 4 °C to pellet crude mitochondria. Cytosolic fractions were transferred to new tubes and centrifuged again at 20,000g for 5 min at 4 °C to remove residual mitochondria.
Mitochondrial pellets were resuspended in EM buffer containing 10 mM HEPES-KOH pH 7.4 and 1 mM EDTA–KOH pH 8.0. Outer mitochondrial membrane and intermembrane-space fractions were released by incubation for 20 min on ice in SEM buffer containing 250 mM sucrose, 10 mM HEPES-KOH pH 7.4, 1 mM EDTA–KOH pH 8.0 and 0.1% digitonin. Inner mitochondrial membrane and matrix fractions were re-isolated at 10,000g for 10 min at 4 °C, resuspended in SEM buffer containing 1% Triton X-100 and incubated for 20 min on ice.
Cellular and Protein-Bound Haem Measurements
Commercial apoHRP, APO/HRP4C peroxidase (BBI Solutions, APO/HRP4C), was used for enzyme-based haem assays. Residual haem was removed by dissolving apoHRP at 4 mg ml–1 in PBS and extracting haem with 5 ml acetone and 125 μl concentrated hydrochloric acid per milligram of apoHRP. Extracted apoHRP was recovered at 2,000g for 2 min at room temperature, dissolved in PBS at 50 μM and stored at −20 °C.
For cellular haem measurements, treated cells were lysed in PBS or DISC buffer containing protease inhibitor and 1% Triton X-100. Protein concentrations were determined by Bradford assay and equalized. ApoHRP was added to 12.5 μM, and samples were incubated for 10 min on ice. HRP-bound haem was detected by adding TMB ELISA substrate (Serva, 37068.01) and measuring absorbance at 562 nm after 10 min at room temperature in the dark using a Tecan Spark microplate reader controlled by SparkControl v.3.1.
Haem binding to purified endogenous, stable or transiently expressed HRI was measured using the same procedure, except that biotin-eluted or pH-shift-eluted HRI was denatured for 15 min at 98 °C before incubation with apoHRP. To measure haem release from HRI after CCCP, oligomycin A or DHA treatment, Strep-tagged HRI expressed in 293T EIF2S1S49A,S52A WT or DELE1-knockout cells, with or without stable L-DELE1 co-expression, was captured by affinity purification.
Soret-Band Analysis of HRI Haem Binding
HRI haem binding was assessed by UV–visible spectroscopy. HRI purified with or without S-DELE1 was scanned from 250 to 600 nm using a V630 Bio spectrophotometer (Jasco) equipped with a 10 mm quartz cuvette (Hellma Analytics, 105-202-15-40) and Spectra Manager II software. Spectra were blanked against elution buffer and normalized to protein concentrations calculated from absorbance at 280 nm using extinction coefficients of 116,180 M−1 cm−1 for the HRI dimer and 190,340 M−1 cm−1 for the HRI–DELE1 tetramer. Equal protein loading was confirmed by Coomassie-stained gel analysis.
Immunoprecipitation and Affinity Purification of HRI Complexes
For HRI purification from cytosolic extracts, treated cells were scraped into ice-cold PBS, washed and lysed for 20 min on ice in DISC buffer containing protease inhibitor, phosphatase inhibitor (Thermo Fisher, A32957) and 0.02% digitonin. Extracts were clarified twice at 20,000g for 10 min at 4 °C.
Cleared lysates were incubated with Strep-Tactin Sepharose resin (IBA, 2-1201-010), anti-Flag M2 magnetic beads (Sigma, M8823) or GFP-Trap magnetic agarose (Chromotek, gtma-20) to isolate StrepTagII-, Flag- or GFP-containing complexes, respectively. Endogenous HRI was immunoprecipitated using anti-eIF2AK1 antibodies (Proteintech, 20499-1-AP) coupled to Pierce protein A beads (Thermo Fisher, 20333) at an antibody-to-lysate ratio of 1:1,000.
Beads were washed five times with detergent-free DISC buffer before lysate addition. After incubation for 1.5–3 h at 4 °C on a rotor wheel, beads were washed six times with DISC buffer containing 0.1% Triton X-100. Bound proteins were eluted in SDS sample buffer for 10 min at 95 °C and analysed by gel electrophoresis. For sequential immunoprecipitation or haem assays, Strep-tagged proteins were eluted with 50 mM biotin in elution buffer containing 50 mM NaCl, 20 mM HEPES pH 8.0 and 10% glycerol. GFP complexes were eluted with 3C protease (Sigma-Aldrich, GE27-0843-01), while Flag- or EIF2AK1-antibody-bound proteins were eluted with 200 mM glycine pH 2.5 and neutralized with Tris-HCl pH 10.5. Unless otherwise indicated, 1–1.5% of the input was loaded as an immunopurification control.
Medium-Scale HRI and DELE1 Purification from Mammalian Cells
For in vitro haem-binding, mass-photometry and crosslinking experiments, Strep-tagged HRI, Flag-tagged S-DELE1 or StHA-tagged S-DELE1 was purified from 293T EIF2S1S49A,S52A cells. Cells were transfected with the relevant construct and cultured with or without 20 μM haemin. After 48 h, cells were collected, washed with PBS and lysed for 30 min on ice in modified DISC buffer containing 20 mM HEPES pH 7.5, 150 mM NaCl, 10% glycerol, protease inhibitor, phosphatase inhibitor and 0.02% digitonin.
Cell debris was removed by centrifugation twice at 21,000g for 10 min at 4 °C. Extracts were incubated with Strep-Tactin Sepharose or anti-Flag M2 magnetic beads for 1.5 h at 4 °C. Beads were washed six times with lysis buffer. Strep-tagged or StHA-tagged proteins were eluted with 50 mM biotin in elution buffer for haem-binding, mass-photometry or crosslinking assays.
For in vitro haem-release assays, Strep-tagged HRI remained bound to the beads after washing and was incubated for an additional 4 h with pH-eluted Flag-tagged S-DELE1 or elution buffer. The supernatant was collected, beads were washed three times with lysis buffer and HRI was eluted with biotin. For mass-spectrometric analysis of HRI phosphorylation, Strep-tagged HRI was eluted with SDS sample buffer for 10 min at 95 °C. Flag-tagged DELE1 was eluted with 200 mM glycine pH 2.5 and neutralized with Tris-HCl pH 10.5.
GST Pull-Down Assay for HRI–DELE1 Interactions
GST-fused HRI and HRI mutants were expressed in Escherichia coli BL21-CodonPlus (DE3)-RIPL (Agilent Technologies) in LB medium. At an OD600 of 0.2, expression was induced with 1 mM IPTG (Thermo Scientific, R0393) at 8 °C and 120 rpm for 48 h. Bacteria were collected at 6,000g for 10 min at 4 °C and lysed by sonication on ice in buffer containing 30 mM Tris-HCl pH 7.5, 500 mM NaCl, 10% glycerol and 0.5 mM DTT, supplemented with protease and phosphatase inhibitors.
Lysates were clarified at 18,000g for 30 min at 4 °C and incubated with glutathione Sepharose 4B beads (Cytiva, GE17-0756-01) for 1 h at 4 °C with rolling. Beads were collected at 700g for 20 s and washed three times with buffer containing 30 mM Tris-HCl pH 7.5, 150 mM NaCl, 10% glycerol and 0.25 mM DTT.
293T cells were transfected with a plasmid encoding triple HA-tagged S-DELE1 and harvested 2 days later. Cells were lysed in DISC buffer containing protease inhibitor, phosphatase inhibitor and 0.02% digitonin. Cleared lysates were incubated with GST-fusion-loaded beads for 1 h at 4 °C. Beads were washed five times, and bound proteins were eluted in SDS sample buffer, heated at 95 °C for 10 min and analysed by SDS–PAGE and immunoblotting. For coupled dephosphorylation and GST pull-down assays, GST-fusion beads were treated with lambda protein phosphatase according to the manufacturer’s instructions without phosphatase inhibitor.
Recombinant Protein Purification from Bacteria
6×His-TEV-tagged HRI, HRI(K196R) or HRI co-expressed with S-DELE1 were produced under the same conditions as GST-fusion proteins. Bacterial cultures were induced at 8 °C and 120 rpm for 48 h, collected at 6,000g for 10 min at 4 °C and lysed by sonication in buffer containing 30 mM Tris-HCl pH 8.0, 500 mM NaCl, 25 mM imidazole, 10% glycerol and 0.5 mM DTT, supplemented with protease and phosphatase inhibitors.
After clarification at 18,000g for 30 min at 4 °C, lysates were incubated with Ni-NTA resin (HisPur, 88221) for 1 h at 4 °C with rolling and loaded onto gravity-flow columns. Resin was washed three times with buffer containing 30 mM Tris-HCl pH 8.0, 150 mM NaCl, 50 mM imidazole, 5% glycerol and 0.25 mM DTT. Proteins were eluted with 500 mM imidazole and concentrated using Amicon ultracentrifuge filters.
Concentrated proteins were separated by size-exclusion chromatography on a Superose 6 Increase 10/300 GL column (Cytiva) connected to an ÄKTA pure system. The SEC buffer contained 30 mM HEPES pH 7.5, 100 mM NaCl and 0.25 mM DTT. Main-peak fractions were assessed by SDS–PAGE. Fractions with greater than 95% purity by Coomassie staining were concentrated, used immediately or snap-frozen in liquid nitrogen and stored at −80 °C.
6×His-MBP-GST-TEV-tagged eIF2α and eIF2α(S49A,S52A) were purified similarly, except that expression was performed at 16 °C and 120 rpm overnight. Following Ni-NTA elution, tags were removed with TEV protease supplied by K.-P. Hopfner. Size-exclusion chromatography was performed using a Superdex 75 10/300 GL column (Cytiva).
In Vitro HRI Kinase Assays
To establish the linear range of HRI-mediated eIF2α phosphorylation, 0–200 nM HRI, 20 μM eIF2α and 40 μM ATP were incubated in PK buffer containing 50 mM Tris-HCl pH 7.5, 10 mM MgCl2, 0.1 mM EDTA, 2 mM DTT and 0.01% Brij 35 at 37 °C for 0–12 min. Initial and maximal reaction velocities were measured using 50 nM HRI, 1.25–40 μM eIF2α and 40 μM ATP for 0–10 min at 37 °C.
For haemin IC50 measurements, 50 nM HRI or HRI–S-DELE1 was incubated with 0–20 μM haemin for 10 min at 25 °C. Reactions were then initiated with 5 μM eIF2α and 40 μM ATP in PK buffer and incubated for 10 min at 37 °C. Reactions were stopped with SDS sample buffer. A 3 μl aliquot was analysed by dot blotting on nitrocellulose membranes with a phospho-eIF2α(Ser52) antibody.
Mass Photometry of HRI and DELE1
The molecular masses of HRI and DELE1 complexes were measured with a TwoMP mass photometer (Refeyn). Before each measurement, focus was adjusted using 10 μl mass-photometry buffer containing 30 mM HEPES pH 7.5 and 100 mM NaCl in a new flow chamber. HRI or DELE1 was added to a final concentration of 50 nM immediately before measurement. Videos were recorded for 60 s and analysed using Refeyn AcquireMP v.2.3 and DiscoverMP v.2.3.
Sample Preparation for HRI Phosphorylation-Site Analysis by Mass Spectrometry
To measure phosphorylation of overexpressed HRI following haem release and S-DELE1-dependent kinase activation, Strep-tagged HRI purified from human cells was separated by denaturing gel electrophoresis. Gels were stained with 0.1% Coomassie brilliant blue R in 10% acetic acid and 20% ethanol, destained with 10% acetic acid and 30% ethanol, and HRI bands were excised.
Gel pieces were incubated in acetonitrile for 15 min at room temperature, reduced with 10 mM DTT at 60 °C for 1 h and washed with acetonitrile. Proteins were alkylated with 55 mM chloroacetamide for 30 min at room temperature in the dark. Alternating acetonitrile and 50 mM ammonium bicarbonate washes were used for destaining. Proteins were digested overnight at 37 °C with trypsin (10 ng µl–1; Promega). Supernatants were acidified with formic acid to 1%, dried in a SpeedVac centrifuge (Eppendorf, Concentrator Plus) and resuspended in 0.1% formic acid for LC–MS/MS.
For analysis of DELE1-dependent phosphorylation of endogenous HRI following haem deficiency, or suppression of HRI phosphorylation by haemin, endogenous HRI was immunopurified from treated 293T EIF2S1S49A,S52A WT or DELE1-knockout cells using protein-A-coupled EIF2AK1 antibodies. The final three washes were performed with detergent-free DISC buffer. Beads were snap-frozen in liquid nitrogen and stored at −80 °C.
Beads were resuspended in 4% sodium deoxycholate in 100 mM Tris-HCl pH 8.5 and denatured for 5 min at 95 °C with shaking at 1,000 rpm. Samples were reduced and alkylated with 10 mM TCEP and 40 mM 2-chloroacetamide for 5 min at 45 °C, then digested with 0.5 µg LysC (Wako Chemicals) and 0.5 µg sequencing-grade trypsin (Promega) for 16 h at 30 °C. Peptides were acidified with trifluoroacetic acid, desalted using SDB-RPS discs (3M) and resuspended in 0.1% formic acid for LC–MS/MS.
LC–MS/MS Acquisition for HRI Phosphorylation Analysis
Samples were analysed with an Eclipse mass spectrometer coupled to a Dionex Ultimate 3000 RSLCnano system (Thermo Fisher Scientific). The LC system used a 75 μm × 2 cm trap column and a 75 μm × 40 cm analytical column packed with Reprosil Pur ODS-3 particles (1.9 μm; Dr Maisch).
Peptides were loaded in 0.1% formic acid at 5 μl min–1 and separated with a 50 min linear gradient from 4% to 32% solvent B at 300 nl min–1. Solvent B contained 0.1% formic acid and 5% DMSO in acetonitrile; solvent A contained 0.1% formic acid and 5% DMSO in HPLC-grade water.
The Eclipse instrument operated in positive-ion DDA mode. MS1 spectra were acquired in the Orbitrap from 360 to 1,300 m/z at 60,000 resolution, with an automatic gain-control target of 100%, a 50 ms maximum injection time and a 2 s cycle time. MS2 spectra were acquired using higher-energy collision-induced dissociation at a normalized collision energy of 30%. For full-proteome analysis, the precursor isolation window was 1.3 m/z, MS2 resolution was 15,000, the automatic gain-control target was 200% and the maximum injection time was 22 ms. Precursors with charge states of 2–6 were selected, with dynamic exclusion set to 30 s.
Endogenous HRI phosphopeptides were monitored by parallel reaction monitoring using the same LC gradient. PROCAL57 retention-time peptides were added before LC–MS analysis.
Bioinformatic Processing of HRI Phosphorylation Mass-Spectrometry Data
DDA raw files were processed with MaxQuant58 v.2.4.0.0 using default settings, intensity-based absolute quantification (iBAQ), protein, peptide-spectrum match and site FDR thresholds of 0.01, and a maximum of two missed tryptic cleavages. Ser, Thr and Tyr phosphorylation was included as a variable modification, and “match between runs” was enabled. Spectra were searched against the forward and reverse human reference proteomes, including isoforms (UniProt UP000005640; taxon ID 9606).
MaxQuant results were analysed with Perseus59 v.1.6.15.0. Phosphosite intensities from phospho(STY)Sites.txt were log2-transformed and filtered for at least three valid values in one group. Missing values were imputed from a normal distribution. Differential HRI phosphorylation between HRI + haemin and HRI + haemin + DELE1 samples was assessed with a two-sided Student’s t-test using S0 = 0.5 and permutation-based FDR < 0.05 with 250 randomizations.
HRI iBAQ values from proteinGroups.txt were compared to confirm equivalent HRI protein abundance. For lollipop plots, summed phosphosite intensities were normalized to HRI expression based on log2-transformed iBAQ values.
Parallel-reaction-monitoring raw files were imported into Skyline-daily60 v.25.1. A spectral library was generated from HRI phosphopeptide MS/MS spectra identified by DDA. Peaks were integrated automatically and manually curated. The summed fragment-ion area was exported for quantification, and phosphopeptide intensities were normalized to the summed intensity of unmodified HRI peptides in each sample.
Sample Preparation for Protein–Protein Crosslinking Mass Spectrometry
To evaluate conformational changes in HRI following haem release and S-DELE1-mediated kinase activation, Strep-tagged HRI purified from human cells with or without S-DELE1 was crosslinked for 30 min at room temperature with 125 μM DSS. Reactions were quenched with 25 mM Tris-HCl pH 7.5 for 10 min on ice.
Crosslinked proteins were denatured in 4 M urea in 50 mM Tris buffer. Disulfides were reduced and alkylated with 10 mM TCEP and 40 mM 2-chloroacetamide for 20 min at 37 °C. Samples were diluted threefold with MS-grade water and digested overnight at 37 °C with 1 µg LysC and 2 µg trypsin (Promega). Digests were acidified to 1% trifluoroacetic acid, desalted using Sep-Pak C18 1 cc cartridges (Waters) and loaded at 200 ng onto Evotips Pure (Evosep).
LC–MS/MS Acquisition for Protein Crosslink Analysis
Peptides were eluted from Evotips onto a 15 cm PepSep C18 column (15 cm × 150 µm; 1.5 µm particles; Bruker Daltonics) using an Evosep One HPLC system and the 30-samples-per-day method. MS analysis was conducted on an Orbitrap Exploris 480 (Thermo Fisher Scientific) in DDA mode.
Full MS spectra were acquired from m/z 300 to 1,650 Th at 60,000 resolution at m/z 200 Th. The 15 most intense precursor ions were fragmented using stepped higher-energy C-trap dissociation at normalized collision energies of 19, 27 and 35. MS2 spectra were acquired at 30,000 resolution across a dynamic m/z range. Automatic gain-control targets were 300% for MS1 and 100% for MS2, with a 25 ms maximum injection time for MS1 and automatic injection time for MS2. Precursors with a +2 charge state were excluded to enrich for crosslinked ions.
Bioinformatic Analysis of Protein Crosslinking MS Data
Raw data were processed in Proteome Discoverer v.2.5.0.400 using XlinkX/PD nodes61. Crosslinked peptides were searched against a FASTA file containing the relevant protein sequences, with DSS/BS3 specified as the crosslinking reagent. Cysteine carbamidomethylation was set as a static modification, while methionine oxidation and N-terminal acetylation were variable modifications.
Trypsin/P was selected as the protease, allowing up to two missed cleavages. Peptide identifications were accepted with a minimum score of 40 and a delta score of at least 4. Identifications were filtered using a 1% peptide-level FDR.
Analytical Flow Cytometry
For CHOP(Neon) fluorescence analysis, HAP1 ∆HRI cells transiently expressing the indicated cDNAs were treated 24 h after transfection. Cells were detached with 0.25% trypsin–EDTA (Gibco) and analysed on a BD LSRFortessa flow cytometer. Co-transfected mCherry was used to identify transfected cells.
Mitochondrial membrane potential, mitochondrial reactive oxygen species and free cellular iron were measured with JC-1 (MedChemExpress, HY-15534), MitoSOX (Thermo Fisher, M36007) and FerroOrange (CST, 36104), respectively. Treated cells were collected by trypsinization, washed with PBS and incubated for 30 min at 37 °C in serum-free medium containing 1 µM MitoSOX, 1 µM JC-1 or 1 µM FerroOrange. Cells were washed with serum-free medium and analysed by flow cytometry.
JC-1 was excited at 488 nm, with emission collected at 585/42 nm for monomers and 530/30 nm for aggregates. MitoSOX was excited at 405 nm and detected at 610/20 nm. FerroOrange was excited at 561 nm and detected at 582/15 nm.
For protein-aggregation analysis, 1 million K562 cells were fixed in 4% formaldehyde (Sigma-Aldrich) in PBS for 30 min at room temperature. Cells were washed, permeabilized in PBS containing 0.5% Triton X-100 for 30 min and stained with Proteostat (Enzo, ENZ-51023; 1:1,250) for 30 min. After one PBS wash, Proteostat fluorescence was measured on a BD LSRFortessa using 488 nm excitation and a 585/42 nm emission filter.
Data were acquired with FACSDiva (BD, v.8.0.1) and analysed with FlowJo (BD, v.10.4). Cells were identified by forward- versus side-scatter area, and doublets were excluded using side-scatter height versus area. For HRI domain-deletion and truncation mutants, the top 10% of mCherry-positive cells were gated. Mean mNeon fluorescence was divided by the mean mNeon signal of untransfected mCherry-negative cells.
For DHA-induced CHOP(Neon) fluorescence in cells expressing invertebrate DELE1 and HRI constructs, background green fluorescence from untransfected DMSO- or DHA-treated cells was subtracted from the mean mNeon signal of mCherry-positive cells. MitoSOX, FerroOrange and Proteostat results represent unprocessed single-cell mean fluorescence normalized to the corresponding control. JC-1 results represent red monomer fluorescence divided by green aggregate fluorescence and normalized to DMSO-treated controls.
Confocal Microscopy of Mitochondrial Morphology
For mitochondrial morphology analysis following haem starvation, BJEH cells were plated on live-cell imaging slides (Ibidi, 80807), treated as indicated and stained with 100 nM TMRM (Thermo Fisher, T668) for 30 min at 37 °C. Cells were washed with normal medium, and mitochondrial images were acquired using a DMi8 scanning confocal microscope (Leica) equipped with a 40× water-immersion objective (Plan Apochromat, NA 1.1), white-light laser excitation, a HyD detector (Leica TCS SP8 X) and a humidified environmental chamber maintained at 5% CO2 and 37 °C.
Images were acquired with Leica Application Suite X v.3.5.7. Mitochondrial morphology was scored using Fiji v.2.16.0/1.54p and ImageJ v.1.54f. Cells containing short, rounded mitochondria were classified as “fragmented”, whereas cells with unusually long, highly connected mitochondria were classified as “elongated”.
AlphaFold Protein Structure Predictions
Protein structures were predicted with AlphaFold23 v.3 and visualized using UCSF ChimeraX62 v.1.8. The DELE1–HRI interaction model was generated using two copies each of HRI(1–143) and DELE1(238–436). Human and H. vulgaris protein overlays were based on AlphaFold models from UniProt: Q96E52 (192–524), T2M7Q7 (110–391), Q14154 (229–436), T2MDI1 (135–420), Q9BQI3 (63–238; 376–630) and XP047128012.1 (45–220; 303–562).
Seahorse Mitochondrial Stress-Test Assays
Mitochondrial respiration was measured with the Agilent Seahorse XF Cell Mito Stress Test kit and XFe96/XF Pro FluxPak Mini (Agilent Technologies, 103015-100 and 103793-100). Oxygen-consumption rates were recorded using a Seahorse XFe96 Analyzer according to the manufacturer’s instructions.
293T cells were seeded on poly-l-lysine-coated XFe96 plates at 2 × 10⁴ cells per well for DHA experiments or 1 × 10⁴ cells per well for SA and SA + NMPP experiments, one day before treatment. Cells were treated with 5 μM DHA for 4 h or 100 μM SA or 100 μM SA + 20 μM NMPP for 24 h.
One hour before measurement, cells were washed twice with Seahorse XF DMEM containing 1 mM pyruvate, 2 mM glutamine and 10 mM glucose. Bright-field images were acquired in a CO2-free BioTek Cytation 1 imaging reader. The mitochondrial stress test was performed using 1.5 μM oligomycin, 1 μM FCCP and 0.5 μM rotenone–antimycin A.
For cell-number normalization, Hoechst 33342 (Thermo Fisher Scientific, 62249) was added to the rotenone–antimycin A injection solution at 10 μM. Fluorescence images were collected after the assay, and cell counts were imported into Wave v.2.6.1 for normalization. Data were analysed using Seahorse Analytics v.1.0.0.796.
Statistics, Data Analysis and Reproducibility
For the genome-wide haploid genetic screen, 2.19 × 10⁷ single cells were analysed phenotypically according to CHOP(Neon) fluorescence and genetically by sequencing gene-trap insertion sites. This produced 2,743,720 unique sense-orientation mutations. Mutation enrichment in the high- and low-fluorescence populations was assessed with a two-sided Fisher’s exact test, and P values were corrected using the Benjamini–Hochberg method as previously described21.
Haem measurements are presented as mean ± s.d. from at least three independent biological replicates, with technical duplicates or triplicates in each experiment. Exact biological replicate numbers are provided in the figure legends. HRI haem-binding measurements were normalized to the average signal intensity of each experiment to account for background differences between independent experiments.
For MS analysis of overexpressed HRI phosphorylation (Fig. 4b and Extended Data Fig. 8i), four independent biological replicates were measured in the same run. Endogenous HRI phosphorylation after DHA or SA treatment (Extended Data Fig. 8j,k) was analysed using three independent replicates for WT–DMSO and four for all other conditions. Endogenous HRI phosphorylation after haemin treatment (Extended Data Fig. 8l) was measured using four independent biological replicates. Crosslinking-MS experiments (Fig. 4c,d and Extended Data Fig. 8p) used four independent biological replicates measured in the same run; only crosslinks detected in at least three replicates are shown.
Immunoblots and protein gels are representative of at least three independent biological replicates with comparable results. Immunoblot quantifications and statistical analyses are presented as mean ± s.d.; sample sizes are given in the figure legends. Data were acquired with Image Lab (Bio-Rad, v.5.2) or FusionCapt Advance FX7 (Vilber, v.17.04a). Chemiluminescence was quantified with Image Lab and normalized to the average signal of each experiment and to a loading control63. Uncropped immunoblots and protein gels are provided in Supplementary Fig. 1.
Mitochondrial morphology data represent mean ± s.d. from three independent biological replicates, with at least 30 cells analysed per condition in each experiment. Analytical flow-cytometry and Seahorse data represent mean ± s.d. from three independent biological replicates, each containing at least technical triplicates.
Sample sizes were not predetermined using statistical methods. Experiments were not randomized, and investigators were not blinded during allocation, experimentation or outcome assessment. Statistical significance was evaluated using two-sided t-tests for comparisons between two groups or one-way or two-way ANOVA for multiple-group comparisons, followed by the appropriate multiple-comparison test in GraphPad Prism 10. The statistical test used for each experiment is specified in the relevant figure legend. Numerical data are provided in Supplementary Data 5.
Inclusion and Ethics Statement
This study used commercially available human cell lines only. No human participants or animals were involved, and no personally identifiable information was collected or used. All procedures complied with institutional biosafety and ethical requirements. The research team included contributors from different career stages and institutions; all contributors met authorship requirements and received appropriate credit.
Reporting Summary
Additional information about the research design is available in the Nature Portfolio Reporting Summary linked to this article.
Source: www.nature.com