


Expression and purification of β2AR in Sf9 cells
The β2-adrenergic receptor (β2AR) construct PN1 was expressed and purified as previously described39,42. Briefly, Sf9 cells were infected with PN1-containing baculovirus generated using the BestBac system. Cells were harvested and resuspended in chilled lysis buffer containing 10 mM HEPES, pH 7.4, 1 mM EDTA, 1 μM alprenolol and the protease inhibitors leupeptin and benzamidine. Following cell lysis, membranes were pelleted at 18,600 rpm for 20 min and homogenized by Dounce homogenization in chilled solubilization buffer containing 20 mM HEPES, pH 7.4, 350 mM NaCl, 1% n-dodecyl β-D-maltoside (DDM), 0.1% cholesteryl hemisuccinate (CHS), 2 mM MgCl2, 1 μM alprenolol, protease inhibitors and benzonase.
The membrane suspension was stirred for 90 min at 4 °C and centrifuged at 18,600 rpm for 30 min. CaCl2 was added to the soluble fraction to a final concentration of 2 mM before loading onto anti-Flag (DYKDDDDK) M1 immunoaffinity resin. The resin was washed with 20 mM HEPES, pH 7.4, 350 mM NaCl, 0.1% DDM, 0.01% CHS, 2 mM CaCl2, leupeptin and benzamidine. β2AR was eluted using 20 mM HEPES, pH 7.4, 350 mM NaCl, 0.1% DDM, 0.01% CHS, 5 mM EDTA and 200 μg ml−1 Flag peptide. The eluate was further purified by size-exclusion chromatography on a Superdex 200 10/300 Increase column equilibrated with NH buffer containing 20 mM HEPES, pH 7.4, 100 mM NaCl, 0.1% DDM and 0.01% CHS.
For preparation of homogeneous β2AR dimers, Sf9 cells expressing PN1 were resuspended at room temperature in 20 mM HEPES, pH 7.4, 150 mM NaCl, 10% glycerol, 1 μM alprenolol, protease inhibitors and 10 μM AP. After 30 min at room temperature, membranes were solubilized by adding 1% lauryl maltose neopentyl glycol (LMNG) and 0.1% CHS. The remaining purification steps followed the monomer protocol, except that 0.01% LMNG replaced DDM in all buffers and 10 μM AP was maintained throughout purification.
Expression and purification of heteromeric Gαsβ1γ2
Heterotrimeric Gs was expressed and purified from Trichoplusia ni Hi5 cells as previously described43,44. Two BestBac baculoviruses were generated: one encoding wild-type human Gαs and the other encoding wild-type human β1γ2 with an N-terminal histidine tag on the β subunit. Hi5 cells were coinfected with both viruses for 48 h and harvested by centrifugation.
The cell pellet was resuspended and stirred for 30 min at 4 °C in hypotonic buffer containing 10 mM HEPES, pH 7.4, 100 μM MgCl2, 5 mM β-mercaptoethanol, 20 μM GDP and protease inhibitors. Lysed cells were pelleted at 18,600 rpm for 15 min and homogenized in chilled NH buffer containing 1% sodium cholate, 0.05% DDM, 1 mM MgCl2, 5 mM β-mercaptoethanol, 20 μM GDP and protease inhibitors. After 1.5 h of stirring at 4 °C, the lysate was centrifuged at 18,600 rpm for 35 min.
Imidazole was added to the soluble fraction to a final concentration of 20 mM, and the sample was batch-bound to washed nickel-chelated Sepharose for 2 h. The resin was loaded onto a narrow column, washed with buffers containing progressively lower concentrations of cholate and eluted with NH buffer containing 0.05% DDM, 1 mM MgCl2, 20 μM GDP, 100 μM tris(2-carboxyethyl)phosphine (TCEP) and 250 mM imidazole.
Human rhinovirus 3C protease was added to remove the histidine tag. The eluate was dialysed overnight at 4 °C against 2 l of NH buffer containing 1 mM MgCl2, 0.05% DDM, 20 μM GDP and 100 μM TCEP. The dialysed protein was passed through a second nickel-chelated Sepharose column and washed with dialysis buffer supplemented with 20 mM imidazole. The sample was dephosphorylated for 30 min on ice using lambda protein phosphatase, calf intestinal phosphatase and Antarctic phosphatase in the presence of 1 mM manganese chloride.
Excess βγ subunits were removed by ion-exchange chromatography on a MonoQ 10/100 GL column. The sample was loaded and washed with 20 mM HEPES, pH 7.4, 1 mM MgCl2, 0.05% DDM, 100 μM TCEP and 20 μM GDP. Heterotrimeric Gs was eluted using a linear NaCl gradient from 50 mM to 500 mM.
Expression and purification of Nb60
Nb60 was expressed in Escherichia coli BL21(DE3) cells and purified as previously described24. Cell lysates were purified using nickel-chelated Sepharose followed by size-exclusion chromatography on a Superdex 200 Increase 10/300 column equilibrated with 20 mM HEPES, pH 7.4, and 150 mM NaCl.
Cryo-EM sample preparation for β2AR complexes
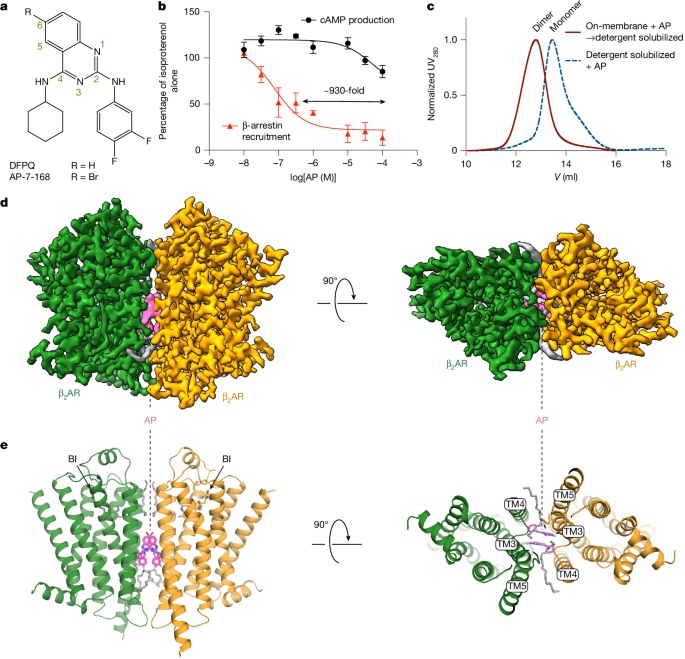
For detergent-solubilized samples, purified PN1 in 0.1% DDM and 0.01% CHS was loaded onto anti-Flag M1 immunoaffinity resin equilibrated in the same detergent mixture and supplemented with 2 mM CaCl2. The receptor was exchanged into the synthetic triglucoside-based detergent TTG-T1045 by washing the resin with progressively increasing TTG-T10:DDM ratios. The final detergent composition was 0.01% TTG-T10 and 0.001% CHS. All exchange buffers contained NH buffer, 2 mM CaCl2, 1 μM carazolol and 10 μM AP.
The receptor was eluted with NH buffer containing 0.01% TTG-T10, 0.001% CHS, 1 μM carazolol, 10 μM AP, 5 mM EDTA and 200 μg ml−1 Flag peptide. PN1 was incubated for 1 h with a twofold molar excess of Nb60. Unbound Nb60 was removed using anti-Flag M1 resin. The resin was washed with NH buffer containing 0.0006% TTG-T10, 0.00006% CHS, 1 μM carazolol, 10 μM AP and 2 mM CaCl2. The β2AR–Nb60 complex was eluted with the same buffer containing 5 mM EDTA and 200 μg ml−1 Flag peptide. The purified complex was concentrated to more than 10 mg ml−1 and used immediately for cryo-EM grid preparation.
To prepare AP-bound β2AR dimers in lipid nanodiscs, purified LMNG-solubilized dimers were reconstituted according to a previously reported protocol42 with modifications. Lipids comprising 1-palmitoyl-2-oleoyl-glycero-3-phosphocholine (POPC, Avanti), 1-palmitoyl-2-oleoyl-sn-glycero-3-phospho-L-serine (POPS, Avanti) and cholesterol (Sigma-Aldrich) were mixed at a 7:2:1 molar ratio, dried under argon and desiccated under vacuum for 2 h. The lipids were resuspended in NH buffer containing 14 mM DDM at 20 mg ml−1.
β2AR was diluted to 10 μM and incubated with 50 μM BI-167107 (PubChem CID: 45483813; MedChemExpress) for 10 min on ice. The receptor, membrane scaffold protein MSP1E3D1 and lipids were combined at a molar ratio of 1:2.5:100 and incubated on ice for 1 h. Detergent was removed by adding semi-wet Bio-Beads SM2 (60 mg ml−1) three times over 3 h, followed by overnight incubation at 4 °C. Bio-Beads were removed the next day, and empty nanodiscs were separated by M1 affinity purification.
Dimeric β2AR nanodiscs were eluted with buffer containing 1 μM BI, 10 μM AP, 5 mM EDTA and 200 μg ml−1 Flag peptide. The eluate was further purified by size-exclusion chromatography in NH buffer containing 1 μM BI and 10 μM AP. Peak fractions were pooled, concentrated to 5 mg ml−1 and used for cryo-EM grid preparation.
Cryo-EM grids were prepared using a Vitrobot Mark IV (Thermo Fisher Scientific). Quantifoil R1.2/1.3 Au grids were glow-discharged in air for 90 s at 10 mA using a PELCO EasiGlow plasma cleaner. Three-microlitre aliquots of protein sample were applied to the grids, blotted with Ted Pella filter paper for 3.0 s and plunge-frozen in liquid ethane cooled by liquid nitrogen.
Cryo-EM data collection and image processing
For detergent-solubilized and nanodisc-reconstituted β2AR samples, 7,139 and 17,997 micrograph stacks, respectively, were collected using a Titan Krios G3i microscope operating at 300 kV. Images were recorded using either a Falcon 4i direct electron detector or a Gatan K3 camera equipped with a Quantum energy filter. Each video stack received a total dose of approximately 50 e− Å−2 over 40 frames.
Motion correction and contrast transfer function (CTF) estimation were performed in cryoSPARC46 using patch motion correction and patch CTF estimation. Particles were identified with the blob picker and extracted with 4× binning for initial two-dimensional classification. Classes with recognizable structural features were selected manually, and monomeric and dimeric particles were processed separately.
Ab initio reconstruction was performed using approximately 10% of selected particles to generate four initial three-dimensional references. Iterative heterogeneous refinement continued until poor-quality classes represented less than 5% of the input particles. The detergent dataset contained 48,805 dimeric and 25,201 monomeric particles for non-uniform refinement47. The nanodisc dataset contained 237,408 dimeric particles.
Particles were imported into RELION 4 (refs. 48,49) for Bayesian polishing50 and then returned to cryoSPARC for additional non-uniform refinement. C2 symmetry was applied during final refinement of dimeric particles. After handedness correction, local and CTF refinement were performed using a soft mask centred on the transmembrane domains. Final map resolutions were estimated using the gold-standard Fourier shell correlation 0.143 criterion, and local resolution was calculated in cryoSPARC.
Cryo-EM model building and refinement
Initial β2AR models, based on PDB entry 2RH1, were docked into the cryo-EM density maps using UCSF Chimera51. Models were manually adjusted in COOT52 to match the density, including ligand placement. Real-space refinement was performed in PHENIX53,54 with secondary-structure and geometric restraints. EMRinger55 was used to validate side-chain fitting. Structural illustrations were generated with PyMOL and ChimeraX56.
Mass photometry of β2AR complexes
Mass photometry was performed using a Refeyn TwoMP instrument and AcquireMP software v.2.3 according to an established protocol57. Microscope coverslips measuring 24 × 50 mm with #1.5 thickness (Corning) were cleaned with deionized water and isopropanol and dried before use. Silicone gaskets were applied immediately before sample loading to form individual wells.
The instrument was calibrated with NativeMark unstained protein standards (Thermo Fisher Scientific) according to the manufacturer’s instructions. For each measurement, 10 μl of NH buffer was added to a well, followed by focal alignment and locking. One microlitre of diluted β2AR sample was then added to achieve a final concentration of 20 nM. Samples were mixed gently, and data were collected for 60 s. At least 2,000 binding events were recorded for each sample. Molecular masses were determined using DiscoverMP software (Refeyn).
Cell unroofing and immunogold cryo-EM labeling
Cell unroofing and immunogold labeling were performed as previously described58,59,60 with modifications. Quantifoil R1.2/1.3 300-mesh gold grids were glow-discharged for 15 s, rinsed three times with 70% ethanol and washed four times with Dulbecco’s PBS (DPBS).
Grids were coated with 0.1 mg ml−1 poly-D-lysine (Gibco) for 1 h at room temperature and washed four times with DPBS. Laminin (Sigma-Aldrich; 15 μg ml−1) was applied for 2 h at 37 °C, after which the grids were washed again with DPBS. Suspension HEK293F cells were seeded onto the prepared grids and cultured until 60–70% confluency.
The HEK293 cell line was obtained from and authenticated by ATCC and was not routinely tested for mycoplasma contamination. β2AR expression was induced by baculovirus transduction using the BacMam protocol (Thermo Fisher Scientific). Approximately 16 h after transduction, cells were rinsed with calcium- and magnesium-containing DPBS. Grids bearing adherent cells were held with tweezers and immersed in hypotonic swell buffer containing 6 mM HEPES-KOH, pH 7.4, 43.3 mM K-gluconate, 1.6 mM NaCl and 0.6 mM MgCl2 for 30 s. A further 6 μl of swell buffer was added to each grid, followed by blotting with Whatman Grade 5 filter paper (Sigma-Aldrich) to remove the apical membrane.
Unroofed samples were blocked for 20 min at room temperature with 3% goat serum (Thermo Fisher Scientific) in DPBS containing protease inhibitors. Primary β2AR antibodies (Thermo Fisher Scientific), diluted in DPBS containing 1% goat serum, were applied for 1 h. Following three DPBS washes, grids were incubated for 1 h with a goat anti-mouse secondary antibody conjugated to colloidal gold (Ted Pella) and diluted in DPBS containing 1% goat serum. Grids were washed three additional times.
Samples were plunge-frozen in liquid ethane using a Leica EM GP2 system and stored in liquid nitrogen. Cryo-EM images were collected on a Glacios G2 microscope operating at 200 kV and equipped with a Falcon 4i detector at a nominal magnification of ×11,000.
Cell-based BRET assays
Cell-based bioluminescence resonance energy transfer (BRET) assays were used to assess AP-dependent cAMP production, β-arrestin recruitment and β2AR dimerization. HEK293 cells endogenously expressing β2AR were transiently transfected with either the intramolecular cAMP sensor CAMYEL or plasmids encoding β-arrestin-2–GFP10 and β2AR–RlucII. CAMYEL contains donor and acceptor molecules fused to the cAMP-binding domain of EPAC and produces a conformationally regulated BRET signal following cAMP binding61.
At 48 h after transfection, cells were preincubated with AP at 0.03–100 μM for 30 min and stimulated with 1 μM isoproterenol (ISO; Sigma-Aldrich) for 30 min. CAMYEL assays used 5 μM coelenterazine H, whereas β-arrestin assays used deep blue coelenterazine (DBC; Cayman Chemical).
For β2AR dimerization experiments, HEK293 cells were cotransfected with 10 ng per well of β2AR–RlucII, β2AR(V129L)–RlucII, β2ARTM3–RlucII or β1AR–RlucII as BRET donors and 20 ng per well of the corresponding GFP-tagged receptors as acceptors. After 48 h, cells were treated with AP at 0.03–100 μM or ISO at 0.1–100 μM for 1 h, or for another interval when specified by the experimental design. DBC was then added for 20 min.
To assess whether AP autofluorescence affected the BRET signal, HEK293 cells expressing β2AR–GFP were treated with AP at 0.03–100 μM for 30 min. The resulting GFP signal was measured directly and expressed as fold change relative to baseline.
For β2AR homodimerization saturation experiments, cells received a fixed amount of β2AR–RlucII plasmid (10 ng per well) and increasing amounts of GFP-tagged β2AR plasmid (0–100 ng per well). BRET measurements were collected 48 h after transfection following a 30-min incubation with DBC.
GRK5 recruitment was evaluated by cotransfecting cells with β2AR–Rluc and GRK5–GFP. Cells were stimulated with increasing ISO concentrations for 30 min and incubated with DBC for 20 min. In separate experiments, cells were pretreated with AP at 0.03–100 μM for 1 h, stimulated with 1 μM ISO for 30 min and measured in the presence of the Rluc substrate DBC.
BRET signals were measured at 395 nm for donor emission and 510 or 530 nm for acceptor emission using an Infinite F500 plate reader (Tecan). Ligand-induced BRET changes were calculated by subtracting the basal signal from the stimulated signal.
For AP-mediated cAMP production, β-arrestin recruitment and GRK5 recruitment, results were expressed as a percentage of the ISO-only response. Dimerization measurements and ISO-induced GRK5 recruitment were expressed as percentages of the maximal BRET signal. Dose–response curves were fitted in GraphPad Prism using three- or four-parameter log[agonist/inhibitor] versus response models. Data are presented as mean ± s.e.m.; n = 3 or 4.
Surface plasmon resonance analysis of AP binding
Surface plasmon resonance (SPR) measurements were performed using a Biacore T200 system. Monomeric β2AR was captured on a high-affinity streptavidin (SA) sensor chip (Cytiva) through a biotinylated anti-Flag M2 antibody (Sigma-Aldrich), producing a final response of approximately 1,500 resonance units.
The running buffer contained 20 mM HEPES, pH 7.5, 100 mM NaCl and 0.01% LMNG. AP was injected at concentrations of 0.6–10 μM at a flow rate of 30 μl min−1. Association and dissociation phases were recorded for each injection. Sensorgrams were double-referenced by subtracting the response from a blank running-buffer injection over the active surface and the response from compound injection over a reference surface lacking immobilized protein. These corrections accounted for bulk refractive-index changes, injection artifacts, nonspecific surface binding and matrix effects. Sensorgrams were processed using Biacore Evaluation Software, and binding curves were fitted with a steady-state affinity model.
Bio-layer interferometry analysis of Gs binding
Bio-layer interferometry (BLI) experiments were performed at 30 °C with continuous shaking at 1,000 rpm using an Octet RED384 system (FortéBio). Streptavidin biosensor tips (Sartorius) were coated with 10 nM biotinylated anti-Flag M1 Fab in NH buffer containing 0.01% LMNG and 0.001% CHS for 300 s.
Flag-tagged β2AR was captured by incubating the tips with 100 nM receptor and 10 μM ISO for 600 s. The biosensors were transferred to wells containing Gs at 30 nM–10 μM in binding buffer supplemented with 10 μM GDP and 0.1% BSA (Sigma-Aldrich) for 180 s. Dissociation was measured for 300 s in buffer-only wells.
Control channels lacking either Gs or immobilized β2AR were used for double-reference subtraction. Association and dissociation traces were fitted with a single-exponential model to determine apparent kon and koff values. Equilibrium binding responses were used to calculate the dissociation constant, KD.
Radioligand-binding assays for β2AR
For saturation binding experiments, 50–100 femtomoles of monomeric or dimeric β2AR reconstituted in nanodiscs were incubated with increasing concentrations of [3H]DHA for 1 h at room temperature in 20 mM HEPES, 100 mM NaCl and 0.5% BSA. Nonspecific radioligand binding was determined in the presence of 10 μM alprenolol. Monomeric β2AR was examined with and without AP.
For competition experiments, monomeric or dimeric β2AR nanodiscs were incubated with 1 nM [3H]DHA and increasing concentrations of ISO or GDP-bound Gs in the same buffer. Nanodiscs were separated from free [3H]DHA using Whatman GF/B filters and a Brandel 96-well harvester. Bound radioactivity was measured with a MicroBeta Jet liquid scintillation counter (PerkinElmer). Data were analysed using GraphPad Prism 10.
GTP turnover assay
GTP hydrolysis was measured with a modified GTPase-Glo assay (Promega) as previously described38,39. Monomeric PN1 (100 nM), reconstituted into MSP1E3D1 nanodiscs, was incubated for 1 h at room temperature with 20 μM ISO and a concentration series of AP in NH buffer containing 0.2% DMSO and 20 μM GTP.
In parallel, 1 μM heterotrimeric Gs was prepared in NH buffer containing 0.04% DDM, 200 μM TCEP, 20 mM MgCl2 and 20 μM GDP. Equal volumes of PN1 and Gs were mixed and incubated for 60 min. The final reaction contained 50 nM ligand-bound PN1 and 500 nM Gs in NH buffer supplemented with 0.1% DMSO, 0.02% DDM, 100 μM TCEP, 10 μM MgCl2, 10 μM GTP and 10 μM GDP.
An equal volume of GTPase-Glo reagent containing NH buffer, 0.02% DDM and 5 μM ATP was added and incubated for 30 min. Detection reagent was then added for 10 min, and luminescence was measured using a MicroBeta counter. For time-course experiments, the same protocol was used except that 200 nM AP-treated dimeric PN1 was included and PN1–Gs reactions were incubated for 30, 60, 90 or 120 min.
Sortase ligation of V2Rpp and β-arrestin competition binding
β2AR constructs containing a C-terminal sortase recognition sequence, LPETGHH inserted after residue 365, were expressed in Sf9 cells and purified using the monomer and AP-stabilized dimer protocols described above.
Synthetic V2Rpp was ligated to the receptor by sortase as previously described36,37. Purified receptor at 10 μM was incubated overnight at 4 °C in NH buffer containing 0.01% LMNG, 0.001% CHS and 5 mM CaCl2, together with 50 μM synthetic GGG–V2Rpp peptide and 2 μM evolved sortase A pentamutant (eSrtA)62. Unreacted receptor and His-tagged eSrtA were removed using nickel-chelated Sepharose resin. Labelled monomeric and dimeric β2AR–V2Rpp samples were reconstituted into nanodiscs using the cryo-EM sample-preparation protocol.
Equilibrium competition radioligand-binding assays used β2AR–V2Rpp nanodiscs, 2 nM [3H]DHA, increasing concentrations of ISO and 1 μM C-terminally truncated β-arrestin-1(382), prepared as previously described63. Where indicated, 10 μM AP was included. Following 1 h of incubation at room temperature, samples were collected and radioactivity was measured as described above to calculate ISO inhibitory constants.
GRK5 radiometric phosphorylation assays
To determine how β2AR dimerization affects receptor phosphorylation, purified β2AR monomers or dimers (1 μM) in LMNG micelles or nanodiscs were incubated with purified C-terminally Strep-tagged GRK5 (50 nM) for 5 min at 30 °C. Reactions contained 20 mM Tris-HCl, pH 7.4, 5 mM MgCl2, 30 mM NaCl, 0.5 mM EDTA, 100 μM [γ32P]ATP (1,000–2,000 cpm pmol−1) and 25 μM BI.
β2AR in LMNG micelles was additionally supplemented with 20 μM C8-PIP2 to improve phosphorylation efficiency in detergent. To examine AP-dependent phosphorylation, purified β2AR monomers (1 μM) in LMNG micelles were reconstituted into PIP2-containing bicelles64, and AP concentrations ranged from 0 to 24 μM.
Reactions were stopped with SDS sample buffer and resolved by SDS–PAGE. Gels were stained with Coomassie blue (Sigma-Aldrich), dried and exposed to autoradiography film. 32P-labelled proteins were excised and counted to determine phosphate transfer. Rates were normalized either to phosphorylation of β2AR monomers or to phosphorylation measured in the absence of AP.
β2AR sample preparation for fluorescence measurements
Site-specific fluorophore labeling of β2AR was performed using engineered cysteine mutants on a minimal cysteine background (Δ6), as previously described38,39. For single-molecule Förster resonance energy transfer (smFRET) experiments, β2ARΔ6 constructs were cloned into the pcDNA-Zeo-tetO vector and transfected into Expi293 cells stably expressing the tetracycline repressor (Thermo Fisher Scientific, A14635). Transfections were performed with the Expifectamine kit according to the manufacturer’s instructions. Two days after transfection, receptor expression was induced with 4 μg ml−1 doxycycline and 5 mM sodium butyrate in the presence of 1 μM alprenolol. Cells were harvested 40 h after induction and immediately processed for purification.
For β2AR dimer studies in liposomes, single-cysteine mutations were introduced at TM5 (R228C) or H8 (I334C). Homogeneous dimers were expressed in Sf9 cells and purified as described above. Purified receptor (10 μM) was incubated for 30 min at room temperature with a fivefold molar excess of a premixed maleimide-conjugated dye pair consisting of DY549P1 (Dyomics) and Alexa Fluor 647 (Thermo Fisher Scientific) at a 1:1.5 ratio. Reactions were quenched with 5 mM L-cysteine, and excess dye was removed by size-exclusion chromatography on a Superdex 200 Increase 10/300 column equilibrated with 20 mM HEPES, pH 7.4, 150 mM NaCl, 0.01% LMNG and 0.001% CHS. Labelled dimers were reconstituted into liposomes containing POPC, 1-palmitoyl-2-oleoyl-sn-glycero-3-phosphoethanolamine (Avanti) and cholesterol at a 6:3:1 molar ratio using an established protocol65.
For measurements of TM6 dynamics, double-cysteine mutants N148C on TM4 and L266C on TM6 were introduced. Monomeric receptors were expressed in Expi293 cells and purified using the Sf9 purification procedure. To prepare dimers, Expi293 cells were cotransfected at a 1:1 plasmid ratio with constructs encoding an 8×His-tagged β2ARΔ6 without a Flag tag and a Flag-tagged β2ARΔ6 containing the N148C/L266C mutations.
Heterodimers were isolated by tandem affinity purification. Clarified lysates were first incubated with nickel-chelated Sepharose and washed with buffer containing 20 mM imidazole. Proteins were eluted with 250 mM imidazole, supplemented with 2 mM CaCl2 and purified using anti-Flag M1 resin. This two-step method enriched heterodimers containing the double-cysteine mutations in only one protomer. Fluorophore labeling was performed as described for the single-cysteine dimer samples.
Ensemble FRET measurements
Ensemble Förster resonance energy transfer (FRET) experiments were performed using a Fluoromax 4C spectrofluorometer (Horiba Scientific). Excitation and emission slit widths were set to 5 nm and 3 nm, respectively. Emission spectra were recorded following excitation at 532 nm.
AP-bound β2AR dimers labeled with donor and acceptor fluorophores at the I334C H8 sensor were diluted 1,000-fold into NH buffer containing 0.01% LMNG and no AP to a final concentration of 1 nM. Spectra were collected at 1, 5, 30 and 120 min and at 16 and 24 h after dilution. All spectra were normalized to donor intensity.
To examine the effects of transducer binding, samples were incubated with 100 μM ISO and either (1) 10 μM Gs in the presence of apyrase or (2) 20 μM β-arrestin-1(382), together with V2Rpp and Fab30. Fab30 stabilizes the active V2Rpp-bound conformation of β-arrestin-1. β-arrestin-1(382) and Fab30 were prepared as previously described63. Samples were incubated for 1 h in the dark to reach equilibrium. All experiments were performed in triplicate.
Single-molecule FRET microscopy
smFRET flow chambers were assembled using mPEG-passivated glass coverslips (VWR) containing biotin-PEG16 (Laysan Bio), as previously described38,39. Coverslips were incubated with 1 mg ml−1 NeutrAvidin (Thermo Fisher Scientific), followed by 10 nM biotinylated anti-Flag M1 Fab. Labelled β2AR samples were diluted to 100–500 pM in NH buffer containing 2 mM CaCl2 and added to the chambers. After the desired surface density was reached, unbound receptor was removed by washing with imaging buffer containing 100 μM cyclooctatetraene (Sigma-Aldrich) and an oxygen-scavenging system consisting of 1% D-glucose, 1 mg ml−1 glucose oxidase and 0.04 mg ml−1 catalase.
Fluorescence imaging was conducted on a custom-built, objective-based total internal reflection fluorescence microscope as previously reported66. The system used a Zeiss Axiovert S100 TV platform with a ×100, 1.45-NA oil-immersion objective. Donor and acceptor fluorophores were excited with 532 nm and 637 nm lasers (OBIS LS 150 mW and LX 140 mW, Coherent). Emissions were separated with a 652 nm dichroic beamsplitter (Semrock), filtered using 580/60 nm and 731/137 nm band-pass filters and split with an OptoSplit II beamsplitter (Cairn Research) onto an EMCCD camera (iXon DU897E, Andor).
Data acquisition was controlled with μManager and custom BeanShell scripts. Videos were recorded as stacked TIFF files in frame-transfer mode with a 100 ms exposure per frame. Laser power was adjusted to balance signal-to-noise ratio and photobleaching over tens of seconds. Each slide typically produced 10–20 videos per channel. All imaging was performed at room temperature.
Fluorescence traces were analysed with custom Python scripts. Donor and acceptor channels were aligned using registration images, and individual molecules were identified as local intensity maxima within a five-pixel neighbourhood. Donor-only spots were excluded. For each fluorophore pair, intensities were corrected for background using a local circular region with a 35-pixel diameter. Donor leakage into the acceptor channel, approximately 7%, was subtracted.
Donor excitation was used to monitor emission for 80 s, followed by direct acceptor excitation for 1 s to confirm fluorophore identity. Traces were retained when they met the following criteria: (1) signal-to-noise ratio ≥5; (2) single-step acceptor photobleaching before donor photobleaching; (3) γ factor between 0.5 and 2.5; (4) anticorrelated donor and acceptor intensity fluctuations; and (5) single-step donor photobleaching, when present.
FRET efficiency (E) was calculated as E = Ia/(Ia + γId), where Ia and Id represent background-corrected acceptor and donor intensities. γ-correction was applied as previously described. FRET values were divided into 30 bins spanning [–0.25, 1.25] and normalized to the total number of data points in each trace. Ensemble FRET histograms were generated by averaging normalized single-molecule histograms and fitting them with a two-Gaussian distribution model.
Sample preparation for DEER spectroscopy
For double electron–electron resonance (DEER) measurements, β2ARΔ6-N148C/L266C was expressed and purified in Sf9 cells as described above. Detergent was exchanged from 0.1% DDM/0.01% CHS to 0.01% (w/v) LMNG/0.001% CHS by extensively washing the receptor with a progressive DDM:LMNG buffer gradient.
While the receptor remained bound to the affinity resin, alprenolol was removed by washing with saturating concentrations of the low-affinity antagonist atenolol. Because atenolol dissociates rapidly from β2AR, subsequent washes with ligand-free buffer produced unliganded receptor for spin labeling.
Flag-eluted receptor was labeled with 3-(2-iodoacetamido)-proxyl in the presence of 100 μM TCEP in buffer containing 20 mM HEPES, pH 7.4, 150 mM NaCl, 0.01% LMNG and 0.001% CHS. A 20-fold molar excess of spin label was added to 10 μM β2ARΔ6 and incubated for 3 h at room temperature. Reactions were quenched with 5 mM L-cysteine. Excess spin label was removed by size-exclusion chromatography on a Superdex 200 10/300 column in SEC buffer containing 20 mM HEPES, pH 7.4, 150 mM NaCl, 0.01% LMNG and 0.001% CHS prepared with D2O.
The labeled receptor was concentrated using a 50 kDa concentrator to more than 25 μM. D8-glycerol was added to 25% (v/v) as a cryoprotectant. Thirteen microlitres of sample were transferred to a borosilicate capillary with dimensions of 1.4 mm inner diameter and 1.7 mm outer diameter (VitroCom) and flash-frozen in liquid nitrogen.
DEER spectroscopy and distance-distribution analysis
DEER measurements were performed at Q-band frequency, approximately 33.68 GHz, as previously described39. Experiments used a Bruker Elexsys 580 spectrometer equipped with a SpinJet arbitrary waveform generator, EN5107D2 resonator, variable-temperature cryogen-free cooling system (ColdEdge Technologies) and 300 W travelling-wave tube amplifier (Applied Systems Engineering). All measurements were collected at 50 K.
Dipolar evolution data were acquired with a dead-time-free four-pulse DEER sequence using Gaussian pulses67 and 16-step phase cycling. The experimental parameters were as follows: π/2, πobs and πpump pulse lengths, 40 ns; frequency offset (Δv), 90 MHz; d1, 250 ns; d2, 5,150 ns; shot repetition time, 2,000 μs; shots per point, 4; and integration window, 40 ns.
Optimal microwave power for the π/2, πobs and πpump pulses was determined using transient nutation experiments, adjusting pulse amplitudes to maximize Hahn-echo inversion68. Pump pulses were applied at the maximum intensity of the field-swept echo-detected absorption spectrum. Observe pulses were applied 90 MHz below the pump frequency.
DEER data were processed using DeerAnalysis 202269, which incorporates neural-network analysis with DEERNet70 (Spinach revision 5662) and Tikhonov regularization with DeerLab v.0.9.171. Consensus fits represent the mean of both methods. Reported 95% confidence intervals include uncertainties from both analyses. Time traces were normalized to the signal intensity at t = 0, and distance distributions were area-normalized. Custom Python scripts were used to plot dipolar evolution traces and distance distributions.
Reporting summary
Additional information about the research design, experimental procedures and reporting standards is available in the Nature Portfolio Reporting Summary linked to this article.
Source: www.nature.com