


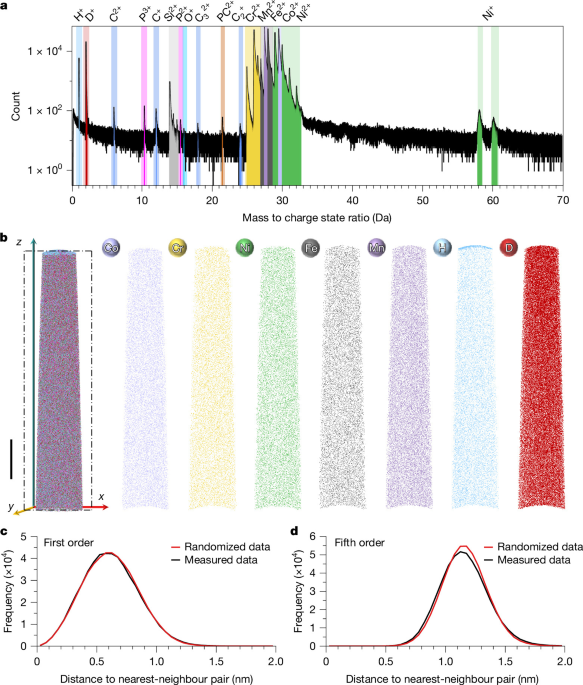
The study combined controlled alloy processing, electron microscopy, cryogenic atom probe tomography, thermal desorption spectroscopy, density functional theory and defect-sensitive measurements to investigate hydrogen and deuterium behaviour in several metallic systems. The materials included CoCrNiFeMn and CoCrNi-based high-entropy alloys, a CoNiV alloy and additively manufactured Inconel 718, with particular attention to deuterium partitioning in L12 precipitates, hydrogen trapping and the role of vacancies and other defects.
Materials and heat treatments
CoCrNiFeMn high-entropy alloy
A CoCrNiFeMn high-entropy alloy ingot was produced by vacuum arc melting pure elements with purities above 99.95 wt.% under argon after the chamber pressure had reached 3.3 Pa. The ingot was melted at least four times to promote compositional uniformity. It was then homogenized at 1,200 °C for 24 h, cold-rolled from 10 mm to 1 mm, corresponding to a 90% reduction in thickness, and annealed at 950 °C for 4 h.
(CoCrNi)94Al3Ti3 alloy
A sample with a nominal composition of (CoCrNi)94Al3Ti3 (at.%) was prepared by vacuum arc melting high-purity metals with purities of at least 99.9 wt.% under argon. The material was melted five times to reduce segregation and improve compositional uniformity before being cast into a round ingot 50 mm in diameter.
The as-cast alloy was homogenized at 1,200 °C for 3 h and cold-rolled to reduce its thickness by 50%. Two microstructures were subsequently produced. Heating at 1,000 °C for 1 h generated a precipitate-free, solution-treated condition. A second treatment at 800 °C for 5 h produced a precipitated condition. All heat-treated samples were water-quenched.
CoNiV alloy
The CoNiV alloy was synthesized by vacuum arc melting under 99.99% pure argon after the pressure had been reduced to 3.3 Pa. The ingots were remelted five times to ensure compositional homogeneity, then hot-forged at 1,200 °C into rectangular slabs 5 mm thick and 20 mm wide. After homogenization at 1,200 °C for 3 h, the alloy was cold-rolled to achieve a total thickness reduction of 50%. The sheets were finally solution-annealed at 1,000 °C for 1 h.
Inconel 718
The Inconel 718 nickel-based superalloy had a composition of 54.72Ni–18.60Fe–18.70Cr–4.24Nb–2.62Mo–0.80Ti–0.27Al–0.05C by weight, equivalent to 53.93Ni–19.26Fe–20.80Cr–2.64Nb–1.58Mo–0.97Ti–0.58Al–0.24C in atomic percent.
Cylindrical samples 15 mm in diameter and 70 mm long were fabricated using an EOS M 400 commercial selective laser melting system. The feedstock powder had an average particle size of 30 ± 11 µm. Printing used a 67° scan rotation, a laser power of 340 W, a scanning speed of 1,100 mm s−1 and a layer thickness of approximately 50 µm.
The printed samples were homogenized at 1,100 °C for 1 h and water-quenched to room temperature. They then underwent two-step ageing: 720 °C for 1 h, followed by furnace cooling to 620 °C and holding for 8 h before final air cooling. D022 γ″-type precipitates formed during the 720 °C treatment, while L12 γ′-type precipitates formed during the 620 °C treatment.
Electron microscopy
For electron backscatter diffraction (EBSD), samples were first polished with 5000-grit SiC paper, then with diamond paste for 3 min. Final preparation used electrolytic polishing in a 1:9 solution of HClO4 and C2H5OH at 243 K for 20 s under a direct-current voltage of 25 V.
Pre-thinned transmission electron microscopy (TEM) foils, 50–60 µm thick, were prepared by double-jet electropolishing at 243 K in methanol containing 10 volume percent HClO4.
EBSD maps were acquired with a Symmetry S2 detector from Oxford Instruments. TEM imaging used a JEM-2100F microscope from JEOL. High-resolution scanning TEM imaging was performed with an FEI Themis microscope equipped with an energy-dispersive X-ray spectroscopy detector. Atomic-resolution chemical maps were obtained using four in-column Super-X silicon drift detectors.
Atom probe tomography
Atom probe tomography (APT) specimens were initially cut into matchstick-shaped bars measuring 1 × 1 × 13 mm3 and polished with 800-grit sandpaper. Coarse electropolishing used 25% perchloric acid in glacial acetic acid at 15–30 V to form needle-like specimens. Fine electropolishing then used 2% perchloric acid in ethylene glycol butyl ether at 10–25 V. This step used a platinum-wire ring cathode and was monitored with a 40× optical microscope. A neck was formed until the upper portion detached, producing a sharp tip.
Before deuterium charging, the tips were sharpened by focused ion beam (FIB) milling to meet APT sharpness requirements. A LEAP 4000X instrument from CAMECA was operated in voltage-pulsing mode with a 0.2% detection rate, a pulse frequency of 200 kHz, a 20% pulse fraction and a specimen temperature of 50 K. Data were processed using CAMECA AP Suite version 6.1.
For the CoCrNiFeMn alloy and Inconel 718, the image compression and k factors used for reconstruction were 1.3 and 3.3, respectively. For the (CoCrNi)94Al3Ti3 alloy, the corresponding values were 1.5 and 3.3. These parameters followed standard APT reconstruction procedures. For datasets containing precipitates, they were further refined by comparison with precipitate morphologies independently observed by TEM.
Peak ranging considered the complete isotopic distributions of the principal alloying elements and possible molecular ions. Bulk composition analyses are provided in Supplementary Tables 2–4. A peak-free region near 2.5 Da was treated as noise and used to estimate the local low-mass background adjacent to the 2-Da signal. Three representative mass spectra are shown in Supplementary Fig. 8, while Supplementary Table 5 summarizes all eight successful cryo-APT datasets obtained from 68 trials.
Because D+ and H2+ overlap at 2 Da and cannot be directly resolved, the overlap was treated as a separate systematic uncertainty. It was assessed using uncharged reference specimens analysed under identical voltage-pulsing conditions. Reconstruction sensitivity was also tested by reconstructing the dataset shown in Fig. 3 with an alternative image compression factor of 1.3. This did not change the observed preferential deuterium enrichment within the L12 precipitate, as shown in Supplementary Fig. 9.
Electrolytic deuterium charging
A solution of 0.1 M NaOH in D2O supplied by Sigma-Aldrich was used to create a deuterium-rich environment around specimens acting as the cathode in an electrolytic circuit. A gold counter-electrode was used. Charging took place in a custom cryogenic-transfer glovebox from M. BRAUN Inertgas-Systeme.
Four sharp specimens were mounted in a four-needle atom probe puck insulated with polyether ether ketone. The tips extended from the puck to the same height and were immersed in the charging solution only to a depth that was barely visible; their immersion was identified by the capillary of the liquid. Deuterium charging was performed at 1.6 V for 90 s using a Keysight 2901A power supply. The entire puck was then immediately immersed in liquid nitrogen.
Cryogenic transfer and cryo-FIB preparation
After deuterium charging and quenching in liquid nitrogen, specimens used for Figs. 3 and 4 were transferred from the glovebox to a Hydra plasma focused ion beam system from Thermo Fisher Scientific equipped with a cryogenic stage. A Ferrovac cryogenic sample carrier was used during transfer.
Tip sharpening was completed at approximately −190 °C. Annular milling used two ion-beam conditions, 30 kV at 0.1 nA and 30 kV at 30 pA, to remove ice and refine and smooth the tips. A final 5 kV, 50 pA polishing step was applied for 10 s to remove a potentially ion-damaged surface layer. The prepared APT specimens were transferred from the PFIB system to the APT instrument in a cryogenic transfer suitcase.
Thermal desorption spectroscopy
Samples for thermal desorption spectroscopy (TDS) measured 1 × 8 × 10 mm3 and were polished with 5000-grit SiC paper. They were charged for 72 h at a constant current density of 20 mA cm−2 in a solution containing 0.5 M H2SO4 and 2 g l−1 CH4N2S.
TDS measurements were performed with a JTF-20A mass spectrometer at heating rates of 100 °C h−1, 200 °C h−1 and 300 °C h−1.
Density functional theory calculations
All density functional theory (DFT) calculations used the projector augmented-wave method, as implemented in the Vienna Ab initio Simulation Package (VASP). Exchange-correlation effects were described with the generalized gradient approximation using the Perdew–Burke–Ernzerhof functional. Chemical disorder was modelled with the special quasirandom structure (SQS) method through the Alloy Theoretic Automated Toolkit (ATAT).
The plane-wave cut-off energy was 450 eV, and the Brillouin zones were sampled using a gamma-centred Monkhorst–Pack grid. The Methfessel–Paxton method was applied with a smearing width of 0.1 eV. Supercell sizes and atomic positions were relaxed until the Hellmann–Feynman forces were below 0.01 eV Å−1. Energy and force convergence criteria were 1.0 × 10⁻⁵ eV per atom and 0.02 eV Å−1, respectively.
The calculations examined CoCrNiFeMn, CoCrNi, L12 Ni3(Al, Ti), pure Ni, Ni2FeCr as a model matrix for Inconel 718, and D022 Ni3Nb precipitates. CoCrNiFeMn, CoCrNi, L12 Ni3(Al, Ti), Ni and Ni2FeCr were treated as face-centred cubic structures. D022 Ni3Nb was treated as a tetragonal structure with space group I4/mmm, number 139. In this structure, Ni occupies the 4d (0, 1/2, 1/4) and 2b (0, 0, 1/2) sites, while Nb occupies the 2a (0, 0, 0) sites.
SQS structures were used for the disordered CoCrNiFeMn, CoCrNi, L12 Ni3(Al, Ti) and Ni2FeCr phases. CoCrNi, Ni2FeCr, L12 Ni3(Al, Ti) and Ni were modelled with 108 atoms in 3 × 3 × 3 supercells according to their compositions. In the L12 structure, all Ni atoms occupied face-centred sites. CoCrNiFeMn used a 5 × 3 × 2 supercell containing 120 atoms, while D022 Ni3Nb used a 2 × 2 × 1 supercell containing 36 atoms.
The CoCrNi (1̄1̄1)/L12 Ni3(Al, Ti) (1̄1̄1) interface was constructed from experimental data. More than three SQS configurations were evaluated for each bulk and interface structure for comparison.
Hydrogen solution energies
The initial DFT analysis considered octahedral and tetrahedral interstitial sites. The solution energy of a hydrogen atom at a trapping site was calculated as:
Es = Etrap+H − Etrap − 1/2EH2.
Here, Etrap+H and Etrap are the total energies of the system with and without an interstitial hydrogen atom, respectively, and 1/2EH2 is half the energy of an H2 molecule. Because interstitial sites in multi-principal-element alloys have chemically heterogeneous environments, more than 20 randomly selected sites were sampled in each bulk phase. Ten randomly selected sites of both octahedral and tetrahedral types were sampled at each interface.
Vacancy formation energies
Additional calculations examined vacancy formation in CoCrNi, L12 Ni3(Al, Ti) and D022 Ni3Nb, which were selected as representative phases reflecting general energetic characteristics. Vacancies were created by removing atoms from perfect supercells. The vacancy formation energy was calculated as:
EVf = EV − Ebulk + μi.
In this expression, EV and Ebulk are the energies of the defective and defect-free supercells, respectively, and μi is the chemical potential of the removed atom. For CoCrNi, the chemical potentials were calculated using a Widom-type substitution technique. Forty substituted structures were calculated to determine μi for each element. For L12 Ni3(Al, Ti) and D022 Ni3Nb, μi was the total energy of the relevant element in its ground state.
Zero-point, entropy and isotope corrections
Because quantum-mechanical particles retain non-zero residual energy even at 0 K, zero-point energy (ZPE) and entropy corrections were applied to hydrogen solution energies in CoCrNi, L12 Ni3(Al, Ti) and D022 Ni3Nb. The Gibbs free energy of hydrogen dissolution was calculated as:
ΔGs = Es + ΔEZPE − TΔS.
Here, Es is the calculated solution energy, ΔEZPE is the difference in ZPE between hydrogen in the dissolved state and in the gas phase, and ΔS is the entropy difference between dissolved hydrogen and hydrogen gas at standard conditions of atmospheric pressure and 298 K.
The calculated ZPE of diatomic H2 gas was 0.269 eV, consistent with previous studies. Supplementary Fig. 10 compares results with and without ZPE and entropy corrections. ZPE slightly increased the energy, with a marginally larger increase for tetrahedral than octahedral sites in CoCrNi and Ni3(Al, Ti). Entropy corrections increased the energy further in all three alloys, but neither correction had a notable effect on the energy comparison.
Isotope effects were also examined by replacing H with D in CoCrNi, L12 Ni3(Al, Ti) and D022 Ni3Nb. The substitution had a negligible effect on solution energies. ZPE correction slightly increased the energy, as it did for H, but the overall energy trends were insensitive to isotope effects.
Hydrogen and deuterium diffusion within the three phases was studied with the climbing-image nudged elastic band method. As shown in Extended Data Fig. 10, the H and D diffusion barriers were similar. Applying the corrections shifted the saddle points of the diffusion curves slightly upward, with only minor differences between H and D. The overall energetic trend remained unchanged.
Quasi-in situ TEM during electrochemical deuterium charging
Electropolished TEM foils of aged (CoCrNi)94Al3Ti3 were used for quasi-in situ deuterium-charging experiments. Before charging, regions containing L12 precipitates were identified and characterized by bright-field TEM, high-angle annular dark-field scanning TEM, selected-area electron diffraction (SAED) and high-resolution TEM.
The specimen was then electrochemically charged in 0.1 M NaOH prepared with D2O, using a gold anode. The charging time was 1.5 min, with the same charging conditions used for the cryogenic APT experiments. After charging, the specimen was removed from the electrolyte, dried and examined again by TEM. The same regions and individual precipitates were relocated and compared with their pre-charging states. SAED and high-resolution TEM were used after charging to determine whether deuterium introduced crystalline defects such as stacking faults, dislocations or other lattice defects.
Ion irradiation and positron annihilation spectroscopy
Ion irradiation was carried out at Peking University using a NEC 2 × 1.7 MV tandem accelerator. A (CoCrNi)94Al3Ti3 specimen measuring 10 × 10 × 0.9 mm3 was irradiated with 3 MeV Ni2+ ions to a fluence of 1.5 × 10¹⁶ ions cm−2 at 500 °C. SRIM-2013 calculations using the quick Kinchin–Pease model gave a peak damage level of approximately 16 displacements per atom.
The displacement threshold energies used in the SRIM calculations were 40 eV for Co, Cr, Ni and Ti and 25 eV for Al. To limit oxidation and other surface contamination during high-temperature irradiation, the target chamber was evacuated to below 1 × 10⁻⁴ Pa before heating and irradiation. The specimen remained under vacuum while cooling and was removed only after its temperature fell below 50 °C.
Positron annihilation lifetime spectroscopy using a 22Na positron source supplemented Doppler-broadening measurements and was used to assess vacancy-type defects in the alloys listed in Supplementary Table 1. Vacancy-type defects produced by hydrogen charging under the same conditions as the cryogenic APT experiments, and by ion irradiation, were characterized with Doppler-broadening positron annihilation spectroscopy using a slow positron beam at the Institute of High Energy Physics, Chinese Academy of Sciences.
The 22Na source generated a positron beam approximately 0.55 cm in diameter. To reduce specimen-to-specimen variation, measurements were made sequentially on the same specimen in its pristine condition, after electrochemical hydrogen charging and after subsequent Ni-ion irradiation. Incident positron energies ranged from 0.5 to 25.0 keV, corresponding to mean implantation depths of approximately 1.5–804.0 nm. These depths corresponded to the irradiated region spanning approximately 5.8–15.3 dpa and were estimated using:
Z = (40/ρ)E1.6.
Here, Z is the mean positron implantation depth in nanometres, ρ is the target mass density in g cm−3, and E is the incident positron energy in keV. A density of 8.58 g cm−3 was used for the (CoCrNi)94Al3Ti3 alloy.
Positron-annihilation γ-ray spectra were recorded with a high-purity germanium detector. More than 4.5 × 10⁵ counts were accumulated for each spectrum within the 499.5–522.5 keV annihilation peak. Doppler-broadening spectra were analysed using the S and W parameters. S represents annihilation with low-momentum valence electrons, while W represents annihilation with high-momentum core electrons.
The annihilation peak was integrated over 499.5–522.5 keV. The S parameter was the ratio of counts in the central 510.2–511.8 keV window to the total counts in the annihilation peak. The W parameter was the ratio of counts in the high-momentum wing regions at 505.1–508.4 keV and 513.6–516.9 keV to the total peak counts. An increase in S together with a decrease in W indicates stronger positron trapping at vacancy-type open-volume defects.
Source: www.nature.com