


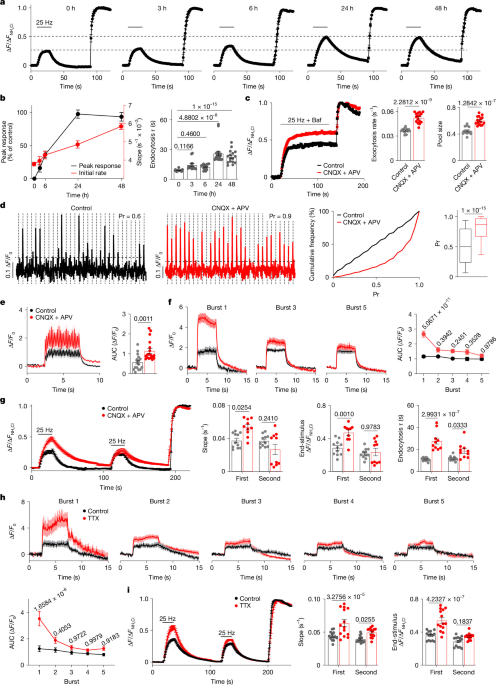
The study used genetically modified mice, cultured neurons, molecular constructs, live-cell fluorescence imaging, biochemical assays, brain-slice electrophysiology and immunofluorescence to investigate synaptic vesicle proteins and calcium-dependent neurotransmitter release. Experiments were conducted under protocols approved by the University of California, San Francisco (UCSF) Institutional Animal Care and Use Committee (IACUC), with analyses performed using established imaging, electrophysiological and statistical methods.
Animals and antibodies
Mice
C57BL6/J mice (strain 000664), Atp8a1-KO mice (strain 006433) and Ap3d1 mocha mice (strain 000279) were purchased from The Jackson Laboratory. AP-3-deficient mocha mice were also maintained in the laboratory. Vamp7-KO mice were obtained from the RIKEN Bioresource Center (strain RBRC01926). All mouse lines were maintained as heterozygous breeder pairs. The sex of pups used for cultures was not determined, and mice of both sexes were included in all experiments.
Mice were housed under standard laboratory conditions with unlimited access to food and water, 12-h light–dark cycles, an ambient temperature of approximately 25.5 °C and 40–60% humidity. Animal housing, breeding and experimental procedures followed the National Institutes of Health (NIH) Guide for the Care and Use of Experimental Animals and were approved by the UCSF IACUC under protocol AN202379.
Antibodies
Synaptic Systems supplied antibodies against VAMP7 (158.2 mouse monoclonal, 1:500, 232011), VAMP2 (rabbit monoclonal, 1:1,000, 104008), syntaxin 1 (mouse monoclonal, 1:2,000, 110011), SNAP25 (mouse monoclonal, 1:2,000, 111011), synaptotagmin 1 (mouse monoclonal, 1:1,000, 105011), VGLUT1 (mouse monoclonal, 1:1,000, 135011), VGLUT2 (mouse monoclonal, 1:1,000, 135421), synaptophysin (mouse monoclonal, 1:2,000, 101011; rabbit monoclonal, 1:1,000, 101008), P/Q-type α-1A (rabbit polyclonal, 1:500, 152103), N-type α-1B (rabbit polyclonal, 1:500, 152313) and Piccolo (chicken polyclonal, 1:2,000, 142116).
Cell Signaling supplied rabbit monoclonal antibodies against GFP (D5.1, 1:500, 2956) and FOS (9F6, Alexa Fluor 647 conjugate, 1:500, 14188). Other primary antibodies were β-actin mouse monoclonal antibody from Thermo Fisher Scientific (1:2,000, MA1-140), anti-dihydropyridine receptor α2 subunit monoclonal antibody from Sigma-Aldrich (1:1,000, D219) and HA.11 mouse monoclonal antibody from BioLegend (1:1,000, 901513).
Invitrogen supplied Alexa Fluor 488 goat anti-mouse antibody (1:400, A-11001), Alexa Fluor 555 goat anti-rabbit antibody (1:400, A-21428) and Alexa Fluor 647 goat anti-chicken antibody (1:400, A-21449).
Molecular biology and lentivirus production
Plasmids encoding VGLUT1–pH, VGLUT2–pH, VAMP2–pH and VAMP7–pH had been reported previously (59,60,61). For synaptic expression, iGluSnFR (Addgene, 98929) was fused at its C terminus to the C-terminal domain of Stargazin and subcloned into a lentiviral vector controlled by the human synapsin promoter.
The VAMP7–pH M140A mutation and the VAMP2–pH M46A mutation were generated by overlap-extension PCR. VAMP7 longin-domain deletion mutants lacking amino acids 1–101 and linker deletion mutants lacking amino acids 102–121 were amplified with 5′ XbaI and 3′ HapI sites and inserted into a modified FUGW vector by ligase-independent cloning using the ClonExpress II One Step Cloning Kit (C112, Vazyme). pHluorin-tagged VAMP7 chimeras containing SNARE-1 or SNARE-2 were synthesized by Twist Bioscience and inserted into FUGW.
The VAMP7 longin domain was fused to VAMP2–pH by PCR amplification and insertion into FUGW using the ClonExpress MultiS One Step Cloning Kit (C113, Vazyme). Additional constructs replaced the VAMP2 linker with the VAMP7 linker (amino acids 102–121), or the VAMP7 linker with the VAMP2 linker. Untagged WT VAMP7, VAMP7(M140A), VAMP7(ΔLD), VAMP7(SNARE), VAMP7(VAMP2-linker) and VAMP2(VAMP7-linker) were amplified with 5′ AgeI and 3′ NheI sites and subcloned into the FU-IRES2-mCherry lentiviral vector.
Mouse SNAP25 and the codon-optimized light chain of BoNT/A were synthesized by Twist Bioscience. SNAP25 was inserted into FUGW using 5′ XbaI and 3′ HapI sites, while BoNT/A was inserted into FU-IRES2-mCherry using 5′ AgeI and 3′ NheI sites. Addgene supplied the TeNT light-chain construct pFsynW-TeTx-LC (197284), the calcium-channel constructs pCAGGS-Cav2.1-HA (206076), pCAGGS-CACNα2δ1 (206104) and pcDNA3.1-Cavβ3 (26574), and the syntaxin construct Stx1a-12aa-mCer (53236).
HA-tagged syntaxin 1A was amplified with a 5′ AgeI site containing the HA tag and a 3′ NheI site, then inserted into FU-IRES2-mCherry. For Cav2.1, the HA tag was removed and 5 bp were added to the C terminus to restore the missing stop codon in the Addgene construct. A Twin-Strep tag was added to the Cav2.1 N terminus by PCR. All constructs were sequenced to confirm the intended changes and exclude off-target mutations. Primer and synthesized-DNA sequences are provided in Supplementary Table 1.
Lentivirus production
HEK293T cells were obtained from ATCC (CRL-3216) and were not independently authenticated. Cultures were tested and confirmed negative for mycoplasma contamination. Low-passage cells were plated on poly-l-lysine-coated six-well plates. The third-generation pFUGW lentiviral vector containing the gene of interest (1.5 μg) was mixed with pMDLG/pRRE, pIVS-VSVG and pRSV-Rev accessory plasmids (0.5 μg each) and 12 μl FuGene HD transfection reagent (Promega) in 200 μl Opti-MEM. The mixture was incubated for 15 min at room temperature and added to the cells overnight.
The following morning, the medium was replaced with 2 ml fresh culture medium and collected after 48 h. Debris was removed by sedimentation at 1,000g. Viral supernatant was used immediately or aliquoted and frozen at −80 °C. Hippocampal cultures were infected with 35 μl of supernatant per coverslip. For cortical neurons, supernatant was concentrated overnight with Lenti-X concentrator at a 1:3 volume-to-volume ratio (TaKaRa, 631231), centrifuged at 1,500g for 45 min at 4 °C, resuspended in PBS and frozen at −80 °C.
Primary neuron cultures
As previously described,3 the hippocampus and cortex were dissected from postnatal day (P) 0–P1 mouse pups and dissociated in Hank’s balanced salt solution containing 10 mM HEPES and 20 mM glucose. Hippocampal tissue was digested in 0.25% trypsin at 37 °C for 15 min, and cortical tissue for 20 min, followed by three washes in HBSS.
Cells were gently triturated and plated on poly-l-lysine-coated coverslips at 400 cells per mm2 in minimal essential medium containing B27 (Gibco, 17504-044), 2 mM GlutaMAX (Gibco, 35050-061), 5% fetal bovine serum (Defined, HyClone) and 21 mM glucose (Sigma, G8769). On day in vitro 1 (DIV1), three-quarters of the medium was replaced with neurobasal medium (Gibco, 21103-049) containing B27 and 2.6 mM GlutaMAX. Lentiviral infection was performed at DIV7, and cells were used for imaging or biochemical analysis at DIV14–DIV15.
Live-cell imaging
Hippocampal cultures at DIV14–DIV15 were mounted in a laminar-flow perfusion and stimulation chamber (Warner Instruments) on an inverted Nikon TE300 fluorescence microscope with a 60× water-immersion objective. Cells were illuminated by a Xenon lamp with 470/40-nm excitation and 525/50-nm emission filters. Field stimulation used platinum–iridium electrodes delivering 1-ms bipolar current pulses that generated electric fields of 10 V cm−1.
Cells were continuously perfused with Tyrode’s solution containing, in mM, 119 NaCl, 2.5 KCl, 2 CaCl2, 2 MgCl2, 30 glucose and 25 HEPES (pH 7.4), supplemented with 10 μM CNQX and 50 μM APV to block AMPA and NMDA receptors. Surface pHluorin fluorescence was quenched with MES solution containing 119 NaCl, 2.5 KCl, 2 MgCl2, 2 CaCl2, 30 glucose and 25 MES (pH 5.5). Total cellular pHluorin was revealed with Tyrode’s solution containing 50 mM NH4Cl and 69 mM NaCl.
Neuronal activity was silenced by incubation in culture medium containing 10 μM CNQX and 50 μM APV, or 1 μM TTX (Cayman Chemical, 14964). To block reacidification after endocytosis, neurons were incubated in Tyrode’s solution containing 100 nM bafilomycin A1 (Cayman Chemical, 11038) for 30 s before stimulation.
For calcium imaging, neurons were loaded with 2.5 μM Fluo5F-AM in 0.05% dimethyl sulfoxide (DMSO; Thermo Fisher Scientific, F14222) for 15 min at 37 °C in 5% CO2. Calcium-channel blockers were applied for 30 min at 37 °C in 5% CO2: 300 nM ω-agatoxin IVA (Tocris, 2799), 1 μM ω-conotoxin GVIA (Tocris, 2085), 100 nM SNX-482 (Abcam, ab120259) or 10 μM nimodipine (Abcam, ab120135). Vehicles were water for agatoxin and conotoxin, 0.01% DMSO for nimodipine and 0.02% DMSO for SNX-482.
To test the roles of VAMP2, SNAP25 and syntaxin 1 in calcium entry, lentiviruses encoding the catalytic light chains of TeNT or BoNT/A were added at DIV7 and cells were imaged at DIV14. BoNT/C toxin complex was obtained from Metabiologics (300), and neurons were incubated overnight with different concentrations before imaging.
For glutamate-release experiments, hippocampal neurons expressing iGluSnFR were stimulated at 0.2 Hz. Synapses were identified either by loading neurons with FM4-64 through stimulation at 10 Hz for 60 s, followed by 10 min of washing, or by lentiviral expression of BFP-tagged synaptophysin. Images were acquired at 1 Hz for pHluorin imaging and at 20 Hz for Fluo5F and iGluSnFR imaging using a QuantEM CCD camera (Photometrics). Imaging was performed at 35 °C using a dual automatic temperature controller (TC-344B, Warner Instruments), with acquisition and data collection managed by MetaMorph v.7.8.10.0 (Molecular Devices).
Synaptosome and synaptic-vesicle preparation
One whole brain from a 6–8-week-old mouse was homogenized in 10 ml ice-cold buffer containing 300 mM sucrose, 1 mM MgEGTA and 10 mM HEPES-Tris (pH 7.4), supplemented with cOmplete protease inhibitors (Roche). The tissue was disrupted with nine strokes at 900 rpm using a Teflon homogenizer. The homogenate was centrifuged at 871g for 10 min at 4 °C in an SS34 rotor (Sorvall). The supernatant (S1) was centrifuged at 12,000g for 15 min at 4 °C, and the synaptosome-enriched pellet (P2) was resuspended in 10 ml homogenization buffer and washed once at 14,500g for 15 min at 4 °C.
For synaptic-vesicle preparation, pellet P2′ was resuspended in 1.2 ml homogenization buffer and osmotically lysed for 45 min in 13.5 ml cold water containing 8 mM HEPES-Tris (pH 7.4). The lysed material was disrupted with five strokes at 3,000 rpm and centrifuged at 32,500g for 20 min. The supernatant (LS1) was then centrifuged at 280,000g for 2 h in a Beckman Type 70 Ti rotor. The final pellet (LP2) was gently resuspended by repeated pipetting.
Immunoprecipitation
For Cav2.1 immunoprecipitation, P2′ was resuspended in 1 ml lysis buffer containing 100 mM NaCl, 5 mM EDTA, 50 mM HEPES (pH 7.4), 1% Triton X-100 and protease inhibitors. The suspension was rotated at 4 °C for 2 h and then at room temperature for 15 min. After centrifugation at 16,000g for 10 min, the supernatant was incubated with 5 μg Cav2.1 antibody for 2 h at 4 °C, followed by 30 μl Dynabeads Protein A (Thermo Fisher Scientific, 10001D) for 1 h. Beads were washed four times and bound proteins were released in 1× SDS sample buffer (NEB, B7703S).
HEK293 cells or primary cortical neurons grown in 10-cm dishes were washed with PBS and lysed for 2 h at 4 °C in 1 ml buffer containing 1% DDM, 0.1% CHS, 100 mM NaCl, 2 mM EDTA and 50 mM HEPES (pH 7.4), supplemented with protease inhibitors. Lysates were centrifuged at 16,000g for 10 min. Supernatants were incubated with 40 μl Strep-Tactin XT magnetic beads (IBA Lifesciences, 21613002) or 20 μl GFP-Trap Magnetic Particles M-270 (Proteintech, gtd) for 2 h at 4 °C. Beads were washed four times, and bound proteins were released in 1× SDS sample buffer before SDS–PAGE.
Western analysis
Proteins and blue prestained standards (Bio-Rad, 1610373) were separated on 4–20% precast SDS–polyacrylamide gels (Bio-Rad, 5671095) and transferred to nitrocellulose membranes. Membranes were blocked for 30 min at room temperature in TBS-T containing 5% non-fat dry milk. Primary antibodies were incubated for 1.5 h at room temperature in TBS-T containing 1% non-fat dry milk.
After three washes, membranes were incubated for 1 h with IRDye 800CW goat anti-mouse IgG (1:10,000, 926-32210) and IRDye 680RD goat anti-rabbit IgG (1:20,000, 926-68071), supplied by LI-COR Biosciences. Blots were washed three more times and visualized using a LI-COR Odyssey system, version 2.0.3.
Slice electrophysiology
As previously described,3 P21–P25 mice were anaesthetized by intraperitoneal ketamine and xylazine and transcardially perfused with ice-cold cutting artificial cerebrospinal fluid (aCSF). The solution contained, in mM, 2.5 KCl, 0.5 CaCl2, 7 MgSO4, 1.25 NaH2PO4, 25 NaHCO3, 7 d-glucose, 210 sucrose and 1.3 ascorbic acid; it was 305–310 mOsm, pH 7.4, and saturated with 95% O2/5% CO2.
Brains were rapidly removed and sectioned in continuously aerated cutting aCSF using a Leica vibratome. Near-horizontal 300-μm slices were prepared for Schaffer-collateral, mossy-fibre and perforant-path recordings, and sagittal slices for corticothalamic and parallel-fibre recordings. Slices were transferred to recording aCSF containing 119 mM NaCl, 2.5 mM KCl, 2.5 mM CaCl2, 1.3 mM MgSO4, 1 mM NaH2PO4, 26.2 mM NaHCO3 and 11 mM d-glucose, or to aCSF containing 1.5 mM CaCl2 and 1 mM MgSO4 for the experiments shown in Extended Data Figs. 7 and 11a. Solutions were 305–310 mOsm, pH 7.4, and saturated with 95% O2/5% CO2. Slices were incubated at 32 °C for 30 min and then kept at room temperature for another 30 min. A cut between CA1 and CA3 prevented recurrent network activity.
Recordings were performed on an upright Olympus BX51WI microscope while slices were perfused at 3 ml per min with oxygenated recording aCSF. Patch electrodes made from borosilicate glass had resistances of 3–5 MΩ and contained, in mM, 135 CsMeSO3, 10 HEPES, 8 NaCl, 0.3 EGTA, 4 Mg-ATP, 0.3 Na-GTP, 5 QX-314 and 0.1 spermine. The solution was 290–295 mOsm, pH 7.4.
Recordings were performed at 34–35 °C, except for experiments at 21–22 °C shown in Extended Data Fig. 11b,c. AMPAR-mediated responses were recorded with 10 μM APV and 100 μM picrotoxin. Initial release probability was assessed from NMDAR-mediated responses in 100 μM picrotoxin, 10 μM DNQX and 50 μM MK-801 after a 10-min bath incubation. To examine presynaptic calcium channels, slices were recorded before treatment, incubated for 30 min with blockers or vehicle, and recorded again.
A tungsten bipolar stimulating electrode (WE3ST30.1A3 SS, MicroProbes) was placed in the stratum radiatum for Schaffer-collateral synapses, the hilus adjacent to the dentate granule-cell layer for mossy-fibre synapses, the outer molecular layer of the hippocampus for perforant-path synapses, the internal capsule for corticothalamic synapses and the cerebellar parallel-fibre synapses. AMPA EPSCs were recorded in whole-cell voltage-clamp mode at −70 mV, and NMDA EPSCs at 40 mV. Amplitudes were measured from the peak response. In CA3 recordings, 10 μM L-AP4 was added for 10 min at the end to confirm mossy-fibre mediation.
Membrane holding current, input resistance and pipette series resistance were monitored throughout. Series resistance was typically 10–20 MΩ; recordings were discarded if it exceeded 30 MΩ. Only recordings with seal resistance above 1 GΩ were included. Data were acquired with a MultiClamp 700B amplifier (Molecular Devices), stored in Igor Pro v.6.3.4.1 (Wavemetrics), digitized at 10 kHz and filtered at 2 kHz.
Immunofluorescence and image acquisition
Primary hippocampal neurons were fixed for 15 min in 4% paraformaldehyde (PFA) in PBS, then permeabilized and blocked for 30 min in PBS containing 0.1% Triton X-100 and 4% normal goat serum (NGS). Primary antibodies were applied for 1.5 h at room temperature in PBS containing 1% NGS and 0.025% Triton X-100. After three 10-min PBS washes, cells were incubated with secondary antibodies for 1 h and washed again. Coverslips were mounted in ProLong Diamond Antifade Mountant (P36961, Invitrogen).
For brain-slice staining, mice were perfused with cold PBS followed by 4% PFA in PBS. Brains were dissected, post-fixed overnight in 4% PFA, and cryoprotected sequentially in 15% and 30% sucrose in PBS. Sagittal sections 35 μm thick were cut with a Leica CM3050S cryostat. Sections were blocked and permeabilized in PBS containing 4% NGS and 0.2% Triton X-100, then incubated overnight at 4 °C with primary antibodies in PBS containing 1% NGS and 0.2% Triton X-100. After three 10-min washes, secondary antibodies were applied for 2 h at room temperature in the dark. Sections were washed, incubated for 5 min in PBS containing 1.5 μM Hoechst 33342 and mounted.
Stained cells were imaged on a Nikon Ti microscope equipped with a CSU-W1 spinning-disk confocal module, Plan Apo 40× or 60× oil-immersion objectives and an Andor Zyla scientific CMOS camera. Super-resolution structured-illumination microscopy images were acquired with a DeltaVision OMX SR microscope (GE Healthcare), a Plan ApoN 60× 1.42 objective (Olympus), 1.516-index immersion oil and three PCO 15-bit CMOS cameras.
Images were acquired with 50-ms exposure, pre-amplifier gain of 1 and variable EM gain. Alexa Fluor 488 was excited at 488 nm and detected with a 528/488-nm emission filter; Alexa Fluor 555 was excited at 568 nm and detected with a 609/37-nm filter; and Alexa Fluor 647 was excited at 642 nm and detected with a 683/40-nm filter. Confocal imaging used Micro-Manager v.2.0-gamma. SIM imaging was controlled with OMX AquireSR software and aligned with SoftWoRx (GE Healthcare). Images were processed and analysed in ImageJ v.1.54g (NIH).
Quantification, statistics and reproducibility
Fluorescence images were analysed in ImageJ as previously described.3 For pHluorin imaging, the Time Series Analyzer plug-in v.3.0 was used. Individual boutons were identified manually from their NH4Cl fluorescence, independently of their stimulation response. Circular regions of interest (ROIs) covering 10 × 10 pixel-intensity areas were placed manually at the centres of fluorescent puncta. Background was estimated from three cell-free regions and subtracted from each trace. Integrated bouton fluorescence was normalized to baseline fluorescence before stimulation and to the maximal unquenched signal in NH4Cl.
For Fluo5F and iGluSnFR imaging, circular 5 × 5 pixel ROIs were used and signals were normalized to baseline. All acquired data were included; no randomization or group allocation was used. Sample sizes were selected to detect 1–2 standard deviations with 80% probability. ROIs were selected blind to the results. Whole-cell recording analysis was not performed blind to genotype or experimental condition, but no recordings were excluded. Curve fitting and quantitative analysis were performed in GraphPad Prism v.11.0.2.
No formal statistical method was used to predetermine sample sizes, although replicate numbers were comparable with previous reports.3,4 Quantification used data from multiple coverslips from at least three independent experimental preparations, as detailed in the Source Data. Statistical analyses were performed in GraphPad Prism. Data generally followed a normal distribution and were analysed using two-tailed unpaired Student’s t-tests or one-way or two-way ANOVA followed by Tukey’s post hoc comparisons. Values are reported as mean ± s.e.m.; n represents either the number of coverslips or recorded cells.
Ethics and reporting
All animal procedures followed the NIH Guide for the Care and Use of Laboratory Animals and were approved by the UCSF IACUC. Additional information about the research design is available in the Nature Portfolio Reporting Summary linked to the article.
Source: www.nature.com