


Mouse Husbandry, Genotypes and Experimental Groups
Mice were maintained under a 12 h:12 h light–dark cycle with unrestricted access to food and water. Housing conditions were maintained at 22 ± 2 °C and 55 ± 10% relative humidity. All procedures complied with the Swiss National Institutional Guidelines on Animal Experimentation and were approved by the cantonal Veterinary Office Committees for Animal Experimentation. Male C57BL6/J mice were used for whole-brain FOS mapping across circadian and sleep-deprivation time points. Both male and female mice were used in all other experiments. Age-matched mice between 2 and 6 months of age were randomly assigned to experimental groups according to genotype. Knock-in and transgenic mouse lines were obtained from the Jackson Laboratory, including the TRAP2 knock-in line (Fos-2A-iCreERT2, strain 030323)40, Ai14 Cre reporter (RCL-tdT, strain 007914), Sert-Cre (Slc6a4tm1(cre)Xz, strain 014554)77, Vgat-IRES-Cre (Slc32a1tm2(cre)Lowl, strain 028862)78 and Vglut2–IRES-Cre (Slc17a6tm2(cre)Lowl, strain 016963)78.
Mouse Sleep Deprivation and Sleep Attempts
Nesting material was removed from each cage at the beginning of the sleep-deprivation period and replaced when deprivation ended. Mice were housed individually during all sleep-deprivation experiments. For grooming-based sleep deprivation, mice were lightly misted with Milli-Q water every 15 min for up to 6 h to induce grooming. Sleep attempts were disrupted by opening the cage door or applying an additional water mist. For novel-object-based sleep deprivation, a new object was introduced into the cage every 15 min for up to 6 h to maintain behavioural engagement. Sleep attempts were interrupted by opening the cage door and moving the object. A sleep attempt was defined as the adoption of a sleep-like posture together with the appearance of NREM-like slow-wave activity in live EEG recordings. These changes reverted to wake-like EEG activity after cage-door opening, water misting or novel-object displacement. Sleep attempts were also identified retrospectively as sleep bouts through automated vigilance-state classification (see Extended Data Fig. 7 and the Methods sections below).
Whole-Brain Immunostaining, Tissue Clearing and Imaging
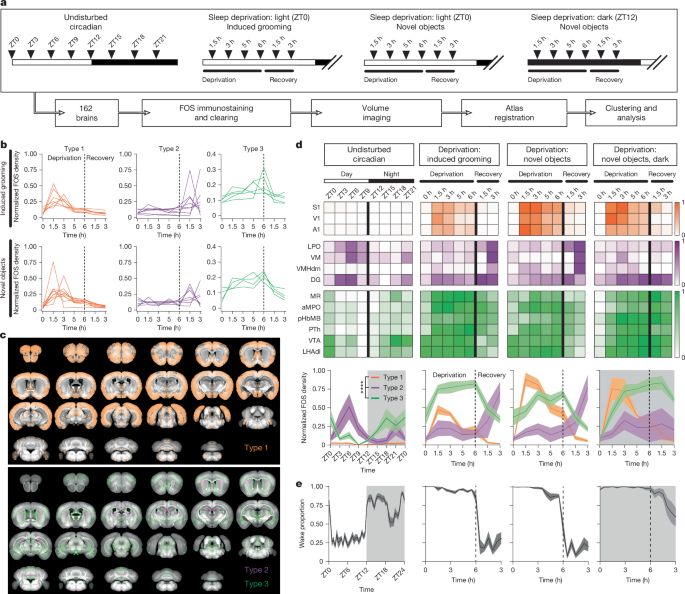
For whole-brain activity-mapping experiments, mice were housed individually and habituated to their home cages for several days. For circadian brain mapping, whole brains were collected at 3-h intervals across an undisturbed light–dark cycle. For sleep-deprivation mapping, brains were collected after 1.5 h, 3 h, 5 h and 6 h of sleep deprivation, as well as after 1.5 h and 3 h of recovery following 6 h of deprivation. Six to seven brains were collected at each circadian and light-phase sleep-deprivation time point, while four brains were collected at each dark-phase sleep-deprivation time point. Samples were immunostained and cleared using the iDISCO79 workflow (https://idisco.info/). Cleared brains were imaged horizontally on a MesoSPIM light-sheet microscope at the Center for Microscopy and Image Analysis, University of Zurich. Imaging was performed using the associated control software (https://github.com/mesoSPIM/mesoSPIM-control) and a Hamamatsu Orca camera with the following settings: 1.25× zoom, 5.0 μm z-step size, 5.26 μm pixel size and 2,048 × 2,048-pixel resolution. Immunostaining used polyclonal rabbit anti-FOS antibody (Synaptic Systems, 226 003; 1:2,000) and donkey anti-rabbit Alexa Fluor 647 (Invitrogen, A31573; 1:800). Autofluorescence in the 561-nm channel was acquired to visualize overall brain morphology.
Whole-Brain FOS Activity Mapping and Analysis
Whole-brain light-sheet microscopy data were registered to an average mouse-brain template using a SHIELD-based workflow24. For each sample, striping artefacts were removed from the raw autofluorescence channel. Images were then resized to the dimensions of a light-sheet-optimized average mouse-brain template measuring 461 × 471 × 323 pixels25 (https://github.com/Gubra-ApS/LSFM-mouse-brain-atlas) and aligned automatically using non-rigid sitk-align registration. Registration results were inspected and manually corrected by repeatedly adjusting data-to-atlas correspondences and re-warping images in nuggt (Neuroglancer ground truth; https://github.com/chunglabmit/nuggt, master) with the nuggt-align function24. In parallel, FOS+ nuclei were detected automatically in three-dimensional image stacks using a Laplacian of Gaussian filter (skimage.feature.blob_log, scikit-image v.0.19.3; https://scikit-image.org/). The same registration parameters were applied to the FOS+ nuclei identified in each corresponding brain sample. To generate FOS+ cell-density heat maps, aligned FOS nuclei were smoothed with a Gaussian blur (sigma = 2.25). Signals from the left and right hemispheres were averaged, followed by batch correction using the ComBat method80. To identify brain-activation patterns associated with each experimental condition, mouse averages from the same time point were normalized across time points within each experiment by dividing each voxel by total activation. Each dataset was then grouped by peak activation time point into four categories: late wake (zeitgeber time (ZT)15–ZT21 for circadian mapping and SD5h–SD6h for sleep deprivation), sleep (ZT03–ZT09 for circadian mapping and R1.5h–R3h for recovery), early wake (ZT12 for circadian mapping and SD1.5h–SD3h for sleep deprivation) and transition (ZT00 for circadian mapping and ZT12 for dark-phase deprivation). Hierarchical clustering was performed for each category with a clustering depth of 20. Clusters were manually classified as type 1, type 2 or type 3 according to their mean response patterns during sleep deprivation and recovery. Whole-brain datasets are available at https://sleep-wake-atlas.scicore.unibas.ch/, and analysis code is available at https://gitlab.com/ceda-unibas/sleep-brain-atlas. For Pearson correlation analyses using undisturbed circadian data (Extended Data Fig. 3), voxel-intensity correlations with wake duration were calculated using the 2-h period preceding each experimental time point.
EEG Recording and Sleep-State Analysis
For EEG implantation, electrodes were positioned stereotactically over the right cerebral hemisphere at anteroposterior (AP) −2.25; lateral (L) +1.7 and AP +1.5, L +1.2 relative to bregma. Custom EEG implants were secured to the skull with superglue and orthodontic resin (Paladur, Kulzer). Mice recovered from surgery for at least 1 week in their home cages. They were then connected to a flexible recording cable with a commutator and habituated to custom behavioural cages for at least 3 days. EEG and video tracking were recorded continuously throughout each experiment. Signals were acquired using a 16-channel AC amplifier (A-M Systems, model 3500), filtered between 0.3 and 300 Hz, amplified 500-fold, digitized at 200 Hz and recorded with Spike2 v.9.09a. EEG data were downsampled to 100 Hz and divided into 2-s epochs. Vigilance states were classified as high-theta wake, low-theta wake, NREM sleep or REM sleep using custom offline electroencephalography state-space analysis software (OESSA; https://github.com/VBits/oessa). EEG recordings were used to quantify sleep and wake behaviour in all experiments. For the sleep-deprivation FOS-mapping experiments shown in Fig. 1, EEG was recorded from only a representative subset of mice because wakefulness was continuously maintained through manual sleep deprivation. Power spectra from 0 to 50 Hz were calculated by fast Fourier transform at 0.25-Hz resolution. To control for inter-animal differences in EEG signal strength, spectral values for each mouse were normalized to total power within each vigilance state and expressed as percentages. Delta-power time courses (0.25–4 Hz) were normalized to mean baseline values measured during the final 4 h of the light phase, when delta power is lowest2,81. To assess the relationship between wake duration and NREM delta power, a three-term filter for wake-enriched episodes42 was applied to EEG data from a 5-day undisturbed baseline. Qualifying episodes included at least 10 min of NREM sleep before at least 15 min of wakefulness, immediately followed by at least 15 min of NREM sleep. NREM periods could contain wake or REM intrusions of 1 min or less, while wake-enriched periods could include NREM intrusions of 3 min or less.
TRAP-Based Neuronal Activity Labelling
4-Hydroxytamoxifen (4-OHT; Sigma H6278) was dissolved in ethanol at 20 mg ml−1 and mixed with two volumes of a 4:1 sunflower seed oil-to-castor oil solution (Sigma, S5007 and 259853). After incubation at room temperature for 2–3 h, ethanol was removed by vacuum centrifugation. The final 10 mg ml−1 solution was administered by intraperitoneal (i.p.) injection at 50 mg kg−1. Mice were habituated to handling and i.p. injections for 4–5 days before TRAP induction. In deprivation-TRAP experiments, 4-OHT was administered 5 h after the start of a 6-h sleep-deprivation period initiated at the beginning of the light phase. In recovery-TRAP experiments, 4-OHT was administered 3 h after the 6-h deprivation period ended. For rested-control TRAP experiments, 4-OHT was given to undisturbed mice 5 h into the light phase. Deprivation-TRAP cells in the median raphe (MR) were labelled during grooming-based sleep deprivation, which produced results comparable to novel-object-based deprivation-TRAP (Extended Data Fig. 5). Deprivation-TRAP cells in the anterior medial preoptic area (aMPO) were labelled using novel-object-based sleep deprivation.
Chemogenetic Manipulation of Sleep-Related Neurons
Under surgical anaesthesia, AAV5-hSyn-DIO-hM3Dq-mCherry (Addgene 50474), AAV5-hSyn-DIO-hM4Di-mCherry (Addgene 50474), AAV9-hSyn-DIO-hM4Di-mCherry or AAV5-Syn-FLEX-PSAM4-GlyR-IRES-EGFP (Addgene 119741) was stereotactically injected into the MR, aMPO, lateral preoptic area (LPO) or lateral hypothalamic area (LHA) using a Nanoject III injector (Drummond Scientific). Coordinates relative to bregma and injection volumes were: MR, AP −2.28, dorsoventral (DV) −4.90, angled 22° anteriorly from the horizontal plane, 100 nl; aMPO, AP +0.80, L ±0.28, DV −5.10, 45 nl bilaterally; LPO, AP 0.00, L ±0.70, DV −5.20, 100 nl bilaterally; and LHA, AP −1.60, L ±1.03, DV −4.95, 100 nl bilaterally. For sleep-classification experiments, custom EEG implants were attached immediately after viral injection. For TRAP experiments, 4-OHT was administered 2 weeks after virus infusion, and chemogenetic testing began 3–4 weeks later. All other chemogenetic experiments started 3–4 weeks after viral injection. Mice were habituated to handling and i.p. injections for 3 days before each experiment. The same animals received control phosphate-buffered saline (PBS) or 1 mg kg−1 CNO (Sigma, SML2304) on consecutive days. This CNO dose was selected because it did not produce phenotypes in control mice. To map MR activation, AAV5-hSyn-DIO-hM3Dq was injected into the MR of TRAP2 mice. Three weeks after deprivation-TRAP induction, CNO was administered at the beginning of the dark phase, and mice were euthanized 1.5 h later for iDISCO-based FOS analysis. For projection-specific MR manipulation, AAVretro-EF1a-FlpO (Addgene 55637) was injected into the LPO or dorsomedial hypothalamus. After 1–2 weeks, AAV8-EF1a-Con/Fon-hM3Dq-mCherry (Gene Vector and Virus Core, Stanford University) was injected into the MR, followed by PBS or CNO administration 3–4 weeks later. Viral targeting was verified post mortem, and animals with off-target expression were excluded.
Anterograde Neural Tracing
AAV9-hSyn-FLEX-mGFP-2A-Syp-mRuby (Viral Core Facility, Charité–Universitätsmedizin Berlin) was injected into the MR of TRAP2 mice 2 weeks before deprivation-TRAP induction. Brains were collected for sectioning and immunostaining 3–4 weeks after TRAP induction. Synaptophysin-mRuby puncta were registered to the Allen Mouse Brain Common Coordinate Framework version 3 (CCFv3) using the QUINT workflow82.
Chronic Neuronal Inhibition and Cell Ablation
For chronic inhibition of deprivation-TRAP cells, AAVdj-CMV-DIO-Kir2.1-2A-ZsGreen or control AAVdj-CMV-DIO-EGFP (Gene Vector and Virus Core, Stanford University) was injected into the MR 1–2 weeks before TRAP induction as described above. Sleep behaviour was assessed 3–4 weeks after TRAP induction. For TRAP-cell ablation, a mixture of AAV9-EF1a-FLEX-DTA (University of Zurich Viral Vector Facility) and AAV5-EF1a-DIO-YFP (Addgene 27056) was injected into the MR 1–2 weeks before TRAP induction. For cell-type-specific ablation, AAV5-FLEX-taCasp3-TEVp (Addgene 45580) and AAV5-EF1a-DIO-YFP were co-injected into the MR of Sert-Cre, Vgat-IRES-Cre and Vglut2-IRES-Cre mice. Control mice received AAV5-EF1a-DIO-YFP alone. Sleep behaviour was analysed 3–4 weeks after TRAP induction or viral infusion, and successful cell ablation was confirmed post mortem.
Immunohistochemistry and Fluorescence Microscopy
Mice were perfused with chilled PBS followed by chilled 4% paraformaldehyde (PFA). Brains were post-fixed overnight at 4 °C and cryoprotected in 30% sucrose. Forty-micrometre cryosections were washed in PBS, incubated in blocking solution containing 10% normal donkey serum and 0.2% Triton X-100 in PBS for 30–60 min at room temperature, and incubated with primary antibodies for 2–3 days. Sections were washed in 0.2% Triton X-100 in PBS at room temperature and incubated with secondary antibodies for 1–3 days. After additional washes, sections were stained with DAPI and mounted using Fluoromount-G (Invitrogen). Images were acquired with a Zeiss AxioScan.Z1 or Zeiss LSM800 confocal microscope using AxioScan or ZEN Blue software. Primary antibodies included rabbit anti-FOS (polyclonal, Synaptic Systems 226 003, 1:1,000–1:4,000), rabbit anti-FOS (monoclonal, Synaptic Systems 226 008, 1:2,000), rat anti-FOS (Synaptic Systems 226 017, 1:2,000), chicken anti-GFP (Invitrogen A10262, 1:1,000), rabbit anti-ZsGreen (Takara 632474, 1:1,000), rat anti-RFP (Chromotek 5f8-150, 1:1,000), goat anti-tdTomato (Origene AB8181, 1:1,000), goat anti-5HT (Immunostar 20079, 1:2,000), guinea pig anti-orexin A (Synaptic Systems 389 004, 1:500), rabbit anti-MCH (Phoenix, H-070-47, 1:500) and mouse anti-nNOS (Sigma N2280, 1:500). Primary antibodies were paired with appropriate donkey or goat secondary antibodies conjugated to Alexa 488, Alexa 546, Alexa 555, Cy3, Alexa 647 or Cy5 and used at dilutions of 1:750–1:1,000 (Thermo Fisher Scientific and Jackson ImmunoResearch).
Multiplex HCR In Situ Hybridization
Multiplex HCR (hybridization chain reaction) probe sets targeting Slc32a1 (Vgat), Slc7a6 (Sert) and Gal, together with the corresponding amplifiers, were used according to the manufacturer’s instructions (Molecular Instruments) with modifications. Forty-micrometre cryosections were prepared as described above, incubated in 70% ethanol for 2 h at room temperature and rinsed in 5× SSCT before pre-hybridization. Following overnight probe hybridization, sections were washed at 37 °C through a 100%/75%/50%/25%/0% probe-wash-buffer to 5×SSCT series before amplification, washing and mounting. When HCR in situ hybridization and immunohistochemistry were performed on the same sections, HCR was completed first. Sections were then fixed in 4% PFA for 10 min at room temperature before immunohistochemical processing.
Ex Vivo Electrophysiology of MR Neurons
All electrophysiological recordings and analyses were performed with investigators blinded to experimental groups. To label GABAergic or serotonergic neurons, AAV9-CAG-DIO-tdTomato or AAV5-hSyn-DIO-tdTomato was injected into the MR of 2–4-month-old Vgat-Cre or Sert-Cre mice, respectively. Approximately 2 weeks later, mice were euthanized 6 h after the beginning of the light phase, immediately after 6 h of sleep deprivation or following an undisturbed period. Coronal MR-containing slices (200 μm) were prepared in carbogenated (95% O2/5% CO2) ice-cold cutting solution containing 205 mM sucrose, 10 mM glucose, 25 mM NaHCO3, 2.5 mM KCl, 1.25 mM NaH2PO4, 7.5 mM MgCl2 and 0.5 mM CaCl2 using a Leica VT1200S vibratome with a horizontal oscillation amplitude of 1.80 mm. Slices were maintained at 33.0 ± 1 °C in carbogenated artificial cerebrospinal fluid (aCSF) containing 125 mM NaCl, 2.5 mM KCl, 1.2 mM NaH2PO4, 24 mM NaHCO3, 5 mM sodium ascorbate, 12.5 mM glucose, 1 mM MgCl2 and 2 mM CaCl2 at pH 7.4 for 30 min. Slices were then kept at room temperature for approximately 1 h before recording.
During recording, slices were maintained at 33.0 ± 1 °C in a custom chamber perfused with carbogenated aCSF. Whole-cell patch-clamp recordings of tdTomato+ MR GABAergic or serotonergic neurons were performed in current-clamp mode using pClamp11 software and a Multiclamp 700B amplifier (Molecular Devices). Neurons were visualized with an upright microscope equipped for gradient-contrast infrared imaging (Luigs and Neumann) and a 60× objective. Data were digitized with a Digidata 1440a at 10 kHz and filtered at 1 kHz. Patch pipettes with resistances of 4–8 MΩ were pulled using a Sutter Instruments P-1000 micropipette puller and filled with intracellular solution containing 142 mM potassium gluconate, 10 mM HEPES, 1 mM EGTA, 2.5 mM MgCl2, 4 mM Mg-ATP, 0.3 mM Na-GTP and 10 mM Na-phosphocreatine, supplemented with 0.2% biocytin. Passive membrane properties and action-potential characteristics were quantified using Clampfit 10 (Molecular Devices).
Sections were fixed immediately after recording. Recorded-cell identity was confirmed post hoc with streptavidin–Alexa488 or streptavidin–Alexa647 (Thermo Fisher Scientific), together with tdTomato immunostaining as described above.
Open-Field, Elevated Plus-Maze and Wood-Block Engagement Tests
For all behavioural tests, AAVdj-CMV-DIO-Kir2.1-2A-ZsGreen or control AAVdj-CMV-DIO-EGFP was injected into the MR of Vgat-Cre;Sert-Cre double-transgenic mice 3 weeks before testing. EEG recordings were analysed to verify sleep-loss phenotypes before behavioural assessment. Open-field and elevated plus-maze tests were conducted at the beginning of the dark phase, when mice naturally show increased wakefulness. For the open-field test, mice were placed in the centre of a 50 × 50-cm square arena with 30-cm walls, and overhead video was recorded for 10 min at 25 frames per second. For the elevated plus-maze test, mice were placed in the centre of a maze with 35 cm × 6-cm arms positioned 74 cm above the ground. Video was recorded for 5 min. Locomotor activity, time spent in the open-field centre and time spent in closed arms were quantified using open-source OptiMouse software (https://github.com/yorambenshaul/optimouse)83.
To measure wood-block engagement, 1 × 1 × 5-cm wood blocks (Labodia 213-1011) were placed in the home cage for 18 days. The blocks were then 3D-scanned using a tripod-mounted Shining Einscan Pro HD scanner and turntable. Total wood volume engagement was quantified from the resulting 3D reconstructions.
Contextual Fear Conditioning and Memory Recall
Fear-conditioning acquisition and recall were conducted at the beginning of the dark phase, when mice naturally spend more time awake. During acquisition, mice were placed in the centre of a 25 × 25-cm square chamber containing a 2% acetic-acid odour source and an electrifiable grid floor (Fear Conditioning System, Ugo Basile; EthoVision XT software v.14–17). Mice were allowed to explore freely for 3 min, after which five 0.8-mA, 1-s foot shocks were delivered at 30-s intervals. Memory recall was tested 1 day after training for recent memory and 14 days after training for remote memory. During recall, mice were returned to the same conditioning context and allowed to explore for 5 min without receiving shocks. Behaviour was recorded with an overhead infrared camera (Basler acA1300-60gm, Basler GenICam). Fear memory was evaluated by measuring the proportion of time spent freezing in the shock-associated context. EthoVision XT automatically classified freezing as complete immobility, apart from breathing, lasting at least 2 s. The pixel-change threshold was less than 1–3% and was adjusted for each mouse, as previously described84.
Statistical Analysis and Reproducibility
Information about mouse numbers, sample sizes and statistical tests for each experiment is provided in the corresponding figure legends. All statistical tests were two-sided. Sample sizes were selected based on previous experiments and published studies, and every experiment included at least three replicates. Statistical analyses were performed using Python or GraphPad Prism v.10.
Reporting Summary
Additional information about the research design is provided in the Nature Portfolio Reporting Summary linked to this article.
Source: www.nature.com