


JWST Reveals a Compact, Gas-Obscured Black Hole in MoM-BH*-1
Observations and Data Reduction
MoM-BH*-1 was observed with the James Webb Space Telescope (JWST) through three observing programmes. During Cycle 1, the source was imaged by the PRIMER survey14 (JWST-GO-1837; principal investigator: J. Dunlop) using the MIRI instrument on 5 and 16 January 2023, and NIRCam on 7 and 9 August 2023.
During Cycle 2, on 19 December 2023, the EXCELS survey15 (JWST-GO-3543) obtained 1.5 hours of NIRSpec G395M spectroscopy. In Cycle 3, on 15 December 2024, MoM-BH*-1 was targeted by the “Mirage or Miracle” NIRSpec prism survey (JWST-GO-5224).
MoM-BH*-1 was assigned high priority in the UDS masks, second only to luminous sources at z > 10. The source appeared on several priority lists, including AGN and little red dot (LRD) candidates selected through compact morphology and EAZY template fitting47, extremely massive galaxy candidates, sources with unusual red colours and previously identified LRD candidates48.
We use version 7.2 images of the PRIMER field released through the DAWN JWST Archive (DJA). These data were reduced with the grizli software49, while PSF-matched photometric catalogues based on the same images were produced in ref. 50. For the EXCELS grating observations, we use the public version 3 NIRSpec reductions from the DJA, which were processed with msaexp37,51,52. The MoM observations were reduced with the same pipeline and processing choices.
No relevant archival radio or ALMA observations were identified. However, MoM-BH*-1 was observed with Chandra53. Like almost all known LRDs9,54,55, the source remains undetected in X-rays, with a rest-frame 5–90 keV luminosity limit of LX < 44.5 erg s−1 at 1σ. The main observed properties of the source are summarized in Extended Data Table 1.
Emission-Line Fitting
We use a custom NIRSpec emission-line fitting package56 to model the grating and prism spectra simultaneously. This joint approach is useful because features detected at low signal-to-noise ratio in either dataset can be recovered more reliably when they appear at the same wavelength in both dispersers.
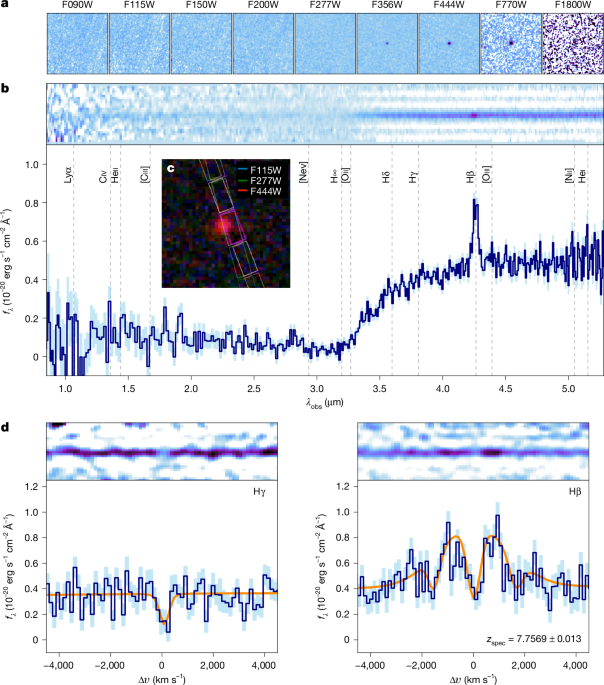
We first fit the Hβ emission line and the [O iii] doublet. The resulting redshift is then used as a prior when fitting Hγ (Fig. 1). Hβ is modelled as a single emission line containing three absorbers constrained to have negative flux. One absorber is centred on the line, while the other two are positioned on either side of zero velocity. This configuration is motivated by the symmetric absorption troughs surrounding the central double-peaked profile shown in Extended Data Fig. 2.
The systemic redshift is tied to [O iii] and the broad Hβ component, while the absorber velocities are allowed to vary freely. We select the number of absorbers by examining the maximum reduced χ2. Three and four absorbers produce similar results, so we adopt the simpler three-absorber model. The additional structure may be related to secondary peaks near ±2,400 km s−1 (Extended Data Fig. 2).
Adding a narrow Hβ component at the systemic redshift results in an unconstrained flux that is degenerate with the absorption model and does not improve the fit. We therefore omit this component. The posterior distributions are sampled with the NUTS sampler implemented in numpyro57. The resulting fits are shown in Extended Data Fig. 1 and listed in Extended Data Table 2.
Although the formal uncertainties on several line fluxes and widths are substantial, the main features are robust. These include extremely broad Hβ emission and deep, broad absorption that removes approximately 25% of the total emission flux, including nearly all of the flux at line centre.
The two principal absorbers occur at similar but opposite velocities, approximately ±1,500 km s−1, although the uncertainties are large: \(-1,53{2}_{-113}^{+345}\,\mathrm{km}\,{{\rm{s}}}^{-1}\) and \(+1,55{6}_{-1,378}^{+232}\,\mathrm{km}\,{{\rm{s}}}^{-1}\). This symmetry extends beyond the absorber locations to the detailed structure of the complete emission-line profile across several thousand kilometres per second (Extended Data Fig. 2).
Morphology
We fit the imaging data with a Sérsic profile using pysersic58. The analysis focuses on the F356W and F444W filters, where MoM-BH*-1 is clearly detected.
Following the procedure described in ref. 59, we construct an empirical point-spread function from stars in the field. This PSF is then supplied to pysersic, which samples the posterior distribution of the Sérsic parameters with numpyro.
MoM-BH*-1 is unresolved in the JWST imaging. We place a 99% upper limit of <117 pc on its effective radius, consistent with an interpretation in which the observed emission is dominated by a central black hole rather than an extended host galaxy.
Cloudy Modelling of the Dense Gas
The possibility that dense gas surrounds and blankets LRDs was proposed in the work that first defined this class of objects9. Approximately 10% of LRDs show clear Balmer absorption, although this is likely a lower limit because of limited spectral resolution and signal-to-noise ratio11. By comparison, Balmer absorption is seen in far fewer than 0.1% of pre-JWST AGN60, with only a small number of known examples9.
Nearby AGN61 do not exhibit Balmer breaks as strong as the break in MoM-BH*-1, which is approximately 8. The strongest breaks in local AGN, generally associated with quiescent galaxies, are less than about 2.5 and approach the maximum stellar-population break shown in Fig. 2b.
Previous Cloudy models of continuum absorption5 suggested that the gas responsible for strong Balmer absorption could also generate Balmer breaks. However, those models produce weaker and sharper breaks than required for MoM-BH*-1, whereas this source displays a smooth rollover. We therefore extend that modelling framework here.
The explored parameter grid is summarized in Extended Data Table 3. It covers a broad range of conditions to reproduce the extreme spectral shape of the source. We begin with an intrinsic AGN spectral energy distribution described by multiple power laws and a “big bump” temperature32.
The AGN continuum is then transmitted through gas surrounding the central source. The gas is defined by its density, column density, metallicity and turbulent velocity, while the ionization state is controlled by the ionization parameter, log(U). A turbulent velocity of 500 km s−1 is motivated by the observed absorption-line widths (Fig. 1). This corresponds to a high Mach number, consistent with some recent AGN-disc models62, although it remains uncertain whether such turbulence can be maintained throughout a large gaseous envelope.
Turbulence is also important because it produces the smooth spectral rollover observed in MoM-BH*-1 rather than a sharp Balmer break6. Finally, we apply a uniform dust screen63 with AV = 0–3 mag during post-processing. This is the only post-processing step applied to the models.
Models are selected according to four observational requirements:
- Hβ must appear in net emission with 30 < EW [Å] < 45.
- Hγ must be in absorption with −5 < EW [Å] < 0 Å.
- The model must reproduce a strong Balmer break and high optical-to-UV ratio, requiring \({f}_{{\rm{4.5\mu m}}}^{\lambda }/{f}_{{\rm{1.8\mu m}}}^{\lambda } > 6\) and \({f}_{{\rm{4.5\mu m}}}^{\lambda }/{f}_{{\rm{2.8\mu m}}}^{\lambda } > 3\).
- Model fluxes in the MIRI bands must fall within 2σ of the observations.
A few thousand models satisfy these criteria. They are then re-simulated at higher resolution, retaining only the hydrogen species relevant to the key spectral features to improve computational efficiency. The model that most closely reproduces the detailed continuum shape is selected as the fiducial model.
We also test the covering factor and distance between the gas and the central source. These parameters are degenerate with the intrinsic AGN SED and ionization parameter. The observed spectrum is best matched by the “net transmitted” flux, consisting of the attenuated incident continuum plus diffuse continua and emission lines. The “total” flux, which also includes reflected continua and lines, does not provide as good a match.
Fiducial Cloudy Model: Gas Absorption Rather Than Dust
The fiducial Cloudy model shown in Fig. 3 and Extended Data Fig. 3 reproduces several important properties of MoM-BH*-1 within the limitations of the parameter grid. The relevant parameter space is high-dimensional and highly degenerate, and the intrinsic spectral energy distributions of early AGN—including possible photon-trapping effects—remain uncertain.
Consequently, the model should not be used to make highly detailed physical inferences. Instead, it demonstrates the feasibility of a broad physical scenario in which an accretion disc is embedded within extremely dense gas.
The preferred model contains an extreme column density of approximately 1025.8 cm−2, comparable to the most heavily enshrouded systems observed64. Its gas density is approximately 1011 cm−3, a regime capable of producing Balmer absorption. The 500 km s−1 turbulent velocity is consistent with the width of the central Hβ absorber.
The model favours metal-poor gas, as expected for a dwarf galaxy at z ≈ 8. Its AGN slope parameters are consistent with published AGN SEDs6,65.
A key result is that the model is almost dust-free, with AV = 0.15 mag. The weak UV emission is produced by extreme hydrogen opacity rather than dust extinction. This result challenges LRD models that require substantial dust to suppress the UV emission of classical AGN21,24,66 or to explain weak Hβ relative to Hα12.
Although AV ≈ 2–3 mag can help dense-gas AGN models create a smooth Balmer break in the rest-optical6, the longer-wavelength data for MoM-BH*-1 rule out this level of extinction (Extended Data Fig. 3). More generally, stringent infrared constraints on LRDs support low dust attenuation34,35. Because AV is close to zero, the precise dust geometry—whether a screen or clumpy material—is not important for the conclusions.
Resonant Balmer Scattering and Lyα-Like Shell Models
The Hβ profile of MoM-BH*-1 closely resembles a double-peaked Lyα profile67–69. This similarity motivates testing whether Hβ behaves as a resonant line under the extreme densities present in the source.
Such behaviour may be common among LRDs, but the symmetric, widely separated double peak may be especially apparent in MoM-BH*-1 because Hβ emission from the lower-mass host galaxy is negligible.
Although Hβ normally has an efficient cascade pathway for escaping, saturation of the 2p state could trap Hβ photons. This may occur through Lyα pumping in optically thick environments70. We investigate this possibility with the COLT radiative-transfer code71, implementing a simple shell model analogous to commonly used Lyα shell models.
The main parameters are the thermal velocities of the inner and outer shells, their relative velocities and the optical depth encountered by Hβ. These simplified models do not include strong turbulence.
As shown in Extended Data Fig. 4, an initially narrow Gaussian Hβ line can develop a double-peaked profile. The basic trends observed for Lyα resonant scattering also apply to Balmer lines and provide a useful framework for interpreting MoM-BH*-1. The toy model reproduces both the velocity separation and relative intensity of the strongest peaks in the observed Hβ profile.
If resonant scattering is occurring, the observed Balmer-line widths may not trace the true kinematics of the broad-line region. Instead, they could reflect radiative transfer through gas surrounding the black hole. As a result, SMBH masses derived from Balmer-line widths may be overestimated by as much as 2 dex (Extended Data Table 4).
More detailed models of resonant scattering in LRDs73 differ in their assumptions and implementation, but reach the same fundamental conclusion.
SMBH Properties and Implications for LRDs
The unusual physical conditions in MoM-BH*-1 mean that standard local scaling relations must be applied cautiously. We evaluate several methods for estimating the SMBH properties, summarized in Extended Data Table 4. Because of substantial systematic uncertainties, these values should be considered order-of-magnitude estimates that bracket the possible range.
First, we apply local Hβ-based scaling relations39 to the Hβ line after correcting for absorption and dust. The absorption correction is normally obtained by fitting an underlying Gaussian or Lorentzian emission profile9,21, as shown in Extended Data Fig. 1.
Dust correction is more difficult because the observed Hα and Hβ fluxes are affected by radiative transfer in dense gas. Current studies commonly infer several magnitudes of visual extinction from continuum-slope fitting or SED modelling6,10,12,13.
Using the optical continuum slope10 would imply AV ≈ 2 for MoM-BH*-1 and an SMBH mass of approximately 108.3 M☉. This is comparable to the stellar mass of the host galaxy, which is constrained to be <108.5 M☉ at 95% confidence. Under this interpretation, the black hole would appear overmassive compared with local host-galaxy scaling relations13,41.
However, the SED of MoM-BH*-1 indicates that the extinction required for LRDs may be negligible. The source is intrinsically weak in the UV below the Balmer break, meaning its red colours are more likely caused by gas opacity than by dust obscuration. With AV = 0, the inferred SMBH mass decreases to approximately 5 × 10⁷ M☉, with a luminosity near 15% of the Eddington limit.
The line width itself may also be unreliable. If the observed profile is shaped by resonant scattering, it does not directly measure the broad-line-region velocity, undermining the assumptions behind standard scaling relations (Extended Data Figs. 4 and 5).
The intrinsic BLR profile in LRDs may be complex, potentially resembling the structure shown in Extended Data Fig. 2, and may be difficult to separate from host-galaxy emission. If Hβ undergoes resonant scattering in the atmosphere around the black hole, the intrinsic BLR width could be as low as approximately 600 km s−1 (Extended Data Fig. 5). This would imply an SMBH mass of roughly 106 M☉.
The Cloudy model provides another estimate. Integrating the SED shown in Extended Data Fig. 3 gives a bolometric luminosity of approximately 1044.5 erg s−1. This is about an order of magnitude lower than the luminosity expected from local calibrations, further demonstrating their limitations for LRDs.
The luminosity can be converted into a black-hole mass by considering theoretical models of similar systems74–76, which predict near-Eddington or super-Eddington accretion capable of sustaining convective envelopes. The widespread O I emission in LRDs, potentially produced by Lyβ fluorescence21,66,77, is also considered a signature of super-Eddington accretion78.
Assuming L/Lbol ≈ 1 gives an estimated black-hole mass of approximately 106.3 M☉. If commonly reported LRD black-hole masses are overestimated by factors of 10–100, the typical MBH/M⋆ ratio of JWST-selected AGN—currently estimated at approximately 1–10%79–81—would move closer to the local-Universe value of approximately 0.01%82.
Host-Galaxy Properties
Host-galaxy masses can be estimated using clustering results indicating that rest-frame UV emission in typical LRDs with FWHM values of 1,000–2,000 km s−1 originates primarily from the host galaxy41.
This assumption does not apply to every LRD. The most luminous sources, especially those with broader emission lines, can show clear AGN signatures in the rest-frame UV21. However, such objects currently appear to be the exception.
To construct an empirical relation between stellar mass and UV magnitude, we use low-luminosity galaxies at z = 3–7 from the All the Little Things (ALT) survey in the Abell 2744 field40. This is the largest spectroscopic sample of galaxies with MUV < −15 at these redshifts.
ALT stellar masses were derived with the Prospector SED-fitting code using 27 bands of NIRCam and HST photometry, including all available JWST medium and broad bands83,84. A galaxy with MUV between −17.9 and −18.3 is expected to have a median stellar mass of \(\log ({M}_{\star }/{M}_{\odot })=7.{4}_{-0.3}^{+0.6}\), with a 95% upper limit of \(\log ({M}_{\star }/{M}_{\odot }) < 8.5\).
Possible Variability in MoM-BH*-1
Variability offers an independent way to investigate the physical nature of MoM-BH*-1. In LRDs, the observed SED combines emission from the host galaxy and black hole in different proportions across wavelength. Because the host is strongly outshone in this source, intrinsic variability may be easier to detect.
One of the few reported variable LRDs is also a source with a large Balmer break, suggesting a high contribution from the black hole30.
Three observations covering 3–5 μm are available for MoM-BH*-1, separated by approximately 60 days in the rest frame (Extended Data Fig. 6). Comparing different observing modes introduces systematic uncertainties, so this is not an ideal variability test. Nevertheless, the source appears to have brightened by 30 ± 7% between the first epoch, observed with NIRCam, and the third epoch, observed with the NIRSpec prism without post-processing renormalization to the photometry.
The prism spectrum is affected by slit losses, yet the source appears brighter than expected based on the NIRCam photometry. Among the 136 sources with high signal-to-noise photometry (S/N > 10) and spectra (50th percentile S/N > 5) observed in two masks by the MoM programme, MoM-BH*-1 is the only source showing a brightening of this magnitude.
NIRSpec/G395M fluxes are typically approximately 10–20% lower than prism fluxes because of calibration uncertainties85. Accounting for this offset, the prism and NIRSpec measurements of MoM-BH*-1 are consistent with one another and are approximately 30% brighter than the NIRCam data.
The SED shape and Balmer-break depth remain consistent between the NIRCam and prism observations. For example, \({f}_{{\rm{F410M}}}^{\nu }/{f}_{{\rm{F356W}}}^{\nu }=2.0\pm 0.2\) in the prism data compared with 2.2 ± 0.2 in NIRCam. The primary difference is the absolute brightness.
If taken at face value, the measurements represent an approximately 4σ detection of variability over only two months. MoM-BH*-1 is therefore an excellent target for future JWST monitoring. The variability could provide independent evidence for the AGN nature of the source and offer further insight into the highly dynamic environment surrounding its early black hole.
Source: www.nature.com