


Human tissue samples and experimental methods
Post-mortem human tissue samples from multiple sclerosis donors
Post-mortem eyeballs from donors diagnosed with multiple sclerosis (MS) were obtained from the Netherlands Brain Bank. Control eyeballs from donors without recognizable neuropathological abnormalities were supplied by Johns Hopkins University. Donor information for single-nucleus RNA sequencing (snRNA-seq), immunohistochemistry, quantitative PCR (qPCR) and single-molecule fluorescence in situ hybridization (smFISH) is provided in Supplementary Table 1. Macular tissue was used for snRNA-seq, whereas smFISH was performed on tissue adjacent to the macula. qPCR and immunohistochemistry were conducted using peripheral retinal tissue.
Paraffin-embedded cortical tissue for histopathological analysis was obtained from the UK Multiple Sclerosis Tissue Bank at Imperial College London. Based on the Tissue Bank’s histopathology reports, samples were classified as chronic active lesions or normal-appearing grey matter. Sample sizes were not statistically predetermined, but were comparable to those used in previous studies12,13,60.
Nucleus isolation and single-nucleus RNA-sequencing library preparation
Eyeballs were enucleated from deceased healthy controls and individuals with MS. Only samples with a post-mortem interval of ≤24 h were included. Fresh-frozen eyeballs were positioned in a CM3050 S cryostat (Leica Microsystems) at –20 °C, with the lens facing downward and the optic disc oriented toward the examiner. The macula was identified by its characteristic yellow appearance and stored at −80 °C until processing.
All subsequent procedures were performed on ice using a previously published protocol with minor modifications. Frozen tissue was transferred to ice-cold NP40 lysis buffer containing 0.1% NP-40 (Thermo Fisher Scientific, 85124), 10 mM Tris pH 8.0, 1 mM CaCl2, 8 mM MgCl2, 15 mM NaCl and 0.02 U µl–1 DNase I (Merck Millipore, D4527). Retina was transferred to a Dounce homogenizer containing 1 ml lysis buffer supplemented with 0.2 U µl−1 Ribolock RNase inhibitor (Thermo Fisher Scientific, EO0382) and homogenized 20 times with loose and tight pestles. The homogenate was passed through a 100 µm cell strainer and centrifuged at 500g for 5 min. Except for washing buffer, all buffers contained 0.16 U µl−1 Ribolock RNase inhibitor.
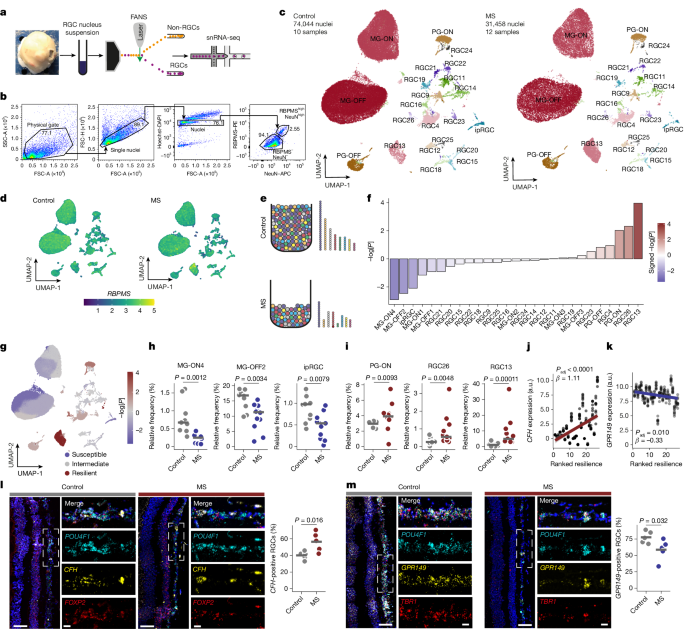
Pelleted nuclei were resuspended in staining buffer containing 10 mM Tris pH 8.0, 1 mM CaCl2, 8 mM MgCl2, 15 mM NaCl, 1 U ml−1 DNase I, 0.02% Tween-20 and 2% BSA. Nuclei were labelled with primary antibodies against NeuN (1:250, Merck Millipore, ABN91) and RBPMS (1:250, Abcam, ab194213) for 15 min at 4 °C. Following washing and centrifugation at 500g for 5 min, nuclei were incubated with anti-chicken 647 (1:500; Jackson ImmunoResearch, 703-605-155) and anti-rabbit PE (1:200, BioLegend, Poly4064) secondary antibodies for 15 min at 4 °C.
Nuclei were filtered through a 70 µm strainer, resuspended in sorting buffer containing Tris base buffer and 2% BSA, and stained with Hoechst (1:2,000). NeuN+RBPMS+ nuclei were sorted using a BD FACS Aria III system running BD FACSDiva v.9.0.1 into Ames medium (Sigma-Aldrich, A1420) containing 1.5% BSA. Sorted nuclei were pelleted at 500g for 5 min at 4 °C, resuspended in approximately 20 µl of 1% BSA in PBS, counted with a Neubauer chamber and adjusted to approximately 1,000 nuclei per µl.
Nuclei were loaded onto a 10x Chromium Single Cell Chip G (10x Genomics), targeting approximately 12,000 nuclei per channel. Libraries were prepared using the Chromium Single Cell 3′ Reagent Kit v3.1 with dual indexing, assessed using an Agilent Bioanalyzer TapeStation 4150 and sequenced on an Illumina NovaSeq 6000 platform using paired-end sequencing. The target sequencing depth was approximately 30,000 reads per nucleus.
Single-nucleus RNA-seq data preprocessing and quality control
Count matrices were generated by aligning each library to the human GRCh38-2020-A reference mRNA transcriptome using Cell Ranger v.7.0.1, including exonic and intronic reads61. Cell Ranger outputs were processed with CellBender v.0.3.0 using default settings (epochs = 150, fpr = 0.01 and learning rate = 10−4) to remove ambient RNA and background contamination62.
Downstream analysis was conducted in Seurat v.563 using R v.4.4.1 in RStudio. Counts were normalized to a total library size of 10,000 and log transformed using NormalizeData. The 2,000 most variable features were identified with FindVariableFeatures, followed by scaling with ScaleData and principal-component analysis with RunPCA using 50 principal components. RPCA integration was performed with IntegrateLayers. The integrated components were used to construct a k-nearest-neighbour graph with FindNeighbors and to perform Leiden clustering with FindClusters at a resolution of 2.5, deliberately overclustering the initial dataset.
A total of 351,737 nuclei underwent quality control. Potential doublets were identified with scDblFinder64 using a cluster-based approach and an estimated standard 10x doublet rate of 0.8% per 1,000 nuclei. Non-retinal ganglion cell (RGC) nuclei were removed by retaining clusters with high expression of RBPMS, a principal RGC marker. After subsampling, nuclei were excluded if they had gene counts greater than the mean + 3 s.d., fewer than 2,300 gene counts, a doublet score >0.5 or mitochondrial counts >5%.
RGC clustering and cell-type annotation
After removal of low-quality and non-RGC nuclei, normalization and clustering were repeated at a resolution of 0.5 using 30 principal components and 30 dimensions for neighbour-graph construction. Differentially expressed marker genes were calculated for each cluster against all other clusters with Seurat’s FindMarkers function.
Clusters were merged when they differed by ≤5 differentially expressed genes, with an average log2-transformed fold change >2 or <–2 and a P value < 0.05. Clusters containing fewer than 200 nuclei in controls or absent from at least two samples were merged with their nearest neighbour using a Euclidean distance matrix generated in gene-expression space (BuildClusterTree; Supplementary Fig. 1e).
The remaining 27 clusters were manually annotated using marker-gene expression and three published healthy human RGC datasets as references8,9,10. To prevent MS-associated transcriptional changes from influencing annotation, marker genes were identified only from healthy control samples using FindAllMarkers. The top 30 markers for each cluster were evaluated, with 2–3 markers shown in Extended Data Fig. 1e.
For each reference dataset, the 50 highest-ranked marker genes per cell type were selected for gene set enrichment analysis (GSEA) using the ClusterProfiler65 package and ranked cluster markers from healthy controls. For Extended Data Fig. 1c and cell-type marker identification in Extended Data Fig. 1e, the three midget OFF RGC subtypes (MG-OFF1, MG-OFF2 and MG-OFF3) and four midget ON RGC subtypes (MG-ON1, MG-ON2, MG-ON3 and MG-ON4) were combined into midget OFF and midget ON groups. These merged groups were also used for the UMAP shown in Fig. 1c.
Differential gene expression analysis in multiple sclerosis RGCs
To characterize the transcriptional response of RGCs during MS, unnormalized counts were aggregated by sample and condition using Seurat’s aggregateExpression function to generate pseudobulk profiles. Normalization and differential expression analysis were performed with DESeq2 v.1.4466. Genes with a false discovery rate (FDR)-adjusted P value < 0.05 were considered differentially expressed. Biological pathway and theme enrichment was assessed using ClusterProfiler v.4.12.665.
Analysis of resilient and susceptible retinal ganglion cell subtypes
RGC subtype vulnerability in MS was assessed by comparing the relative frequency of each cell type between control and MS populations. Outliers were identified and excluded using Grubbs’ test. Differences in relative frequency were evaluated with Mann–Whitney U-tests.
Clusters with significantly lower relative frequencies in MS than in controls (P < 0.05 and log2-transformed fold change < 0) were classified as susceptible. Clusters with significantly higher frequencies (P < 0.05 and log2-transformed fold change > 0) were classified as resilient. Clusters showing the same direction of change without statistical significance (P > 0.05) were classified as intermediate susceptible or intermediate resilient.
Sample- and condition-specific pseudobulk profiles were generated for significantly depleted clusters (MG-ON4, MG-OFF2 and ipRGC) and enriched clusters (PG-ON, RGC26 and RGC13). DESeq2 was used to compare transcriptional profiles among resilient MS, resilient control, susceptible MS and susceptible control pseudobulks.
Gene-regulation modules were defined as follows: module A, genes upregulated in resilient versus susceptible RGCs; module B, genes upregulated in susceptible versus resilient RGCs; module C, genes upregulated in resilient RGCs during MS; module D, genes downregulated in resilient RGCs during MS; module E, genes upregulated in susceptible RGCs during MS; and module F, genes downregulated in susceptible RGCs during MS. Gene Ontology enrichment was performed with ClusterProfiler65.
Resilience and vulnerability scores for susceptible, intermediate susceptible, intermediate resilient and resilient pseudobulks were calculated for each donor and condition using AUCell67. The top 200 genes from modules A–E were used as input after pseudobulk aggregation and normalization. Intrinsic resilience and susceptibility scores for each donor and RGC subtype were calculated with the top 200 genes from modules A and B, respectively.
Linear regression of intrinsic susceptibility and resilience genes
To identify genes associated with RGC resilience, all RGC types were analysed rather than only the most resilient and susceptible clusters. Clusters were ranked from most susceptible to most resilient using the signed negative logarithmic P value for their relative frequency in MS compared with controls.
The analysis focused on ten control samples. To reduce bias caused by differences in cluster size, 100 nuclei were randomly selected from each cluster within each sample. Clusters containing fewer than 10 nuclei were excluded. Sampling was performed with replacement for clusters containing fewer than 100 nuclei and without replacement for larger clusters. The procedure was repeated five times, and pseudobulk count vectors were summed across iterations.
DESeq2 v.1.44 was used to normalize size-adjusted pseudobulk counts while accounting for sequencing depth and library-size differences. Variance stabilization was performed with the DESeq2 rlog function. For each gene, normalized expression was modelled using linear regression in R with the formula normalized expression ~ resilience. The resilience score was defined as the signed negative logarithmic P value for the cluster’s relative frequency in MS compared with controls. Multiple-testing correction was performed using the FDR method.
Single-molecule fluorescence multiplex in situ RNA hybridization
smFISH was performed on representative 16 µm unfixed cryosections from post-mortem MS and control tissues using the RNAscope Multiplex Fluorescent Detection Kit v2 (ACD Biotechne, 323100) according to the manufacturer’s instructions. Human RNAscope probes targeted POU4F1 (438441), TBR1 (425571-C2), FOXP2 (407261-C2), GPR149 (1040901-C3) and CFH (428731-C3). Probes were labelled with TSA Vivid fluorophores: fluorescein, cyanine 3 and cyanine 5 (Akoya Biosciences). Each run included human 3-plex positive-control (320861) and negative-control (320871) slides.
Image acquisition and quantification of multiplex RNA fluorescence
Multiplex fluorescence images were acquired using a Leica DM6 B microscope with a Leica K5 camera and THUNDER preprocessing. Images were collected at ×20 magnification as z-stacks using LAS-X software and exported as LIF files for analysis in QuPath v.0.4.368.
In QuPath, the RGC layer was selected and cells were detected from the DAPI channel. Subcellular spot detection was performed for POU4F1, FOXP2, TBR1, CFH and GPR149. Double-positive cells, including POU4F1-positive cells co-expressing subtype markers, were identified using an initial single-measurement classifier followed by a composite classifier.
Reverse-transcription quantitative PCR
RNA was reverse transcribed into complementary DNA using the RevertAid H Minus First Strand cDNA Synthesis Kit (Thermo Fisher Scientific, K1632). qPCR was performed on a QuantStudio Flex Real-Time PCR System using TaqMan assays for Cfh (mouse, Mm01299248_m1), RBPMS (human, Hs01060992_m1) and RCVRN (human, Hs00610056_m1). All measurements were performed in triplicate. Relative gene expression was calculated as \({2}^{-\varDelta {C}_{{\rm{t}}}}\), normalized to Tbp (mouse, Mm01277042_m1) or GAPDH (human, Hs99999905_m1).
Human post-mortem histopathology
Paraffin sections were cut at 3 μm and stained with haematoxylin and eosin (H&E). For immunohistochemistry, sections were dewaxed and endogenous peroxidase activity was blocked with 3% hydrogen peroxide. Antigen retrieval was performed with a Ventana BenchMark XT autostainer. Sections were blocked with rabbit serum and incubated with anti-human CFH antibody (1:40; R&D, AF4779).
Specific antibody binding was detected with anti-goat Histofine Simple Stain MAX PO immune-enzyme polymer (Nichirei, 414161F), followed by DAB development using the UltraView Universal DAB Detection Kit (Roche, 760-500). Sections were counterstained and blued with haematoxylin (Ventana Roche, 760-2021) and Bluing Reagent (Ventana Roche, 760-2037) for 4 min before mounting.
DAB-positive neurons were manually counted per cortical tissue area using ImageJ (Fiji, v.2.14.0). Neurons were identified by their characteristic morphology in H&E-stained sections. Donor information is provided in Supplementary Table 2.
Animal models of multiple sclerosis
Mouse strains and housing conditions
C57BL/6J wild-type (WT) mice were obtained from The Jackson Laboratory, SJL/JRj WT mice from Janvier Labs, C3-knockout mice (B6.129S4-C3tm1Crr/J) from The Jackson Laboratory, and Cfhflox/flox mice were maintained at the University Medical Center Hamburg-Eppendorf (UKE). All animals were housed under specific pathogen-free conditions. Adult mice aged 8–20 weeks were used.
Female C57BL/6J WT, SJL/JRj WT and C3-KO mice were used for EAE experiments. An additional male C57BL/6J cohort was included to assess potential sex-dependent effects by comparing neuronal mHDM-FH expression with GFP controls. Both sexes were used for experiments involving Cfhflox/flox mice.
Mice were maintained on a 12 h light–12 h dark cycle at 22 ± 2 °C and 40–60% relative humidity, with free access to standard chow (Altromin, 1328P) and water. EAE mice additionally received DietGel Recovery (Ssniff, H007-72065). Where both sexes were included, equal numbers of male and female mice were assigned to each group. Animals from each litter were distributed evenly between groups to reduce litter effects. Within these constraints, mice were randomly assigned to receive effector AAVs or control AAVs.
Sample sizes followed the principles of replacement, reduction and refinement, the use of genetically homogeneous inbred strains and sample sizes commonly used in previous EAE studies that detected comparable biological effects25,37,38. Clinical EAE scoring was performed blinded to genotype and injected AAV.
Generation of neuronal Cfh knockout mice
Cfhtm1a(EUCOMM)Wtsi sperm from The Jackson Laboratory were revitalized on C57BL/6 WT females, producing litters carrying the Cfhtm1a(EUCOMM)Wtsi allele. Conditional tm1c (Cfh-flox) alleles were generated by breeding these animals with ACTB:FLPe B6J mice expressing Flp recombinase (The Jackson Laboratory, 005703)69.
Neuronal Cfh-knockout mice were generated by retrobulbar intravenous injection of a PhP.eB AAV encoding Cre recombinase under the hSYN1 promoter into Cfhflox/flox mice.
Experimental autoimmune encephalomyelitis model
For AAV-mediated expression studies, mice received 100 μl of the relevant PhP.eB AAV at a titre of 3 × 10¹¹ viral genomes in PBS by retrobulbar injection 3 weeks before EAE induction. Mice were weighed and monitored daily from 1 week after injection. Effector constructs were compared with GFP-only AAV controls in littermates.
EAE was induced in C57BL/6 mice by subcutaneous immunization with 200 μg MOG35–55 peptide (Schafer-N) emulsified in complete Freund’s adjuvant (CFA; Difco, DF0639-60-6) containing 2 mg ml−1 Mycobacterium tuberculosis. Pertussis toxin (300 ng; Calbiochem, CAS70323-44-3, 516562) was administered intraperitoneally on the day of immunization and 48 h later.
In SJL mice, EAE was induced with 100 µl PLP139–151 peptide (1.5 mg ml−1) emulsified 1:1 with 100 µl CFA containing M. tuberculosis H37RA (1 mg ml−1; 100 µg per mouse).
Clinical scores were recorded daily: 0, no deficit; 1, tail weakness; 2, hindlimb paresis; 3, partial hindlimb paralysis; 3.5, complete hindlimb paralysis; 4, complete hindlimb paralysis with forelimb paresis; and 5, premorbid state or death. Animals reaching a score of ≥4 were euthanized according to the German Animal Welfare Act. Investigators were blinded to genotype and treatment.
Visual function testing in EAE mice
Visual acuity and contrast sensitivity were evaluated using automated optomotor testing with the OptoDrum system (Striatech)70,71. Individual mice were placed on an elevated central platform surrounded by computer monitors and monitored from above. A rotating vertical black-and-white grating induced the optomotor reflex, a head-tracking response to moving visual stimuli.
Visual acuity was measured by increasing spatial frequency until the reflex was no longer elicited. Contrast sensitivity was measured by progressively reducing grating contrast until the response disappeared. Two successful responses were required to advance to the next stimulus level, whereas three consecutive failures defined an unsuccessful trial.
Analysis of published EAE sequencing datasets
Raw count matrices and metadata were obtained from publicly available Gene Expression Omnibus (GEO) datasets. GSE118948 contains single-cell sequencing data from CD45+ cells isolated from the spinal cords of EAE mice 15 days after immunization. Single-cell data were analysed with Seurat using cell-type annotations from the original publication22. Seurat’s FindMarkers function and a Wilcoxon rank-sum test were used to compare healthy and acute-EAE mice across T cells, neutrophils, dendritic cells, macrophages, monocytes, CNS-associated monocytes and microglia.
Bulk RNA-seq dataset GSE194071 was used to analyse spinal-cord microglia from acute and chronic-recovery EAE mice, whereas GSE100329 was used to assess spinal-cord astrocytes from acute and chronic-progressive EAE mice. GSE104899 and GSE279707 were used to study spinal-cord motor neurons in acute EAE mice. Bulk datasets were analysed with DESeq2 v.1.44, and signed negative logarithmic FDR-adjusted P values were calculated for visualization.
Immunohistochemistry of mouse spinal cord tissue
Mouse spinal cord tissue was collected and processed as described previously72. Images were acquired with a Zeiss LSM 900 Airyscan 2 laser-scanning confocal microscope using ZEN blue software v.3.9. Antibodies and dilution factors are listed in Supplementary Table 3.
Immunohistochemistry and quantification of mouse retinal whole mounts
Mice were perfused transcardially with ice-cold 4% PFA. Eye orientation was marked in situ before enucleation, and eyes were post-fixed in 4% PFA for 1 h and transferred to ice-cold PBS. Retinas were dissected as whole mounts under a microscope.
Retinas were washed in PBS containing 0.5% Triton X-100 and permeabilized by freezing at −70 °C for 15 min. After thawing and rinsing, retinas were incubated overnight at 4 °C with primary antibodies in blocking buffer containing PBS, 2% Triton X-100 and 2% normal donkey serum. Secondary antibodies were applied for 2 h at room temperature in PBS containing 2% Triton X-100. Retinas were then washed and mounted with the vitreal surface facing upward. Antibodies are listed in Supplementary Table 3.
Retinal whole mounts were imaged using a Zeiss Axiocam 705 mono microscope. GFP-positive RGCs were quantified semi-automatically in Fiji (ImageJ, v.2.14.0). Background subtraction corrected uneven illumination, and contrast enhancement improved image quality. Images were thresholded using the default autothreshold method, converted to binary masks and processed with Despeckle and Watershed functions. Particle analysis included objects measuring 30–300 pixels with circularity between 0.4 and 1.0.
Luxol Fast Blue staining for spinal cord myelination
Myelination was assessed by Luxol Fast Blue staining of transverse sections from the dorsal columns of cervical, thoracic and lumbar spinal cord regions, as previously described73. Slides were scanned with a NanoZoomer 2.0-RS digital slide scanner and viewed with NDP.view2 software (Hamamatsu).
A customized Fiji (ImageJ, v.2.14.0) counting mask was used to measure Luxol Fast Blue-positive axonal area in spinal-cord white matter. Positive area was normalized to the total analysed dorsal-column area.
Western blot immunoblotting
Spinal cords from healthy and EAE mice were homogenized in 2 ml radioimmunoprecipitation assay buffer containing 50 mM Tris, 150 mM NaCl, 0.5 mM EDTA, 10% SDS, 1% NP-40, 10% sodium deoxycholate and protease and phosphatase inhibitor cocktails (cOmplete, Sigma-Aldrich, 11836170001). Lysates were incubated for 30 min at 4 °C on a rotating wheel and centrifuged for 5 min to remove debris.
Protein concentrations were determined using the Pierce BCA Protein Assay Kit (Thermo Fisher Scientific, 23228 and 23224). Equal amounts of protein (25 µg) were separated by SDS–PAGE (NuPAGE, NW04125BOX), transferred to polyvinylidene fluoride membranes and blocked with 5% BSA for 1 h at room temperature. Membranes were incubated overnight with primary antibodies at 4 °C, followed by horseradish-peroxidase-conjugated secondary antibodies for 1 h at room temperature. Chemiluminescence was detected with WesternSure PREMIUM Chemiluminescent Substrate (LI-COR, 926-95000). Antibody information is provided in Supplementary Table 3, and uncropped membranes are shown in Supplementary Fig. 18.
Immune-cell isolation and flow cytometry
Spinal cords were collected after transcardial PBS perfusion and dissociated into single-cell suspensions using 1 mg ml−1 collagenase A (Roche, 11088793001) and 0.1 mg ml−1 bovine pancreatic DNase I (Merck Millipore, 260913) with a gentleMACS Octo Dissociator (Miltenyi Biotec; program Multi_F).
Cell suspensions were passed through a 70 µm strainer, and immune and glial cells were enriched on a discontinuous density gradient. After centrifugation at 2,500 rpm for 30 min at 4 °C, cells were collected from the interface between 30% and 70% Percoll.
Fc-receptor binding was blocked with TruStain FcX anti-mouse CD16/32 antibody (BioLegend, 101320) for 10 min at 4 °C. Surface antibodies were applied in Brilliant Stain Buffer (BD Biosciences, 563794) for 30 min at 4 °C. Dead cells were excluded with Zombie Green Fixable Viability Stain (BioLegend, 423112). For intracellular CD206 and CD68 staining, cells were fixed for 20 min at room temperature with fixation buffer (BioLegend, 420801) and incubated with anti-CD68 antibody in permeabilization wash buffer (BioLegend, 421002).
Absolute numbers of CD45high leukocytes and CD45med microglia were determined using Precision Count Beads (BioLegend, 424902). Data were acquired on a BD Symphony A3 flow cytometer and analysed with FlowJo v.10.9.
Viral vectors for neuronal gene expression
AAV and lentiviral vector construction
All primers and oligonucleotides are listed in Supplementary Table 4. Synthetic minimal CFH-derived genes were synthesized by Twist Bioscience. In mHDM-FH, N-terminal SCR1–5 domains were connected to C-terminal SCR18–20 domains through an SGSG linker. Mouse CFHR-1 amino acids 24–152 were included as a dimerization unit to extend protein half-life. The mHDM-FH sequence was based on a previous study31.
CR2-FH comprises a complement receptor 2 fragment fused to the N-terminal SCR1–5 domains of CFH. The construct contains the mouse IgG κ-light-chain signal peptide, amino acids 1–257 of mature mouse CR2, a (G4S)2 linker and the five N-terminal SCR domains of mouse factor H33. Both sequences were codon optimized for mouse-cell expression. A Pfl23II site was added at the 5′ end, and BamHI and SalI sites were added at the 3′ end.
Clonal genes were digested with Pfl23II and SalI and ligated into a customized pAAV backbone containing an hSYN1 promoter derived from pAAV-hSYN1-mTurquoise2 (gift from V. Gradinaru, Addgene 99125), an eGFP:KASH cassette (AAV:ITR-U6-sgRNA(backbone)-hSyn-cre-2A-EGFP-KASH-WPRE-shortPA-ITR, gift from Feng Zhang, Addgene 60231) and a P2A-T2A cleavage peptide. A stop-codon control plasmid was cloned downstream of the P2A-T2A sequence.
For lentiviral expression in primary neurons, genes were digested with Pfl23II and BamHI and inserted into a custom lentiviral backbone containing an hSYN1 promoter, mScarlet cassette and P2A cleavage peptide. Full-length mouse Cfh was generated from two PCR fragments amplified from mouse kidney cDNA using primers containing Pfl23II/XbaI or XbaI/SgsI sites. Fragments were assembled by triple ligation into the same lentiviral backbone.
These constructs were used to produce mHDM-FH and CFH variants with primers listed in Supplementary Table 4. Signal-peptide-deficient constructs were generated with forward primers excluding the first 54 base pairs. SCR20-deficient constructs used reverse primers complementary to SCR19 and were inserted upstream of the dimerization domain. Two KDEL sequences were incorporated into reverse primers to retain proteins in the secretory pathway. For SCR20-only expression, SCR20 was placed downstream of an Lck transmembrane domain for retention at the cell membrane. The Lck domain was amplified from PZac2.1 hSYN1-Lck-13×Linker-BioID2-BioID2-HA (gift from B. Khakh, Addgene 176854).
The lentiviral IFNγ overexpression construct was generated as previously described37. Conditional neuronal knockouts in culture were generated with pAAV-hSYN1-cre-P2A-dTomato (gift from R. Larsen, Addgene 107738). Conditional mouse knockouts used pENN.AAV.hSYN.HI.eGFP-cre.WPRE.SV40 (gift from J. M. Wilson, Addgene 105540).
TurboID sequences were amplified from pAAV-TBG-Cyto-TurboID (gift from J. Long, Addgene 149414) with primers adding a C-terminal HA tag. Inserts were placed into hSYN1 lentiviral backbones using NheI/BamHI for Turbo-Cyto and NheI/EcoRI for Turbo-ER. TurboID-ER included an N-terminal signal peptide and C-terminal KDEL motif separated by a GGGGS linker. For in vivo delivery, TurboID-ER was transferred into an hSYN1 pAAV backbone using NheI and SgsI.
The constructs used were Lenti-hS-mmCfh-P2a-mScarlet, Lenti-hS-mmCfhΔ20-P2a-mScarlet, Lenti-hS-mScarlet-P2a-mmCfh-2×KDEL, Lenti-hS-mmCfhΔSP-P2a-mScarlet, Lenti-hS-mmCfhΔ20ΔSP-P2a-mScarlet, Lenti-hS-mScarlet-P2a-CR2-FH, Lenti-hS-mHDM-FH-P2a-mScarlet, Lenti-hS-mHDM-FHΔ20-P2a-mScarlet, Lenti-hS-mScarlet-P2a-mHDM-FH-2×KDEL, Lenti-hS-mScarlet-P2a-mHDM-FHΔ20-2×KDEL, Lenti-hS-mHDMΔSP-FH-P2a-mScarlet, Lenti-hS-mHDM-FHΔ20ΔSP-P2a-mScarlet, Lenti-hS-Lck-scr20-P2a-mScarlet, Lenti-CMV-mmIfng-P2a-mScarlet, Lenti-hS-mScarlet, Lenti-CMV-mScarlet, Lenti-hS-TurboID-ER, Lenti-hS-TurboID-Cyto, pAAV-hS-eGFP(-KASH)-P2a(-T2a)-mHDM-FH, pAAV-hS-eGFP-P2a-mHDM-FHΔ20, pAAV-hS-eGFP-P2a-mHDM-FHΔSP, pAAV-hS-eGFP-P2a-Lck-scr20, pAAV-hS-eGFP(-KASH), pAAV-hS-eGFP-KASH-P2a-T2a-CR2-FH and pAAV-hS-TurboID-ER. All final constructs were validated by Sanger sequencing.
Lentiviral vector production
VSV-G-pseudotyped lentiviruses were produced in HEK293T cells seeded at 6 × 10⁴ cells per cm2 1 day before transfection. Cells were cultured in high-glucose DMEM with glutamine and transfected with transfer plasmid, pMDLg/pRRE, pRSV-Rev and pMD2.G helper plasmids. Each 10 cm plate received 15 µg transfer plasmid, 10 µg pMDLg/pRRE, 5 µg pRSV-Rev and 2 µg pMD2.G.
Plasmids were mixed in 1× HEPES-buffered saline and 125 mM CaCl2 and added to cells with 25 µM chloroquine diphosphate. Medium was replaced after 12 h. Supernatant was harvested 36 h after transfection, filtered through a 0.45 µm PES filter, snap frozen and stored at −80 °C.
For CFH-expression lentiviruses, particles were concentrated with the Lenti-X Concentrator (Takara Bio, 631478). Primary neurons were transduced at 5–8 days in vitro with 70–80% efficiency, confirmed by fluorescent-protein expression.
AAV production
The PhP.eB serotype was selected because of its high efficiency for central nervous system transduction74. AAV particles were produced according to standard procedures established by the UKE vector facility38,75.
Neuronal cell culture and molecular assays
Primary mouse neuronal cultures
Primary cortical cultures were prepared from euthanized pregnant C57BL/6J or Cfhflox/flox mice. Cortices were isolated, dissociated and plated at 6 × 10⁴ cells per cm2 on 5 µM poly-d-lysine-coated wells (Sigma-Aldrich). Cells were maintained in PNGM medium (Lonza, CC4461) at 37 °C, 5% CO2 and 98% relative humidity. Experiments were performed between 14 and 23 days in vitro.
To generate Cfh-cKO neurons, cultures from Cfhflox/flox mice were transduced at 4 days in vitro with PhP.eB AAV encoding Cre recombinase under the hSYN1 promoter (Addgene 107738) at a multiplicity of infection of 30,000. Transduction efficiency was approximately 70–80%, based on eGFP expression. Chronic IFNγ exposure was induced with a CMV-driven Ifng-expressing lentivirus at 7 days in vitro37. mScarlet or GFP-only vectors served as controls.
RNA sequencing of neuronal Cfh-cKO cultures
RNA from neuronal Cfh-cKO and control cultures, with or without glutamate stimulation, was extracted using the RNeasy Mini Kit (Qiagen). Libraries were prepared with the TruSeq Stranded mRNA Library Prep Kit (Illumina) and sequenced on a NovaSeq 6000 platform to generate 150 bp paired-end reads.
Reads were aligned to the mm10 mouse reference genome (2020A) using STAR v.2.5.2b. Gene-level overlaps were counted with featureCounts v.1.5.1. Differential expression was analysed with DESeq2 v.1.44, with genes meeting an FDR-adjusted P value < 0.05 considered significant. Gene lists were annotated using biomaRt v.2.60.1.
AUCell v.1.26 was used to compare a transcriptional excitotoxicity signature among WT control, Cfh-cKO control, glutamate-stimulated WT and glutamate-stimulated Cfh-cKO cultures. The excitotoxicity signature comprised genes significantly upregulated in glutamate-stimulated WT cultures compared with WT controls. GSEA was also performed using the 200 most highly induced genes in the Cfh-cKO glutamate versus WT glutamate comparison.
Pfa1 and HEK293T cell lines
Immortalized mouse fibroblast Pfa1 cells were obtained from the originating laboratory at the Conrad laboratory, Helmholtz Institute, and were not further authenticated41,76. HEK293T cells were purchased from an authorized supplier (ACC 635, DMSZ). Both cell lines were cultured in high-glucose DMEM containing 4.5 g l−1 glucose (Gibco, 21969-035), 10% FBS, 2 mM l-glutamine and 1% penicillin–streptomycin at 37 °C and 5% CO2.
Cells were passaged at approximately 80% confluence and routinely tested for mycoplasma. For experiments, cells were seeded at 30,000 cells per cm2 1 day before stimulation. Treatment compounds and exposure times are specified in the relevant figure legends. Mycoplasma testing was performed with the VenorGeM Advance kit (Minerva Biolabs, 11-7024); all cell lines were negative.
Neuronal cell viability assays
RealTime-Glo MT Cell Viability Substrate and NanoLuc Enzyme (Promega, G9711) were added to neuronal cultures and incubated for 5 h before treatment to equilibrate the luminescence signal. Toxicity was assessed following exposure to 50 μM glutamate, 100 nM MDA (Sigma-Aldrich, 63287) or 6 µM RSL3 (Sigma-Aldrich, SML2234). Luminescence was measured immediately before treatment and after 15 h using a Spark 10 M multimode plate reader at 37 °C and 5% CO2.
At least four technical replicates were analysed per condition. Values were normalized to each well’s pre-treatment luminescence, then to the mean of control wells at each timepoint and to the maximal neuronal-death condition induced by 2 mM glutamate. Statistical comparisons used endpoint measurements.
For medium-change, CFH-antibody and IFNγ experiments, viability was assessed by condensed nuclear staining. Cultures were exposed to 50 µM glutamate, 100 nM MDA or 6 µM RSL3 for 10 h, with additional treatments applied 30 min before stress exposure where indicated. Hoechst 33342 was added at 20 µM for 1 h. Cells were washed twice with preconditioned medium and imaged using a Zeiss LSM 900 Airyscan 2 confocal microscope with a ×40 objective.
Fiji was used to create a nuclear mask and measure Hoechst fluorescence. Condensed nuclei were defined using a threshold equal to the mean control signal plus 2.5 s.d., providing an estimate of neuronal death and survival after treatment.
Reactive oxygen species imaging
Reactive oxygen species (ROS) generated by glutamate, MDA or RSL3 were measured with CellROX Green Reagent (Thermo Fisher Scientific, C10444). Neurons were treated with 50 μM glutamate for 2 h, 100 nM MDA for 10 h or 6 µM RSL3 for 10 h. CellROX Green was added at 5 μM after 30 min of stress exposure together with Hoechst 33342. Cells were washed twice with preconditioned medium and imaged at ×20 magnification using a Zeiss LSM 900 Airyscan 2 microscope. Nuclear CellROX fluorescence was quantified in Fiji.
BODIPY C11 imaging of lipid peroxidation
Lipid peroxidation was measured using BODIPY C11 (Image-iT, Thermo Fisher Scientific, D3861). Neuronal cultures were exposed to 50 µM glutamate, 100 nM MDA or 6 µM RSL3 for 10 h. Where indicated, additional treatments were applied 30 min before stress exposure. BODIPY C11 was added at 20 µM for 1 h with Hoechst 33342. Cells were washed twice with preconditioned medium and imaged with a Zeiss LSM 900 Airyscan 2 microscope using a ×40 objective.
Lipid peroxidation was quantified in Fiji. For lentiviral experiments, the oxidized-to-non-oxidized lipid ratio was calculated because mScarlet fluorescence was negligible or undetectable under the imaging conditions. For AAV-mediated Cre experiments, only oxidized-lipid mean fluorescence intensity was quantified because of the stronger tdTomato signal.
Time-resolved and subcellular analyses used 1 µM MitoTracker Deep Red FM, 1 µM ER-Tracker Blue-White DPX, 500 nM SiR-lysosome kit, 10 µg ml−1 Hoechst 33342 and 500 nM SiR700 actin kit. Dyes were applied at the indicated concentrations and washed out with BODIPY C11. Except for ER-Tracker experiments, all imaging included Hoechst staining. Oxidized BODIPY C11 signal overlapping with each organelle marker was quantified.
ELISA measurement of complement proteins
Peripheral blood was collected from the vena cava at euthanasia, centrifuged at 1,000g for 10 min at 4 °C and stored as plasma at −80 °C. Spinal cords were collected after ice-cold PBS perfusion and snap frozen in liquid nitrogen. Tissue was lysed in protein extraction buffer containing 100 mM Tris-HCl pH 7.4, 150 mM NaCl, 1 mM EGTA, 1 mM EDTA, 1% Triton X-100 and 0.5% sodium deoxycholate, supplemented with protease and phosphatase inhibitors and 1 mM PMSF immediately before use.
ELISAs were performed according to the manufacturers’ protocols. CFH was measured with the Mouse Complement Factor H ELISA Kit (Hycultec, RD-CFH-Mu); plasma was diluted 1:100,000 in PBS and culture supernatants were analysed undiluted. Total C3 was measured with the Mouse C3 ELISA Kit (Abcam, ab263884); plasma was diluted 1:100,000 in sample diluent NS and tissue lysates 1:1,000 in 1× cell extraction buffer PTR.
C3a was measured with the Mouse C3a ELISA Kit (MyBioSource, MBS2701721); plasma and tissue lysates were diluted 1:500 and 1:20, respectively. C5a was measured with the Mouse C5a DuoSet ELISA Kit (R&D Systems, DY2150); plasma and tissue lysates were diluted 1:100 and 1:10, respectively. Complement activation was estimated using the C3a/C3 ratio. Standard curves were generated with recombinant standards and fitted with four-parameter logistic regression.
Immunocytochemistry of neuronal cultures
Neurons were grown on 12 mm coverslips and treated with 50 μM glutamate, 100 nM MDA or 6 µM RSL3 for 6 h. Cells were fixed in 4% PFA for 15 min and blocked with 10% normal donkey serum containing 0.1% Triton X-100. Immunolabelling used the antibodies listed in Supplementary Table 3. Images were acquired with a Zeiss LSM900 Airyscan 2 confocal microscope and co-localization was analysed in Fiji. The percentage of CFH overlap was calculated relative to total intracellular CFH.
Proximity ligation assay for CFH and MDA-modified proteins
Interactions between CFH and MDA-modified proteins were assessed using the Duolink in situ proximity ligation assay (PLA; Merck) according to the manufacturer’s instructions. PLA antibodies generate a rolling-circle amplification signal when bound within approximately 40 nm of each other.
CFH–MDA interactions were detected using a Cfh-KO-validated goat anti-CFH antibody (Quidel, A313, 1:200) with the PLA Goat MINUS probe (Merck, DUO92006), and a rabbit anti-MDA-modified protein antibody (Abcam, ab27642, 1:200) with the PLA Rabbit PLUS probe (Merck, DUO92002). Signals were amplified using the Duolink far-red detection reagent (Merck, DUO92013). Actin co-staining identified neurons. Images were acquired with a Zeiss LSM900 Airyscan 2 microscope, and PLA puncta were counted per neuron.
TurboID proximity labelling
Proximity-dependent biotinylation was performed with TurboID targeted to the endoplasmic reticulum (ER) lumen or cytoplasm. TurboID-Cyto expressed HA-tagged TurboID under the hSYN1 promoter. TurboID-ER contained an N-terminal signal peptide, HA-tagged TurboID and a C-terminal KDEL ER-retention motif under the hSYN1 promoter.
Cells were transduced with the relevant lentivirus at 7 days in vitro. Proximity labelling was initiated with 50 µM biotin (IBA Lifescience, 6-6325-001) for 30 min at 37 °C. Cells were cooled on ice, washed with ice-cold PBS and lysed in denaturing buffer containing 8 M urea, 10 mM Tris and 100 mM NaH2PO4. Lysates were incubated overnight with streptavidin magnetic beads (Thermo Fisher Scientific, 88817). Beads were washed twice with RIPA buffer, once with 1 M KCl, once with 0.1 M Na2CO3, once with 2 M urea in 10 mM Tris-HCl pH 8.0 and twice again with RIPA buffer. Bound proteins were eluted in SDS sample buffer at 95 °C for 5 min before immunoblotting.
For in vivo proximity labelling, mice received 100 µl of PhP.eB AAV encoding ER-retained TurboID at 3 × 10¹¹ viral genomes in PBS by retrobulbar injection 3 weeks before EAE induction. For biotin labelling, chow was supplemented with 2.5 mg biotin per mouse per day beginning 3 days before termination. On the day of perfusion, mice also received 2.5 mg biotin in 100 µl PBS intraperitoneally.
Spinal cords were collected after transcardial perfusion with 10 ml ice-cold PBS. Tissue was homogenized twice for 1 min at 4 °C with intermittent cooling and cleared by centrifugation at 20,000g for 30 min at 4 °C. Supernatants were incubated overnight at 4 °C with equilibrated streptavidin magnetic beads (100 µl per sample). Beads underwent the same washing procedure described above. Proteins were eluted in 2× reducing sample buffer at 95 °C for 5 min before downstream analysis.
LC–MS/MS proteomic analysis
Samples were boiled at 95 °C for 5 min and probe sonicated. Digestion was performed semi-automatically in a 96-well LoBind plate using an Andrew+ Pipetting Robot (Waters). Disulfide bonds were reduced with 10 mM dithiothreitol for 30 min at 56 °C with shaking at 800 rpm, followed by alkylation with 20 mM iodoacetamide for 30 min at 37 °C.
Carboxylate-modified magnetic E3 and E7 speed beads (Cytiva Sera-Mag) were mixed 1:1 in LC–MS-grade water and added at a 10:1 bead-to-protein ratio using an SP3-based workflow77. Proteins bound to beads in 50% acetonitrile during shaking at 600 rpm for 18 min. Beads were washed twice with 80% ethanol and once with 100% acetonitrile.
Proteins were digested overnight at 37 °C with sequencing-grade trypsin (Promega) in 100 mM AmBiCa at a 1:100 enzyme-to-protein ratio while shaking at 500 rpm. Trifluoroacetic acid was added to 1%, and samples were shaken for 5 min. The peptide-containing supernatant was transferred to a new LoBind plate for LC–MS/MS.
Peptides were separated on a Vanquish neo UHPLC system using buffer A (0.1% formic acid in water) and buffer B (0.1% formic acid in 80% acetonitrile) at 0.4 µl min−1. Online desalting used a 300 µm × 5 mm C18 PepMap Neo trap cartridge, followed by a 25 cm C18 reversed-phase column (120 Å, 1.7 µm, 75 µm × 250 mm, Aurora Ultimate).
A 70 min gradient increased buffer B linearly from 3% to 34% over 60 min. MS/MS was performed on an Exploris 480 quadrupole-Orbitrap mass spectrometer using nano-electrospray ionization and data-independent acquisition. MS1 scans covered m/z 400–800 at a resolution of 120,000 at m/z 200, with automatic ion-accumulation time and an AGC target of 300%. DIA fragmentation used 12 m/z isolation windows with 1 m/z overlaps, producing 33 scan events. Fragmentation used higher-energy collisional dissociation at normalized collision energy of 30%, with Orbitrap resolution set to 60,000.
Data were searched with the CHIMERYS algorithm in Proteome Discoverer v.3.1.0.638 using the Inferys 3.0.0 prediction model and a reviewed Mus musculus SwissProt database. Carbamidomethylation of cysteine was fixed, methionine oxidation was variable and one missed tryptic cleavage was allowed. Peptides of 7–30 amino acids were included, with peptide and protein identifications accepted at FDR < 0.01.
Research ethics and approvals
All animal experiments complied with institutional guidelines and the German Animal Welfare Act. Approval was granted by the State Authority of Hamburg, Germany, under approval numbers 41/22, 53/24 and 40/25.
Human eye tissue obtained from Johns Hopkins University was covered by IRB00374036, “Characterizing mechanisms involved in pathological processes of retina neurodegeneration and optic neuritis present in MS in post-mortem samples”. Because human samples could no longer be linked to identifiable individuals, the analyses did not qualify as a “research project on humans” under § 9 para. 2 of the Hamburg Chamber of Commerce Act for the Health Professions. Consultation under § 15 para. 1 of the Professional Code of Conduct for Physicians in Hamburg was therefore not required.
Procurement, storage and distribution procedures for cortex tissue from the UK Multiple Sclerosis Tissue Bank at Imperial College London were approved by the relevant Multicentre Research Ethics Committee (08/MRE09/31+5).
Statistical analysis
All statistical analyses were performed in R v.4.4.1. Methods for snRNA-seq analysis are described in the relevant sections above. Detailed statistical procedures for experimental data are provided in the figure legends. Unless otherwise stated, data are presented as mean values. Two-group comparisons used unpaired two-tailed Student’s t-tests or Mann–Whitney U-tests. The reported n represents biologically independent samples rather than technical replicates. Clinical EAE scores were analysed using the Mann–Whitney U-test applied to the area under the curve for each animal.
Research reporting summary
Additional information about the study design and reporting standards is available in the Nature Portfolio Reporting Summary linked to this article.
Source: www.nature.com