


NASA Satellite Captures Three Pacific Hurricanes as El Niño Drives a Busy 2026 Season
When forecasters issued their spring 2026 hurricane outlook, they anticipated below-normal activity in the Atlantic Basin because of the ongoing El Niño pattern in the Pacific Ocean. The outlook also suggested that El Niño could produce above-average activity in the Northeast and Central Pacific basins. By early September, those predictions had largely proved accurate: the eastern Pacific hurricane season was unusually active, while the Atlantic remained relatively quiet near the climatological peak of hurricane season.
As of September 3, the Northeast Pacific had recorded 15 named storms and six hurricanes—well above average for that point in the season. In contrast, the Atlantic Basin had produced only five named storms and no hurricanes. Persistent unfavorable wind shear helped limit tropical development in the Atlantic.
El Niño typically warms ocean waters in the eastern and central Pacific, creating conditions that support more tropical cyclone activity there. At the same time, El Niño often suppresses Atlantic hurricane formation by altering large-scale atmospheric circulation and increasing wind shear. These changes can make it harder for Atlantic storms to organize and strengthen. Learn more about how El Niño can shift atmospheric circulation patterns.
NASA satellite images show three Pacific tropical cyclones
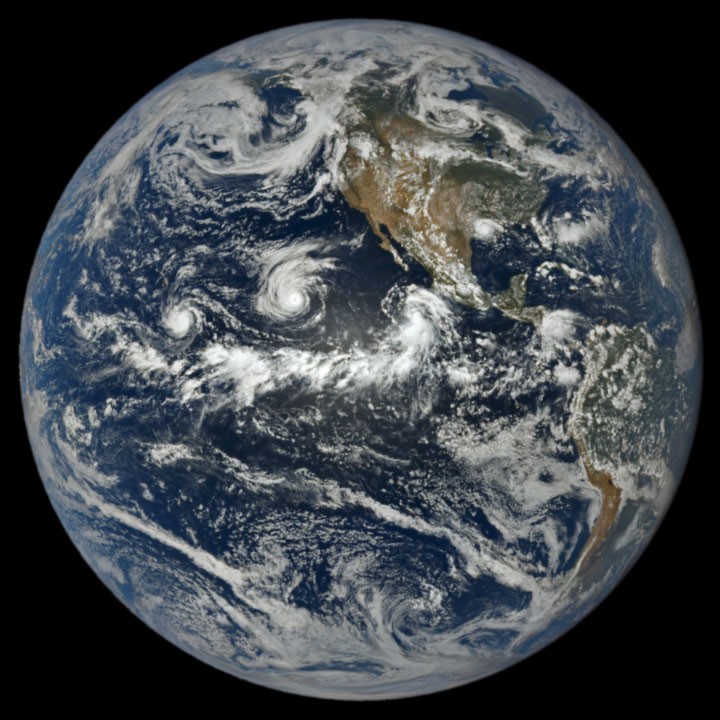
At 1:14 p.m. PDT, or 20:14 UTC, on September 1, NASA’s Earth Polychromatic Imaging Camera (EPIC), aboard the DSCOVR satellite, captured an extraordinary view of three tropical cyclones spinning over the Pacific Ocean. The image also shows the broad band of clouds and thunderstorms associated with the Intertropical Convergence Zone (ITCZ) south of the storms.
At the time of the observation, DSCOVR was approximately 1 million miles from Earth and about 93 million miles from the Sun. The satellite’s position allows EPIC to capture full-disk views of Earth and monitor large-scale weather systems, including tropical cyclones.
Lowell, Karina, and Marie strengthen in the Pacific
The three Pacific storms visible in the NASA image were Lowell, Karina, and Marie. Hurricane Lowell became the strongest of the trio, reaching Category 5 intensity for several hours on September 2.
Hurricane Karina formed thousands of kilometers to the east and reached Category 4 strength. Its development created a rare situation in which Category 4 and Category 5 hurricanes were present in the eastern Pacific at the same time. Read more about this unusual occurrence.
Tropical Storm Marie was rotating southwest of Baja California when EPIC captured the image. Although Marie was still a tropical storm at that time, it later strengthened as it moved northwest over the Pacific.
Atlantic tropical storm Edouard brings heavy rain to the Gulf Coast
While the Pacific was experiencing an unusually active hurricane season, the Atlantic produced Tropical Storm Edouard. Shortly after the storm made landfall, EPIC observed the system over Louisiana and Texas. Edouard brought torrential rainfall and strong winds, causing trees and power lines to fall.
Some locations received, or were forecast to receive, between 15 and 24 inches of rain. Meteorologists with the National Weather Service said that total precipitation could reach approximately 38 to 61 centimeters in affected areas. The rainfall created a significant flash-flood threat across parts of eastern Texas and Louisiana.
Accumulated Cyclone Energy highlights the Pacific-Atlantic contrast
As of September 3, the Atlantic Basin’s Accumulated Cyclone Energy (ACE) index stood at 4.4—approximately 9% of the average value for that date. According to Colorado State University statistics, ACE in the Northeast Pacific had reached 130, about 50% above average.
The ACE index combines the intensity and duration of tropical storms and hurricanes. Because it accounts for both factors, meteorologists use it to compare the overall strength of individual storms and entire hurricane seasons.
NASA data supports hurricane preparedness and recovery
NASA Earth-observing satellites provide valuable information before, during, and after tropical cyclones. Emergency managers can use satellite imagery to monitor storm development, estimate rainfall, identify flooding, and assess damage after landfall.
Through the NASA Worldview browser, users can explore near-real-time satellite imagery and track current hurricanes, tropical storms, flooding, and other hazards. The platform also provides access to additional NASA Earth science data products for disaster preparedness and response.
NASA Earth Observatory image by Lauren Dauphin, using data from DSCOVR EPIC. Story by Adam Voiland.
Sources
- AccuWeather (June 6, 2023), Experts say this metric is a more reliable way to quantify the true strength of the hurricane season. Accessed September 3, 2026.
- Colorado State University (September 3, 2026), Tropical cyclone activity in the Northern Hemisphere in 2026. Accessed September 3, 2026.
- NASA Earthdata, Hurricanes. Accessed September 3, 2026.
- NASA, El Niño. Accessed September 3, 2026.
- NASA Space Place (April 3, 2025), How do hurricanes form? Accessed September 3, 2026.
- National Hurricane Center (September 3, 2026), Tropical cyclone information. Accessed September 3, 2026.
- Newsweek (September 2, 2026), El Niño will change the look of this year’s hurricane season. Accessed September 3, 2026.
- NOAA (June 2, 2026), How will El Niño affect the Atlantic hurricane season? Accessed September 3, 2026.
- NOAA (May 21, 2026), NOAA 2026 Eastern Pacific Hurricane Season Outlook. Accessed September 3, 2026.
- Yale Climate Connections (September 2, 2026), Edouard delivers a huge flash-flood punch to East Texas. Accessed September 3, 2026.
Source: science.nasa.gov