


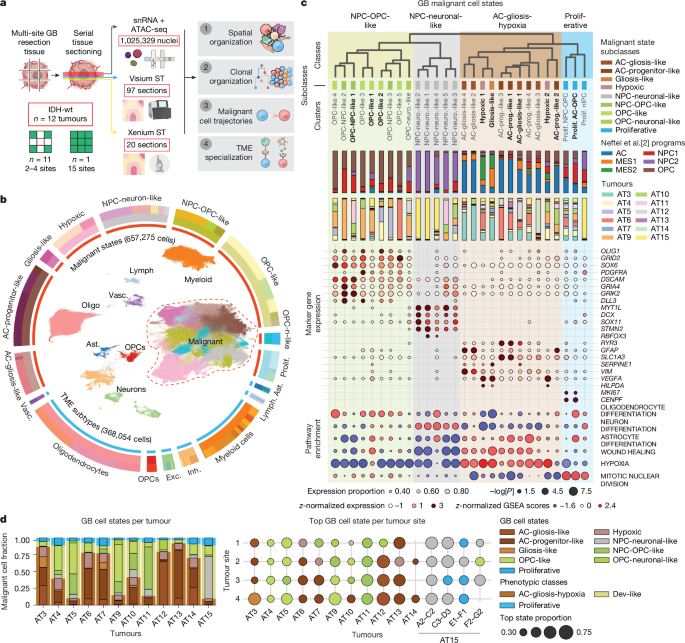
Researchers at Cambridge University Hospitals NHS Foundation Trust built a multi-omic and spatial atlas of glioblastoma (GB) tissue, combining single-nucleus RNA and chromatin-accessibility profiling, spatial transcriptomics, imaging, laser-capture microdissection and whole-genome sequencing. They also used patient-derived glioblastoma organoids (GBOs) to trace the behaviour of labelled tumour cells over time. The study integrated these datasets to identify malignant cell states, tumour microenvironments, genetic subclones and developmental trajectories, while using independent methods—including Xenium imaging, laser-capture sequencing and the SpaceTree computational model—to validate the results.
Patient samples and tissue processing
Patients with suspected GB were identified before surgery and consented to participate. Surgery took place at Cambridge University Hospitals NHS Foundation Trust. Written informed consent was obtained in accordance with the Declaration of Helsinki 2000, and tissue use was approved by the Cambridge Local Research Ethics Committee (REC 18/EE/0172). All patients underwent 5-aminolevulinic acid (5-ALA)-guided tumour resection under local protocols.
During tumour debulking, regions showing high fluorescence were identified, their locations recorded and tissue collected. Matched whole blood was obtained during surgery for germline characterization. Patient and sample characteristics are provided in Supplementary Table 1.
Tissue was collected from several regions of each tumour, targeting superior, anterior, posterior and middle sites where possible. Samples were washed in saline, embedded in optimal cutting-temperature medium (Scigen OCT Compound, 4586) and frozen in isopentane cooled to −75 °C with dry ice. Fresh-frozen blocks were sectioned on a Leica CX3050S cryostat.
Two or three 10-µm sections were used to assess RNA integrity, and another section was stained with haematoxylin and eosin (H&E) to assess morphology. RNA was extracted with the Qiagen EZ2 Automated RNA Extraction system and EZ2 RNA/micro-RNA Tissue Kit (959035), then evaluated using Agilent RNA ScreenTape. Only samples with an RNA integrity number above 7 were used for omic profiling.
Serial sectioning for multi-omic assays
- Single-nucleus profiling: A series of 50-µm sections, with a combined thickness of 500–900 µm depending on block size, was collected in prechilled homogenization tubes and kept on dry ice.
- Visium and Visium tissue optimization: Four 10-µm sections were mounted on 0.42-cm2 capture areas. Two sections were processed for Visium from each block. Larger samples were divided between capture areas. Two blocks were placed on each slide, which was stored at −80 °C in a desiccated slide mailer. Adjacent sections were assessed with H&E staining.
- Visium CytAssist: 10-µm sections were mounted on Superfrost Plus slides and stored at −80 °C.
- Xenium spatial transcriptomics: 10-µm sections were mounted on Xenium slides (10X Genomics, 3000941) and stored at −80 °C for up to four weeks.
- Laser-capture microdissection and whole-genome sequencing (LCM-WGS): Sections were collected on polyethylene naphthalate membrane slides (Leica, 11505158) and kept in the cryostat until transfer to −80 °C.
- Immunohistochemistry: 10-µm sections were mounted on Superfrost Plus slides and stored at −80 °C.
Histology and imaging
Sections were removed from −80 °C, air-dried and fixed in 70% ethanol for three minutes. They were stained with Gill II haematoxylin for seven seconds and aqueous 1% eosin for 10 seconds, then dehydrated through 70%, 70%, 100% and 100% ethanol and cleared twice in xylene. Coverslipped slides were scanned using a Hamamatsu NanoZoomer 2.0HT digital slide scanner.
A pathologist annotated digitized H&E sections using the taxonomy of the IVY Glioblastoma Atlas Project, which has established inter-neuropathologist agreement and clinical relevance. The annotations included the leading edge, infiltrating tumour, cellular tumour, necrosis, pseudopalisading cells around necrosis, the perinecrotic zone, microvascular proliferation and hyperplastic blood vessels. Two additional pathologists independently validated the annotations.
Single-nucleus sequencing
Fresh-frozen sections were homogenized in a glass Dounce homogenizer using nuclei isolation buffer containing MgCl2, NaCl, Tris, dithiothreitol, Tween-20, Nonidet P40, bovine serum albumin and digitonin, with Protector RNase Inhibitor. Tissue was homogenized with 10 strokes of pestle A followed by 10 strokes of pestle B.
Nuclei were passed through a 40-µm filter, collected at 500 relative centrifugal force and resuspended in 0.25 ml storage buffer containing phosphate-buffered saline, 1% bovine serum albumin and RNase inhibitor. Nuclei were counted with Trypan Blue and purified with a Percoll gradient before a second count.
10X Multiome library preparation
Two or three 10X reactions were prepared for each tumour site and loaded onto a 10X Chromium Controller using the Chromium Next GEM Single Cell Multiome ATAC + Gene Expression assay. Reactions targeted 5,000–10,000 nuclei. Complementary DNA amplification and 3′ gene-expression library construction followed the Chromium Single Cell 3′ Reagent Kits v.3 User Guide.
Libraries were paired-end sequenced on an Illumina NovaSeq 6000 with an S4 flow cell, targeting at least 100,000 read pairs per nucleus for each modality. Gene-expression sequencing used 28 cycles for read 1, 10 cycles for each index and 90 cycles for read 2. ATAC sequencing used 50 cycles for read 1N, 8 cycles for the i7 index, 24 cycles for the i5 index and 49 cycles for read 2N.
Spatial transcriptomics
Visium tissue optimization and sequencing
Sections on tissue-optimization slides were fixed in chilled methanol and H&E-stained according to the Visium Spatial Tissue Optimization User Guide (CG000238 Rev A). Initial tests evaluated seven permeabilization times at six-minute intervals and consistently identified 12–30 minutes as the optimal range. Subsequent experiments tested 12, 18, 24 and 30 minutes for each block, with two blocks per slide.
Brightfield images were captured with a 40× objective on a Hamamatsu NanoZoomer 2.0HT. Fluorescence images were acquired with a Cy3 filter, a 20× air objective and a 200-ms exposure on an Opera Phenix Plus.
Visium Spatial Gene Expression libraries were prepared according to the manufacturer’s instructions. Sections were fixed in cold methanol, H&E-stained and imaged before permeabilization, reverse transcription and complementary DNA synthesis using template switching. Dual-indexed libraries were generated using a 10X Genomics PCR-based protocol and sequenced on a NovaSeq 6000, targeting at least 50,000 read pairs per spot. The sequencing format was 28 cycles for read 1, 10 cycles for each index and 90 cycles for read 2.
Visium CytAssist
Visium CytAssist sections were dried at room temperature for five minutes, fixed in cold methanol at −20 °C for 30 minutes, H&E-stained and imaged. After destaining, human whole-transcriptome probe pairs were hybridized and ligated to tissue RNA. A CytAssist instrument transferred the probes from standard glass slides to Visium CytAssist Spatial Gene Expression slides with an 11-mm capture area.
Probe hybridization, ligation, release, extension, pre-amplification and library preparation followed the Visium CytAssist Spatial Gene Expression Reagent Kits User Guide (CG000495). Libraries were sequenced on an Illumina NovaSeq 6000 with paired-end dual indexing, targeting at least 70,000 read pairs per spot. FASTQ files were processed using Space Ranger v.2.1.0 and the GRCh38-2020-A reference.
Xenium spatial transcriptomics
Samples were processed with the Xenium Sample Preparation Kit according to the manufacturer’s protocols. Pretreatment included formaldehyde fixation and SDS and methanol permeabilization, followed by probe hybridization and rolling-circle product generation. After autofluorescence quenching and nuclear counterstaining, slides were loaded onto a Xenium Analyzer with the required decoding reagents and consumables.
For the Xenium Prime assay, sections underwent the same pretreatment followed by the Xenium Prime with Cell Segmentation protocol using the Xenium Prime 5K Human Pan Tissue and Pathways Assay Kit.
Laser-capture sequencing and immunofluorescence
For LCM-WGS, fresh-frozen tissue was fixed with PAXgene fixative, embedded in paraffin and sectioned at 10 µm. Additional 4-µm reference sections were prepared to identify the correct tumour regions. H&E-stained regions of interest were isolated by laser-capture microdissection and lysed with the Arcturus PicoPure Kit.
Low-input whole-genome libraries were generated from each lysate. Sequencing was performed on an Illumina NovaSeq platform using 150-base-pair paired-end reads, with a target coverage of 30×.
For multiplexed immunofluorescence, fresh-frozen GB sections were fixed in 10% neutral buffered formalin for 30 minutes. Endogenous peroxidase was blocked with 2% hydrogen peroxide in methanol. Slides were processed on a Leica Bond Rx platform, with antigen retrieval or stripping between antibodies using Epitope Retrieval Solution 1 at pH 9 and 95 °C for 20 minutes.
Two consecutive rounds of immunofluorescence labelled the rabbit primary antibodies AKAP12 and HIG2 (HILPDA). AKAP12 was detected with Opal 690 and HIG2 with Opal 520. Slides were counterstained with DAPI, mounted with ProLong Gold Antifade reagent and scanned using the Akoya PhenoImager HT whole-slide workflow.
Patient-derived glioblastoma organoids
Primary GB tissue was collected in Hibernate A medium and used within one hour to generate patient-derived GBOs using an established protocol. Meninges and blood vessels were removed, and tissue was dissected into pieces smaller than 1 mm. Tissue fragments were washed and placed in six-well plates containing GBO medium, then cultured on an orbital shaker at 88–92 rpm under standard conditions.
The GBO medium contained DMEM/F12, Neurobasal medium, HEPES, non-essential amino acids, GlutaMAX, B27, N2, penicillin–streptomycin and human insulin. β-mercaptoethanol was added to thawed medium immediately before use at a final concentration of 100 µM.
Glioma stem-cell lines and labelling
E25 and E30 glioma stem cells were cultured in defined medium containing DMEM/F12, HEPES, glucose, non-essential amino acids, penicillin–streptomycin, bovine serum albumin, β-mercaptoethanol, B27, N2, epidermal growth factor, basic fibroblast growth factor and laminin.
Because CD44 has been proposed as a marker of mesenchymal-like GB states, E25 and E30 cells were labelled with a CD44 magnetic antibody and separated into CD44-negative and CD44-positive fractions. The CD44-negative fraction was carried forward. Single-cell RNA sequencing before and after sorting showed that depletion slightly increased the proportion of OPC-like cells in E30 and did not alter the dev-like composition of E25.
CD44-negative E25 and E30 cells were transduced with an eGFP lentiviral vector at a multiplicity of infection of 0.25. Following titration, approximately 25% of cells were GFP-positive. Transduction lasted 72 hours and was followed by puromycin selection at 0.1 µg ml−1 for 72 hours. GFP-negative controls showed more than 95% cell death. Cells were expanded to 2–3 million cells.
Pre-engraftment single-cell sequencing
Glioma stem cells were processed with the Parse Biosciences Evercode Cell Fixation v.3 kit. Fixed cells were cryopreserved at −80 °C. Libraries were generated using the Evercode WT v.3 platform, targeting 100,000 cells in total and 5,000–10,000 cells per sample.
Cells underwent three rounds of split-pool barcoding, followed by pooling, lysis, cDNA capture, amplification, fragmentation, adapter ligation and a fourth indexing PCR. Libraries were sequenced on an Illumina NovaSeq 6000 S2 flow cell using 64-base-pair read 1, 8-base-pair i7 and i5 indexes and 58-base-pair read 2, targeting at least 30,000 reads per cell.
Engraftment and organoid sectioning
eGFP-positive, CD44-negative E25 and E30 cells were cocultured separately with GBOs. One million cells were added to 20 GBOs in one well of a six-well plate containing 2.5 ml of GBO medium supplemented with 1% Matrigel. Cultures were shaken at 88 rpm for the first 72 hours and then at 120 rpm. Media were changed every 48 hours.
GBOs were cultured for one, two or four weeks before cryopreservation. They were embedded in OCT, with approximately eight or nine organoids per cryomold, and serially sectioned at 10 µm. Approximately six sections spaced 100 µm apart, covering about 600 µm of each organoid, were processed for Xenium Prime.
Computational processing and cell-state annotation
Multiome reads were aligned to a custom genome combining the 10X Genomics GRCh38 3.0.0 pre-messenger RNA reference and the Cell Ranger ARC 2.0.1 ATAC reference. Cell Ranger ARC v.2.0.1 was used for initial quantification and quality control, followed by CellBender v.0.2.0 to correct background noise and identify empty droplets.
RNA data were processed with Scanpy v.1.9.3. Nuclei were removed if they had fewer than 500 detected genes, fewer than 1,000 total unique molecular identifiers or more than 10% mitochondrial reads. Scrublet v.0.2.3 was used for doublet detection, followed by a two-step filtering procedure based on median absolute deviation thresholds. Cells with more than 75,000 total UMIs were also removed.
ATAC data were processed with ArchR, retaining barcodes with more than 1,000 fragments and more than four transcription start sites. RNA profiles were then restricted to barcodes passing the ATAC filters so that both modalities used the same cells.
Libraries were integrated with scVI v.0.19.0 using 10X reaction as the batch variable and tumour ID, tumour site, reaction date and cell-cycle phase as covariates. The model used 50 latent dimensions and two hidden layers with 1,024 nodes each. Leiden clustering was performed on the resulting nearest-neighbour graph. Broad tumour-microenvironment (TME) populations—including oligodendrocytes, myeloid cells, neurons and lymphocytes—were annotated from marker-gene expression.
Malignant cells and gene-expression programs
Cell-specific copy-number alterations were inferred separately for each tumour with inferCNVpy, using a 250-gene window. Macrophages, oligodendrocytes, neurons and lymphocytes served as non-malignant reference populations.
Malignant cells were identified using copy-number signal from chromosome 7 gain and chromosome 10 loss, together with correlation to non-malignant copy-number profiles. A malignant-cell signal was defined as a copy-number signal above 0.02 and a correlation above 0.3. Clusters were also flagged as putatively malignant when at least 3% of their cells met the criteria, because fixed thresholds may miss malignant cells at lower coverage.
Main TME populations and malignant cells were reintegrated and subclustered independently. Malignant cell states were assigned using gene-module scores, mapping to a developing-brain atlas with scPoli, cluster marker genes and gene-set enrichment analysis with decoupler and MSigDB signatures.
For proliferative subclusters, tumour-specific gene-expression programs were derived with consensus non-negative matrix factorization (NMF). Factorization ranks from K = 10 to 25 were tested with 200 iterations per rank. Factors were retained and grouped into cross-tumour metaprograms according to shared gene membership.
Spatial mapping and tumour microenvironments
Visium data were processed with Space Ranger v.2.0 for standard Visium and v.2.1 for Visium CytAssist. Cell2location was used to estimate malignant and TME cell-state abundances in each spot from matched single-nucleus reference signatures. The model was trained separately for each tumour, with adjustments including 400 epochs for reference modelling, 6,000 epochs for spatial modelling, 30 cells per location and a detection-alpha value of 200.
NMF was applied to inferred cell-state abundances to identify tumour microenvironments (TMs), defined as reproducible patterns of cell-state colocalization. Factor numbers from 10 to 50 were tested with 10 restarts. The investigators selected 16 factors because this was the largest factor number that maintained high stability—above 0.8—across most tumours. Factors were grouped into microenvironments using hierarchical clustering and cosine distance.
Spatial intermixing was quantified with Shannon entropy. Spatial organization was assessed by calculating nearest-neighbour distances between spots with high abundance of cell states, TM factors or cell2fate modules. Distances were summarized using the bottom 25th percentile of nearest-neighbour distances.
Comparison with RCTD and Xenium
To compare methods, the investigators also deconvolved Visium data using robust cell type decomposition (RCTD) from the spacexr package v.2.2.1, using the same tumour-specific reference signatures. Broad spatial trends were largely conserved between cell2location and RCTD. Correlations were lower for rare states and higher for abundant states, with median correlations of 0.33–0.65 across all cell states and 0.61–0.85 for high-abundance states.
Applying NMF to RCTD predictions also reproduced the major TMs identified with cell2location. Median cosine similarity between corresponding TM cell-state compositions ranged from 0.48 to 0.86, with a global median of 0.63.
Xenium data were pseudobulked into 55-µm2 pseudospots to emulate Visium spots. In a tumour AT6 section, cell2location estimates correlated with single-cell Xenium assignments at r = 0.84 when the reference contained nine malignant subclasses and major TME types. With a more detailed reference containing 65 cell states, the correlation was r = 0.65. Abundant malignant states showed correlations of 0.68–0.90, whereas correlations for some fine-grained myeloid states were lower, including r = 0.31 for anti-inflammatory tumour-associated macrophages.
Analysis of public Visium data
Visium data from ref. 15 were downloaded from the Sequence Read Archive and Gene Expression Omnibus dataset GSE237183 and processed with Space Ranger v.2.0.0. Cell2location was used with a reference generated from the study’s full single-nucleus dataset. To fit the data into graphics-processing-unit memory, samples were randomly divided into three batches while maintaining a uniform sample distribution.
The resulting spatial trends were broadly consistent with the published metaprograms. Mesenchymal-hypoxic regions were enriched for stress-response macrophages and hypoxic cells, while OPC-like and AC-like regions corresponded to related OPC-like and AC-progenitor-like states. Vascular and macrophage-associated spots were enriched for vascular and monocyte states, respectively.
NMF analysis also reproduced major microenvironments, including dev-like OPC, dev-like neuronal or neuron-like, gliosis, hypoxia, vasculature, and white- and grey-matter-associated environments. Similarity between corresponding factors ranged from 0.46 to 0.92, with a global median of 0.69. Differences included the absence of a pial-layer environment and the presence of rare hypoxic and distinct immune environments in the comparison dataset.
Xenium panel design and processing
Three Xenium panels were designed for different applications. The first supplemented the 266-gene Xenium v.1 human brain panel with additional markers to validate GB architecture across 17 sections from eight tumours and 18 tumour sites. Marker selection used Spapros and spatial expression in Visium data. The panel was used on 19 sections from 18 blocks and seven patients.
The second was a fully custom 460-gene Xenium v.1 panel for validating fine-grained cancer-cell states and benchmarking cell2location. Gene selection was guided by cell-type biomarkers, cell–cell interaction analyses and Spapros optimization.
The third supplemented the Xenium Prime 5K Human Pan Tissue and Pathways Panel with 100 custom genes for GBO experiments. The added genes marked GB malignant states and TME populations, as well as proliferation, neuronal migration, astrocyte differentiation, extracellular-matrix remodelling, mesenchymal invasion and stromal-immune programs. eGFP probes were included to identify labelled cells.
For the first panel, nuclei were segmented from DAPI images and cell boundaries were defined using either a 15-µm expansion or the boundary of a neighbouring cell. For the second and third panels, segmentation used DAPI together with ATP1A1, E-cadherin, CD45, 18S ribosomal RNA, alpha-SMA and vimentin staining. Where boundary or interior staining was unavailable, nuclei were expanded by 5 µm or until another cell boundary was reached.
Xenium v.1 cell-by-gene matrices were filtered to remove cells with fewer than 10 detected transcripts and genes expressed in fewer than 10 cells. Tangram v.1.0.4 transferred cell-state labels from patient-matched single-nucleus data using 315 intersecting, non-zero genes.
Trajectory and subclone analysis
scFates was used independently for each donor to infer trajectories among AC-progenitor-like, AC-gliosis-like, gliosis-like and hypoxic cells. Clusters with fewer than 10 cells were removed. Principal components dominated by cell-cycle effects were excluded before fitting a principal tree. The AC-progenitor-like tip with the highest weighted fraction of cells was used as the root, and pseudotime was calculated with scFates.
RNA and ATAC multiome data were jointly used to infer subclones. RNA copy-number profiles came from inferCNV, while ATAC copy numbers were detected with epiAneufinder using a 1-MB window. Cells with fewer than 20,000 ATAC fragments were excluded. Clone matches between modalities were based on cell overlap and cosine similarity of copy-number profiles. The top 20% of matches were retained, and label spreading assigned clone probabilities to additional RNA cells. Most analyses used a confidence threshold of 0.9.
LCM-WGS reads were aligned to hg38 with BWA-MEM. Variants were called against matched normal blood using the Wellcome Sanger Institute pipeline. Copy-number alterations were called with ASCAT and Battenberg, with Battenberg results used for subsequent analyses. Substitutions were called with CaVEMan and filtered for alignment quality, clipping, read support, sequencing depth, mapping quality and base quality. A beta-binomial model removed germline and recurrent low-quality variants.
Sequoia was used to generate sample phylogenies, while PyClone-VI clustered variants into putative subclones. PairTree assessed relationships between clone populations and phylogenies. LCM samples were grouped according to clone frequencies using agglomerative clustering with Bray–Curtis dissimilarity and complete linkage. Subclonal diversity was quantified with Rao’s Q using a distance matrix based on cumulative mutational differences between phylogenetic lineages.
SpaceTree
The investigators developed SpaceTree to estimate the spatial distribution of multiome-inferred clones in Visium data. The model constructs a graph and uses a multi-task graph neural network to predict labels for each Visium spot. Its results were compared with cell2location and with LCM-derived clone clusters. Tumour purity was defined as the summed probability of malignant clones in a spot, and Shannon entropy of clone probabilities was used as a measure of clonal entropy.
Cell-fate analysis and survival associations
Cell2fate, a Bayesian generative model, was used to infer temporal expression modules and cell-specific positions along trajectories from spliced and unspliced counts generated with STARsolo v.2.7.10a. Analyses were run separately for each tumour clone, using 10X reaction as a batch covariate. High-quality runs required a maximum inferred cell-specific time above 20 and an average cell-state transition score above 0.25.
RNA-velocity modules were grouped by Jaccard distance and annotated using shared genes, MSigDB enrichment and malignant-state distributions. Selected modules were spatially mapped with cell2location in tumour sections where the associated multiome clone represented at least 30% of the sampled site.
Bulk RNA-sequencing count matrices from CPTAC and TCGA were downloaded from the Genomic Data Commons, aggregated and log-normalized with Scanpy. Samples were classified as enriched for a metaprogram when its expression score exceeded the 75th percentile. Kaplan–Meier analysis and log-rank tests were performed with the Python lifelines package to compare samples associated with early and late inferred trajectory times.
GBO lineage-tracing analysis
Parse single-cell RNA-sequencing FASTQ files were processed with the Parse Biosciences Pipeline v.1.5.0. Quality-control thresholds were similar to those used for the single-nucleus data. Xenium Prime matrices were filtered to remove cells with fewer than 150 transcripts.
eGFP-positive engrafted cells were identified from the bimodal distribution of log-transformed, cell-area-normalized eGFP counts using a two-component Gaussian mixture model. Stringent thresholds were defined from the eGFP-high component, resulting in primary criteria of more than 32 eGFP counts and/or eGFP counts representing more than 12% of the cell area.
Pre-engraftment Parse-seq data, Xenium GBO data and the GB cell atlas were integrated with scVI, using sample, study and cell-cycle phase as covariates. A scANVI model initialized from scVI was then used to transfer labels. Spatial organization along a periphery-to-core axis was measured by generating a concave hull around each organoid and calculating the Euclidean distance of each malignant cell from the organoid periphery.
Cell–cell communication analysis
Cell–cell communication analysis focused on TME-derived ligands and receptors expressed by malignant cell states in dev-like and gliosis-hypoxia microenvironments. TME states that colocalized with these malignant states were identified from Visium data across tumours.
LIANA+ v.1.2.0 was used with its consensus approach, integrating CellPhoneDB, Connectome, log2 fold change, NATMI, SingleCellSignalR and CellChat. Robust rank aggregation was performed with an expression-proportion filter of 0.05 and 1,000 permutations. Tensor-cell2cell v.0.7.4 then identified communication factors shared across tumours.
The analysis identified 80 unique interactions involving 37 ligands in dev-like microenvironments, 35 interactions involving 18 ligands in gliosis-associated environments and 63 interactions shared between the two, involving 28 ligands.
Additional information on study design is available in the Nature Portfolio Reporting Summary linked to the article.
Source: www.nature.com