


NASA Map Reveals How Human Activity Is Changing Earth’s Water Storage
Human activities are increasingly influencing how water moves through lakes, rivers, soils, glaciers and underground aquifers. A new NASA study shows where those impacts are strongest by using more than 20 years of satellite measurements of subtle changes in Earth’s gravity.
The research explains how and why terrestrial water storage has changed across the planet, beyond the effects of climate change alone.
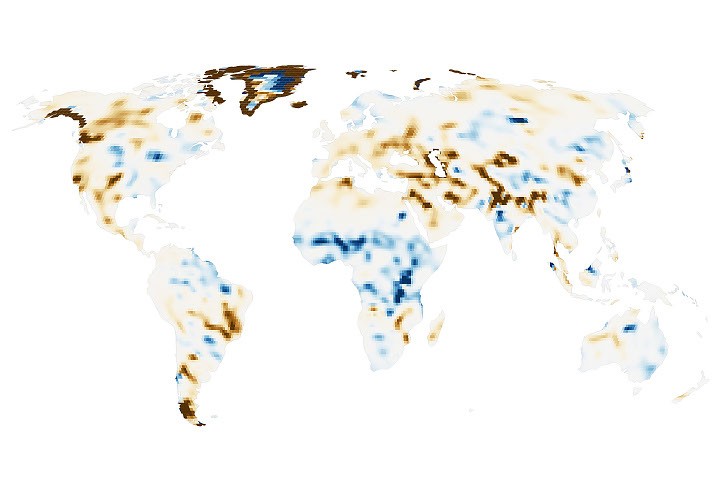
NASA map tracks global water storage changes
The map summarizes changes in surface water storage from April 2002 through November 2025. Researchers identified 40 regions where water-storage changes were consistent with human activities, including irrigation, reservoir impoundment and land-use change.
These activities were significantly associated with terrestrial water-storage trends on every non-polar continent except Australia.
In some areas, the influence of human activity was especially strong. “Across four continental regions, anthropogenic variables showed stronger relationships with storage trends than any climate variable,” said Mary Michael O’Neill, a hydrologist at NASA’s Goddard Space Flight Center and lead author of the study.
Groundwater depletion in California and India
The study identified strong human impacts in well-known agricultural regions such as California’s Central Valley and northern India. Farmers in both regions rely heavily on groundwater, contributing to declining water storage. In India, the decline is occurring faster than previously estimated.
Across several continents, groundwater-irrigated agricultural land was strongly associated with reduced surface water storage. In North America, these declines occurred in California’s Central Valley, the southern U.S. High Plains and Mexico’s Chihuahua region, where prolonged drought has increased farmers’ reliance on groundwater.
Groundwater pumping has also contributed to declines in northern India. The study’s detailed analysis showed a steeper downward trend than earlier estimates. Consistent with previous findings, retreating Himalayan glaciers accounted for only 15% of the water-storage loss in the region.
Some agricultural areas gained water storage
Not all agricultural changes were associated with declining water storage. Parts of sub-Saharan Africa experienced modest increases in areas where rain-fed agriculture expanded.
During the study period, natural savanna was replaced by millet cultivation. The water table rose despite below-average rainfall. A similar pattern appeared in Brazil’s Maranhão state, where soybean fields replaced forests and shrublands.
Researchers said these water-storage trends may be partly explained by the efficient water use of grains and legumes, as well as Indigenous practices that help direct water into shallow aquifers.
GRACE satellites reveal changes hidden from earlier maps
The data comes from NASA’s GRACE, or Gravity Recovery and Climate Experiment, mission and the GRACE Follow-On mission. Each mission uses two satellites flying in tandem.
When the lead satellite passes over an area with greater mass, small changes in gravity affect the distance between the two spacecraft. Onboard instruments measure those changes. Because water and ice are heavy and move over time, scientists can use the measurements to estimate where water is being gained or lost.
Satellite data is typically processed into monthly maps that show broad patterns in terrestrial water storage. However, the satellites have passed over large parts of Earth many times during more than two decades of observations.
By combining those satellite paths, researchers created long-term water-storage trends with five to 10 times more spatial detail than previous analyses. The trade-off is less temporal detail. The team then used statistical methods to assess the importance of climate and human-related factors and identify areas where human activities may be contributing to storage trends.
Matthew Rodell, associate director for hydrosphere, biosphere and geophysics at NASA’s Goddard Space Flight Center and one of the study’s authors, said the higher spatial resolution revealed human impacts that had previously been difficult to detect. The analysis also showed that some known trends were stronger than earlier estimates suggested.
Reservoirs and canals are reshaping regional water storage
The analysis also examined reservoirs and water-diversion projects. Hundreds of large reservoirs filled during the study period, but many were previously difficult to track because gravity measurements had relatively coarse spatial resolution.
The new analysis showed that the Boguchany Reservoir on Russia’s Angara River produced the strongest water-storage trend in non-polar North Asia. The reservoir was identified as the second-largest reservoir to be reclaimed during the 21st century.
The detailed map also resolves smaller reservoirs and other hydrological engineering projects. Increased water storage was recorded in Turkmenistan’s Karakum Desert, where the long and largely undelineated Karakum Canal crosses the region.
The canal diverts river water to support desert agriculture. As the water travels through the canal system, enough of it seeps into the ground to alter the desert’s water landscape. High-resolution maps make it possible to monitor these hydrological changes in remote areas where other measurement options may be limited.
NASA researchers plan to study local water-management impacts
In future research, O’Neill hopes to better understand how dams, diversions, irrigation and other forms of water management affect downstream water storage. The researchers also want to separate the effects of local activities from those occurring elsewhere.
“I would also like to recover more temporal images,” O’Neill said. One approach would be to combine high-resolution data with standard monthly products or apply modern techniques over shorter time periods.
More detailed time-based information could help scientists track how local water-storage trends respond to specific events, including droughts and policy changes.
Map and image credits
NASA Earth Observatory map with data by Michala Garrison, M. M. O’Neill and colleagues. The research uses data from NASA’s GRACE and GRACE Follow-On missions.
Astronaut photograph ISS065-E-111045 was retrieved June 13, 2021, using a Nikon D5 digital camera with a focal length of 1,150 millimeters. The image was provided by the ISS Crew Earth Observations Facility and the Earth Science and Remote Sensing Unit at NASA’s Johnson Space Center.
The photograph was taken by a member of the 65th Expedition as part of the International Space Station program, supported by the ISS National Laboratory. Astronaut photographs of Earth are made available to scientists and the public through NASA resources.
Story by Lindsay Dorman.
Source: science.nasa.gov