


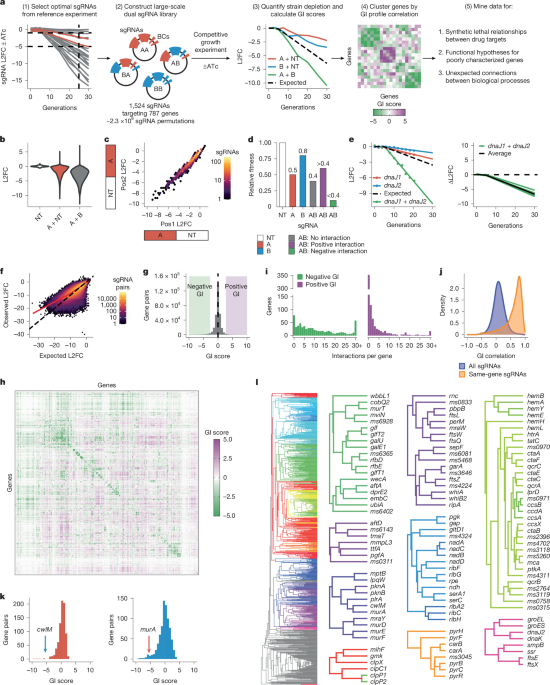
The study used engineered strains of Mycobacterium tuberculosis (Mtb), Mycobacterium smegmatis (Msm) and Escherichia coli to map genetic interactions, drug responses and protein associations. The researchers combined CRISPR interference (CRISPRi) libraries, pooled genetic-interaction screens, chemical–genetic profiling, protein-structure prediction, biochemical assays and mass spectrometry. Most Mtb strains were derived from H37Rv, Msm strains from mc2155 and E. coli strains from DH5α. Clinical Mtb isolates came from the BCCM/ITM reference collection and were identified by their ITM numbers.
Bacterial strains and culture conditions
Mycobacteria were grown at 37 °C in Difco Middlebrook 7H9 broth or on 7H10 agar supplemented with glycerol, Tween-80 and either albumin dextrose catalase (ADC) for Msm or oleic acid albumin dextrose catalase (OADC) for Mtb. Antibiotics were added when required: kanamycin at 10–20 μg ml−1, zeocin at 5–20 μg ml−1, hygromycin at 50 μg ml−1 and nourseothricin at 25 μg ml−1. Anhydrotetracycline (ATc), at 100–500 ng ml−1, was used to induce CRISPRi. Msm cultures were shaken in sealed vessels, whereas Mtb cultures were grown without shaking in tissue-culture flasks containing 5% CO2.
Strain and plasmid construction
Deletion and tagged strains
Mtb and Msm strains lacking cytochrome bd oxidase were derived from their corresponding wild types. The Mtb mutant carries a hygromycin-resistance cassette in place of the cydABDC operon, as described previously. In Msm, the ORBIT method was used to delete both the cydAB and appCB operons, which encode confirmed and putative cytochrome bd-type oxidases. PCR confirmed replacement of the endogenous loci, and the resulting strain carried hygromycin- and zeocin-resistance cassettes.
The Msm ΔqcrB and Δms2764 strains were also generated with ORBIT. Wild-type Msm carrying pKM444 was transformed with pKM464 and a gene-specific oligonucleotide to produce ΔqcrB. Δms2764 was made with a modified pKM464 in which the attP/attB core sequence was replaced by GCGTGCTC, together with a gene-specific oligonucleotide. Transformants were selected with 50 μg ml−1 hygromycin. Colony PCR confirmed deletion of qcrB using primers GTTCGACGTTTGGAATTCG and CCTGGTATCTTTATAGTCCTGTCG, and deletion of ms2764 using primers GAAACCTTGATCTCACCGCG and GACGAATTCACCTGCTCCAG.
An Msm strain expressing a 3×Flag tag at the C terminus of Ms2764 was produced with ORBIT using payload plasmid pSAB41 and a gene-specific oligonucleotide. Integrants were selected with 50 μg ml−1 hygromycin and verified by colony PCR using primers GAGGTGCCGAAATCGGCGAAGT and CCTGGTATCTTTATAGTCCTGTCG. All plasmids used in the study are listed in Supplementary Table 6.
CRISPRi constructs and complementation
CRISPRi plasmids were constructed as described previously using pLRL61 for Msm and pLRL58 for Mtb. These vectors support L5 integration of the CRISPRi system and differ by two nucleotides in the dCas9 Shine–Dalgarno sequence. The change was designed to reduce dCas9 translation in Mtb relative to Msm, reflecting the lower dCas9 expression needed for effective CRISPRi in Mtb.
Each backbone was digested with BsmBI, gel-purified and ligated to annealed oligonucleotides containing the appropriate single-guide RNA (sgRNA) sequence. Products were transformed into chemically competent DH5α-derived E. coli cells and selected on LB agar containing 50 μg ml−1 kanamycin. The sgRNA region was verified by Sanger sequencing. Confirmed plasmids were co-transformed with the L5 integrase helper vector pLRL19 into mycobacteria, with selection at 20 μg ml−1 kanamycin.
CRISPRi-resistant complementation constructs were assembled in the Tweety-integrating backbone pLRL91 using Q5 High-Fidelity 2× Master Mix and NEBuilder HiFi DNA Assembly. Silent mutations were introduced into the protospacer-adjacent motif (PAM) and seed sequence to prevent recognition by the sgRNA. All complementation alleles were expressed from the hsp60 promoter. Constructs were selected in E. coli with 100 μg ml−1 carbenicillin, verified by whole-plasmid sequencing by Plasmidsaurus and introduced into mycobacteria with the Tweety integrase helper vector pLRL62. Mycobacterial transformants were selected with 25 μg ml−1 nourseothricin.
Split-plasmid CRISPRi libraries
For the genetic-interaction (GI) libraries, the invariant and variable parts of the CRISPRi system were placed on separate plasmids that integrate at different chromosomal sites. Mycobacteria were first transformed with an invariant plasmid carrying dCas9 and then with a smaller variable plasmid carrying the sgRNA library. This design was intended to improve transformation efficiency and reduce the emergence of CRISPRi-resistant mutants by transforming the library into a clonal, dCas9-expressing population.
The invariant plasmids were pLRL252 for Msm and pLRL195 for Mtb. Each encoded dCas9 under an optimized synthetic TetR-regulated promoter, a mycobacterial codon-optimized Tet repressor, a Giles attachment site and zeocin resistance. The plasmids were co-transformed with the Giles integrase helper pLRL40, and transformants were selected with 20 μg ml−1 zeocin.
The variable-element backbone, pLRL389, encoded a synthetic TetR-regulated sgRNA promoter, an L5 integrase and attachment site, and kanamycin resistance. It was derived from pLRL210 by removing the dCas9 and TetR elements, changing a synonymous site in the kanamycin-resistance cassette, replacing the E. coli replication origin with a predicted higher-yield version and adding restriction and primer-binding sites. These included MfeI, XhoI, SalI and EcoRI sites, an 18-base-pair barcode position and binding sites for amplification and sequencing primers.
The standard, unsplit CRISPRi system was used for the CGI library RLC25. Its sub-libraries, RLC3 and RLC14, were cloned into pLRL2 and pLRL58, respectively.
Guide selection and off-target analysis
Because the GI libraries were limited to two guides per gene, guide selection emphasized minimizing off-target activity. A custom script searched for off-target matches containing at least 10 bp of perfect complementarity at the 3′, PAM-proximal end of the sgRNA next to a non-target PAM. Guides were assigned to four tiers: tier 1 had no off-target matches; tier 2 had no off-target matches against the non-template strand of a gene; tier 3 had no such matches with a PAM predicted to produce a fold repression of at least 42.2 in a luciferase knockdown assay; and tier 4 contained all remaining guides. The risk of off-target activity was expected to increase from tier 1 to tier 4.
The focus on non-template-strand matches reflected previous evidence that non-template-targeting guides are generally more effective than template-targeting guides. The PAM-strength threshold of 42.2 was selected because weaker PAMs rarely produced detectable off-target effects, based on depletion of guides targeting non-essential genes with off-target matches in essential genes.
Msm GI library
The Msm GI library was designed to target all essential genes and Msm homologues of Mtb genes classified as essential in vitro. Essentiality was defined as the union of transposon sequencing (TnSeq) calls and CRISPRi calls. CRISPRi essentiality was determined with a mixture model of the estimated maximum depletion rate, βmax. Guide selection was attempted for 834 genes.
An automated pipeline selected up to two sgRNAs per gene. For CRISPRi-essential genes, the first selection round required predicted log2-transformed fold change (L2FC) at 25 generations between −5 and −1 and no off-target matches. Later rounds permitted intergenic and template-targeting off-targets, expanded the L2FC range to −6 to −0.5 and allowed weak non-template-targeting off-targets. The final round imposed no off-target restriction. Guides closest to the logistic curve describing each gene’s expression–fitness relationship were prioritized.
For genes classified as non-essential by CRISPRi, guides with the highest predicted strengths were selected. The first selection round used off-target tiers 1–3, and the second allowed tier 4. Length isomers targeting the same PAM, computational outliers and guides that introduced restriction sites required for library construction were excluded. Minimal manual curation replaced guides with unexpected depletion and excluded genes for which only one tier-4 guide was available.
The final Msm library contained 1,524 sgRNAs targeting 787 genes, plus 10 non-targeting controls, for a total of 1,534 guides.
Mtb GI library
The Mtb GI library targeted all genes classified as essential in vitro and 72 non-essential genes predicted to interact with other library genes, contribute to infection or be under positive selection in clinical strains. Essentiality was defined from the union of TnSeq and CRISPRi calls, yielding 840 genes for which guide selection was attempted.
The same general automated approach was used to select up to two guides per gene. For CRISPRi-essential genes, the preferred predicted L2FC at 25 generations ranged from −6 to −0.5, with priority given to guides closest to the relevant expression–fitness curve. For non-essential genes, guides with the highest predicted strengths were selected. Computational outliers and guides introducing required restriction sites were excluded, followed by limited manual replacement of guides with unexpected depletion.
The final Mtb GI library contained 1,483 sgRNAs targeting 762 genes and 10 non-targeting controls, for a total of 1,493 guides.
Mtb library for CGI profiling
The Mtb library used for chemical–genetic interaction (CGI) profiling, RLC25, combined the previously described RLC3 library of strong guides targeting in-vitro non-essential genes with RLC14, a library of hypomorphic guides targeting in-vitro essential genes. Essentiality was based on the union of TnSeq and CRISPRi calls.
For RLC14, guide behaviour in a reference experiment was used to select up to 20 guides per essential gene. The selection emphasized the depletion-rate parameter βe, with a target near −0.14 while retaining some stronger and weaker guides. Twenty percentile bins from a normal distribution centred at −0.14 were used, with one guide selected per bin where possible. Empty bins were resampled until up to 20 guides had been chosen. The resulting library contained 14,354 guides targeting 748 genes and 646 non-targeting controls, for 15,000 guides.
Combining RLC14 with RLC3, which contained 16,681 guides, produced RLC25 with 31,143 sgRNAs: 30,306 guides targeting 4,005 genes and 837 non-targeting controls. Of these, 538 guides were shared between RLC3 and RLC14. RLC25 therefore contained 65,557 fewer guides than the reference Mtb library RLC12 while retaining genome-wide coverage.
Library production and transformation
GI library construction
The Msm and Mtb GI libraries were produced using a CombiGEM-based strategy. First, barcoded single-sgRNA constructs were generated. Restriction sites were then used to create a dual-sgRNA library containing every pairwise sgRNA combination, with the corresponding barcodes kept close together for high-throughput sequencing.
Genewiz synthesized the single-sgRNA libraries from selected sequences, each linked to a unique 18-base-pair barcode derived from a published barcode list (https://github.com/hawkjo/freebarcodes). Barcodes that introduced incompatible restriction sites were removed. Each sgRNA–barcode pair was cloned individually into pLRL389 to prevent template switching, preserve sequence fidelity and maintain even representation during pooling. EcoRI and SalI flanked the sgRNA–barcode cassette, while MfeI and XhoI occupied a spacer between the sgRNA and barcode. Genewiz verified the critical region by Sanger sequencing. The pooled libraries were named RLGGI004A for Msm and RLGGI003A for Mtb, and their barcode representation was checked by amplification and sequencing.
Digestion of the single-sgRNA libraries with MfeI and XhoI generated backbone fragments, while EcoRI and SalI generated insert fragments. Compatible overhangs allowed each sgRNA–barcode cassette to be inserted between the sgRNA and barcode of every backbone. The sgRNA and its barcode remained physically linked throughout the process. The strategy avoided amplification steps that could cause template switching and placed the two barcodes only six base pairs apart in the dual-sgRNA constructs.
For Msm library RLGGI004B, 36 μg of RLGGI004A was used for each of the backbone and insert digests. Gel-purified fragments were ligated overnight at 16 °C in 28 parallel 50-μl reactions, each containing 75 fmol of backbone and insert. After heat inactivation at 65 °C for 10 min, products were pooled and dialysed before transformation into E. coli. The Mtb library RLGGI003B was produced in the same way, except that eight ligation reactions were sufficient.
RLC14 was generated from an Agilent SureGuide Custom CRISPR Guide Library (G7555B). Fifteen 50-μl PCR reactions were run using 11 cycles of amplification. The amplified library was cloned into BsmBI-digested pLRL58 in 16 parallel 20-μl Golden Gate reactions. RLC3 had been cloned previously.
E. coli library amplification
RLGGI004B and RLGGI003B were transformed into MegaX DH10B T1R Electrocomp Cells (Invitrogen, C640003). For RLGGI004B, 75 transformations were performed using 25 tubes of cells. Recovery cultures were incubated at 37 °C with shaking for 1.5 h, pooled, diluted to an OD600 of 0.2 in LB containing 50 μg ml−1 kanamycin and distributed across six 2-l flasks. After overnight growth, plasmid DNA was isolated with a QIAGEN Plasmid Giga Kit. Deep sequencing confirmed the expected and balanced barcode pairs.
RLGGI003B was amplified using 30 transformations. The pooled recovery culture was spread on 50 large LB agar dishes containing 50 μg ml−1 kanamycin and incubated at 37 °C for 18 h. Transformants were collected by scraping. RLC14 was transformed using 16 individual transformations, and the recovered cells were pooled across 16 bioassay dishes.
Mycobacterial library transformation
Mycobacterial strains carrying the invariant CRISPRi elements were made electrocompetent after growth to late log phase, treatment with 200 mM glycine for one doubling time, and three washes with 10% glycerol. Cells were concentrated 100-fold.
For Msm, 93 transformations generated RLGGI004B. Each used 1 μg of plasmid DNA and 100 μl of electrocompetent cells, electroporated at 2,500 V, 700 Ω and 25 μF. Recovery cultures were incubated for three hours, selected in 7H9 containing 5 μg ml−1 zeocin and 20 μg ml−1 kanamycin, and expanded to an OD600 of approximately 3. Cultures were serially passaged for 10 generations, pooled and passed through a 10-μm cell strainer to remove clumps. A glycerol stock was stored at −80 °C, and a 10-OD600-unit sample was used for genomic DNA extraction and sequencing-based quality control.
The Mtb library was produced in two independent transformation rounds. The first used 100 transformations, each with 1 μg of RLGGI003B DNA in 200 μl of electrocompetent cells. After recovery, cells were selected for 22 days on 7H10 agar containing 20 μg ml−1 zeocin and 20 μg ml−1 kanamycin. During subsequent passaging, a fast-growing, carbenicillin-sensitive contaminant outcompeted Mtb. Two cultures were therefore restarted from glycerol stocks and passaged for 10 generations with 100 μg ml−1 carbenicillin. Blood-agar plating at each passage confirmed removal of the contaminant. The cured cultures were pooled, filtered through a 10-μm strainer and passaged for a further 10 generations without carbenicillin before Mtb experiment 1.
The second Mtb transformation round used 50 transformations. After recovery, selection and outgrowth were performed in liquid 7H9 containing 20 μg ml−1 zeocin and 20 μg ml−1 kanamycin. Cultures were expanded to an OD600 of approximately 1.2 and serially passaged and de-clumped as above. This library was used for Mtb experiment 2.
For RLC25, RLC3 was transformed into wild-type Mtb as described previously. Because RLC14 lacked L5 integrase, each transformation included 1 μg of RLC14 plasmid and 1 μg of the helper vector pLRL19. Equal-sized aliquots of the final RLC3 and RLC14 libraries were expanded separately, filtered and pooled at a 1:0.86 ratio corresponding to their relative library sizes. The final pool was adjusted to an OD580 of 1.0, frozen at −80 °C and assessed by genomic DNA sequencing.
Pooled CRISPRi screens
GI screens
GI screens followed a previously described pooled CRISPRi protocol, with larger culture volumes and more frequent passaging to prevent bottlenecks in the higher-complexity libraries.
For Msm, approximately 8 OD600 units of RLGGI004B glycerol stock, representing about 2.4 × 10⁹ cells and approximately 1,020-fold library coverage, were used to start cultures containing zeocin and kanamycin. Six 10-OD600-unit samples were collected for genomic DNA, and six generation-zero cultures were started at an OD600 of 0.3, providing approximately 1,912-fold coverage. Three replicate cultures received 100 ng ml−1 ATc and three were untreated. Samples were taken every two generations through generation 20. ATc-treated and untreated cultures were collected at times differing by no more than 0.5 generations to account for the growth defect caused by targeting essential genes. Cultures were back-diluted to an OD600 of 0.3 at each time point, with ATc replenished.
Mtb screens used T-225 vented tissue-culture flasks, OADC-supplemented 7H9 and 20 μg ml−1 zeocin. Experiment 1 used 100 ng ml−1 ATc, sampled every 2.5 generations through generation 30, and back-diluted to an OD600 of at least 0.2, corresponding to approximately 1,346-fold coverage. Samples through generation 10 were sequenced every 2.5 generations, and later samples every five generations. Experiment 2 used 500 ng ml−1 ATc, sampled at the same intervals as the Msm experiment and back-diluted to an OD600 of at least 0.25, corresponding to approximately 1,682-fold coverage.
CGI screens
CGI screens began with two 1-ml aliquots of RLC25, each representing one OD580 unit. The cultures were expanded for five days, pooled, passed through a 10-μm cell strainer and diluted to an OD580 of 0.5 in 75 ml of 7H9. ATc was added at 100 ng ml−1 to pre-deplete the targeted proteins, and the culture was divided among three flasks. After 24 h, triplicate cultures were inoculated at an OD580 of 0.05 in 3.3 ml of 7H9 containing ATc, 10 μg ml−1 kanamycin and the test compound dissolved in DMSO.
Each compound was tested at nine concentrations ranging from 0.03125-fold to twofold its predetermined minimum inhibitory concentration producing 90% growth inhibition (MIC90), together with a DMSO-only control. Cultures were incubated in 12.5-cm2 vented flasks for 14 days at 37 °C with 5% CO2, with ATc replenished on day 7. OD580 was measured to determine the experimental MIC90, and all cultures were collected for genomic DNA extraction.
Genomic DNA and sequencing library preparation
DNA extraction
For GI experiments, 10 OD600 units of culture were centrifuged and washed with PBS containing 0.05% Tween-80. Pellets were resuspended in TE buffer and phenol:chloroform:isoamyl alcohol, mechanically lysed with 0.1-mm silica beads in a Precellys Evolution homogenizer and centrifuged for phase separation. Mtb samples underwent a second extraction in the presence of 500 mM NaCl. RNA was removed with RNase A, residual phenol was removed by chloroform extraction and DNA was precipitated with sodium acetate and either isopropanol for Mtb or ethanol for Msm. DNA was washed with 70% ethanol and quantified with a Qubit 2.0 Fluorometer.
For CGI experiments, DNA was extracted with the Omega Bio-Tek Mag-Bind Universal Pathogen DNA Kit using a Geno/Grinder and a Hamilton Starlet liquid-handling system. Cultures were heat-inactivated at 80 °C for 1.5 h, mechanically lysed and treated with proteinase K. DNA was captured on Mag-Bind particles, washed with VHB and SPM buffers, eluted in EB buffer and quantified with a Thermo Fisher Scientific NanoDrop ND-8000 spectrophotometer.
Illumina library preparation
GI barcode regions were amplified from genomic DNA with NEBNext Ultra II Q5 Master Mix. Because the two barcodes were separated by only six base pairs, this design reduced template switching during amplification. For Msm and Mtb experiment 2, 4 μg of DNA was used, corresponding to approximately 5.6 × 10⁸ genome copies and 238-fold library coverage for Msm, and 8.9 × 10⁸ genome copies and 398-fold coverage for Mtb. Mtb experiment 1 used 2 μg of DNA, corresponding to approximately 199-fold coverage.
PCR consisted of 12 cycles of 98 °C for 10 s, 64 °C for 30 s and 65 °C for 20 s, preceded by 98 °C for 45 s and followed by 65 °C for 5 min. Each reaction contained a common forward primer and a uniquely indexed reverse primer. Approximately 350-bp products were purified with sparQ PureMag beads, quantified with a Qubit fluorometer and assessed on an Agilent 4200 TapeStation.
Samples were first pooled in equal volumes and sequenced on an Illumina MiSeq using 1 × 50-bp single-read sequencing and an 8-bp i7 index. A 10% PhiX Control v3 spike-in increased sequence diversity. A custom sequencing primer adjacent to the barcode cassette enabled sequencing of both barcodes and PhiX DNA. Samples were then rebalanced according to their MiSeq read counts and sequenced on an Illumina NovaSeq X Plus using the same sequencing conditions. Plasmid libraries were prepared similarly with 10 ng of DNA and 11 PCR cycles. Single-sgRNA libraries were validated on the Illumina MiSeq Nano platform with 25-bp reads. RLC25 libraries were prepared as described previously.
Quantification and statistical analysis
Guide depletion and GI scores
Sequencing reads were aligned to expected reference sequences using subread-align v1.6.0 with default parameters. For GI libraries, reads were assigned to barcode pairs and then to sgRNA pairs. For RLC25, reads were assigned directly to sgRNA sequences. Differences in sequencing depth were normalized with the trimmed total reads (TTR) method.
GI depletion was measured as the L2FC of mean guide-pair counts in ATc-treated samples relative to untreated samples. Pairs containing two non-targeting controls were used for a second normalization, setting their median L2FC to zero. Data points that flatlined or reached the detection limit of fewer than five mean reads were removed, and sgRNA pairs with fewer than three quality-controlled data points were excluded.
Depletion over time was modelled with a Bayesian two-line regression. The initial phase used intercept αl and slope βl, followed by a second phase at transition point γ with slope βe:
L2FC(G) = αl + βlG when G ≤ γ, and L2FC(G) = (αl + βlγ) + βe(G − γ) when G > γ.
GI scores were calculated by comparing the observed effect of simultaneously knocking down two genes with the additive expectation from the corresponding single-gene knockdowns. The deviation was summarized at generation 25. To account for floor effects, a generalized additive model was fitted with the expected L2FC as the predictor. The final GI score for a gene pair was the median corrected deviation across all guide pairs targeting the two genes.
The Bayesian models were fitted with Stan using cmdstan v2.35 and cmdstanpy v1.2.4. A mixture model containing a normal null distribution and a uniform alternative distribution was used to assess significance. Interactions with an alternative-hypothesis posterior probability above 0.5 were classified as likely interactions, and those above 0.95 as confident interactions.
Joint analysis of the two Mtb screens
The two independent Mtb GI screens were integrated with a joint Bayesian mixture model. Each gene pair was represented by its GI score from each experiment and the corresponding measurement uncertainty. The model included a null component and four interaction components: concordant negative, concordant positive and two discordant components in which the experiments had opposite signs.
The null was represented by a bivariate normal distribution near the origin, with a correlation parameter given a weakly informative prior. Per-pair measurement error was incorporated into the distribution. Interaction components were modelled with uniform densities across the observed score range, after winsorization at the 0.1st and 99.9th percentiles. Mixture weights used a Dirichlet(2, 2, 36) prior over concordant, discordant and null components, reflecting the expectation that most gene pairs do not interact.
For each pair, posterior probabilities were summarized as negative, positive, discordant or no interaction. A pair was considered likely when the largest interaction-class probability exceeded 0.5 and confident when it exceeded 0.95.
Clustering and pathway enrichment
GI profiles were hierarchically clustered with average linkage and Pearson correlation using SciPy. Descendant genes at each internal node were tested for Gene Ontology (GO) enrichment with GOATOOLS. GO annotations came from UniProt and were mapped to the go-basic ontology, using all genes in the GI map as the background. Fisher’s exact-test P values were corrected with the Benjamini–Hochberg procedure.
Nodes with a false-discovery rate below 0.005 for at least one biological-process term were designated key nodes. Each was labelled with its most significant GO term, subject to a GO-directed-acyclic-graph specificity constraint. Key nodes with parent gene sets sharing a Jaccard index of at least 0.8 were removed to reduce redundancy. Remaining labels were propagated through dendrogram branches to create functionally annotated trees.
Pathways were defined from KEGG and PATRIC resources with additional manual curation, as listed in Supplementary Table 4. Gene assignments were based on manual curation and an AI-assisted literature review using Claude Sonnet 4.5. Fisher’s exact test assessed associations between pathway pairs and significant GIs. Self-interactions were excluded, and P values were adjusted with the Benjamini–Hochberg method. The analysis was performed both with all pairs and after excluding possible polar effects, defined as pairs in which the genes were five or fewer genes apart.
Protein co-folding and interaction prediction
Selected proteins were co-folded with AlphaFold-Multimer v3 to predict complex structures and with AlphaFold3 to predict protein–protein interactions. Mtb sequences came from the H37Rv reference proteome (UniProt UP000001584). Msm sequences were translated from strain mc2155 (RefSeq NC_008596.1), with manual corrections for MSMEG5414, which was split into MSMEG5414A and MSMEG5414B, and four genes annotated as pseudogenes: folC (MSMEG4629), MSMEG1828, ahcY (MSMEG1843) and fusA1 (MSMEG1400). The corrected Msm sequences were provided in msm_essential_proteome.fa in the linked GitHub repository.
AlphaFold-Multimer models were run with LocalColabFold v1.5.5 on an NVIDIA L40S GPU and 16 24-GB CPUs, using three recycles and AMBER relaxation. AlphaFold3 inputs followed a modified pooled approach that prioritized smaller proteins to maximize the number of monomers per pool. Five predicted structures were generated for each input, and predicted TM scores (pTMs) and interface predicted TM scores (ipTMs) were averaged across models. ipTMs were corrected for total protein length.
Local Mtb predictions used AlphaFold3 v3.0.14 in an Apptainer/Singularity container on NVIDIA H100 80GB HBM3 GPUs. Multiple-sequence alignments were generated with ColabFold v1.5.5 and MMseqs2 18.8cc5c91 against UniRef30 (2023-02) and ColabFold environmental clusters (2021-08). Approximately 3,800 unique sequences were cached by SHA-256 hash to avoid recomputing identical alignments. AlphaFold3 was run with flash attention implemented by Triton, overlap resolution disabled and a single random seed, producing five diffusion-sampled structures per pool.
Predicted interaction counts were reported as graph-theory degrees. Degree columns were separated by monomer and accumulated across three ipTM confidence thresholds; for example, degree_low_webserver1 represented all interactions predicted for gene 1 at low or higher confidence using the web server.
Drug susceptibility and synergy assays
MIC assays
Compounds were dissolved in DMSO and dispensed in 384-well plates with an HP D300e digital dispenser using twofold dilution series. DMSO never exceeded 1% of the final culture volume and was kept constant across samples. Late-log cultures were synchronized at an OD600 of 0.2–1 and diluted to a starting OD600 of 0.01 or 0.05. Fifty microlitres of culture were added in triplicate to wells containing test compounds. Plates were incubated without shaking at 37 °C with 5% CO2.
OD600 was measured with either a Tecan Spark or Molecular Devices SpectraMax M2 plate reader 7–14 days after inoculation. Growth was expressed relative to the DMSO control. MIC90 and MIC50 values were calculated in R with the drm function in the drc package using a four-parameter log-logistic model. Values are reported as the mean ± s.e.m. of triplicates.
Checkerboard assays
Drug pairs were tested in 384-well checkerboards containing all combinations of twofold dilution series, each drug alone and a DMSO-only control. Combinations were tested in triplicate, with cultures seeded at an OD600 of 0.025. Bliss independence scores were calculated with SynergyFinder v3.14.0 using mean percentage viability values. The most synergistic area (MSA) and most antagonistic area (MAA) were defined as the contiguous 3×3 regions with the highest and lowest mean Bliss scores, respectively. Following recommended guidelines, pairs with an MSA mean Bliss score above 15 were considered synergistic, while pairs with an MAA mean Bliss score below −15 were considered antagonistic.
Kill-curve synergy assay
Wild-type H37Rv was diluted to an OD600 of 0.05, and 500 μl was added to each well of a 24-well plate. Vertex-49 was tested at 6.25 or 12.5 μM alone or with bedaquiline at 0.45 or 0.89 μM, or ethambutol at 3.61 or 7.21 μM. Cultures were incubated without shaking at 37 °C for six days, serially diluted from 10−1 to 10−7 and plated on 7H10 charcoal agar. Colonies were counted after 21 days.
Because a complete concentration matrix was not available, synergy was evaluated with the highest single-agent (HSA) method. The combination was considered synergistic if it produced more than 100-fold greater killing than the more active single agent at the same concentration.
Respiration and membrane-acidification assays
For the methylene-blue oxygen-consumption assay, cultures were grown for five days in 7H9-OADC containing 100 ng ml−1 ATc to pre-deplete target proteins. Cells were washed twice with PBS containing 0.05% Tween-80 and adjusted to an OD600 of 0.15. Four-millilitre screw-cap vials containing the cultures received 0.001% (w/v) methylene blue, were sealed and incubated at 37 °C with shaking at 60 rpm in an anaerobic pouch for three to four days. Photographs were used to determine whether cultures became clear, indicating intact respiration, or remained blue, indicating impaired respiration.
Inside-out membrane vesicle (IMV) acidification assays were performed with wild-type, ΔqcrB and Δms2764 Msm membranes. Membranes were suspended in buffer containing Tris-HCl, NaCl, MgSO4, 6-aminocaproic acid, benzamidine hydrochloride and glycerol. Acidification was measured in black 96-well plates with the ACMA dye, using NADH or succinate as electron donors. Assays contained either 10 μM Q203 in 2% DMSO or an equivalent DMSO vehicle. ACMA fluorescence was measured at 410 nm excitation and 480 nm emission at 25 °C for 20 min, followed by addition of 2 μM nigericin and a further 10 min of measurement. Fluorescence recovery was calculated as the absolute difference between the readings immediately before and 10 min after nigericin addition. Each experiment included at least three replicates.
Affinity purification and mass spectrometry
For protein purification, Msm was grown initially in 20 ml of supplemented 7H9 at 30 °C with shaking at 180 rpm. The preculture was used to inoculate 6 l of medium, which was grown for 48–72 h. Cells were collected at 6,500g for 20 min and resuspended in Tris-HCl buffer containing NaCl, MgSO4, benzamidine, aminocaproic acid and PMSF. Cells were lysed with an Avestin EmulsiFlex-C3 homogenizer at 20–25 kpsi.
The lysate was clarified at 39,000g for 30 min, and membranes were collected at 200,000g for 1 h. Membranes were resuspended in TBS and solubilized for 1 h with 1% dodecyl maltoside. After a further 200,000g centrifugation, solubilized proteins were captured on anti-Flag M2 affinity gel. The column was washed with TBS containing 0.05% dodecyl maltoside and eluted with 150 μg ml−1 3×Flag peptide. Eluted protein was concentrated with a 10-kDa molecular-weight-cutoff centrifugal concentrator.
For mass spectrometry, 10 μg of protein was reduced with dithiothreitol at 95 °C, alkylated with iodoacetamide in the dark and processed with S-Trap micro columns. Samples were digested with 4 μg trypsin for 1 h at 47 °C. Peptides were eluted with TEAB, formic acid and acetonitrile, dried and stored at −40 °C before data-dependent acquisition at the Network Biology Collaborative Centre at the Lunenfeld-Tanenbaum Research Institute.
SAINTexpress was used to score protein interactions. Peptide-level counts were summed for detected proteins in tagged and untagged samples, with two replicates per condition. Protein-level L2FC values were calculated, and the Bayesian model in SAINTexpress was used to estimate interaction probabilities and false-discovery rates.
Sensor and spotting assays
Sensor-spot assays were performed as described previously. For cell-spotting assays, cultures were grown and passaged twice to match optical densities. Cultures were diluted to an OD600 of 0.17, corresponding to approximately 50,000 cells per microlitre, and serially diluted tenfold. Two microlitres of each dilution were spotted onto 7H10 agar with or without ATc and with the required antibiotic selection. Images were collected after approximately 20 generations.
Additional information about the research design is available in the Nature Portfolio Reporting Summary linked to the article.
Source: www.nature.com