


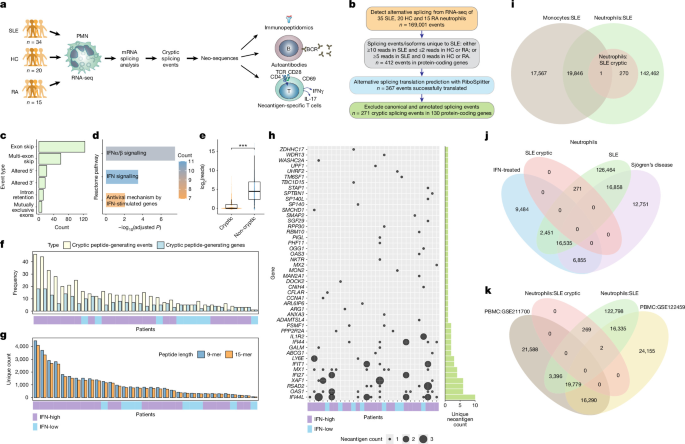
Researchers at the University of Washington analyzed blood from patients with systemic lupus erythematosus (SLE), healthy individuals and patients with rheumatoid arthritis to investigate disease-associated cryptic alternative splicing in neutrophils. Using strand-specific RNA sequencing, computational splicing analysis, peptide-binding predictions, mass spectrometry, antibody assays and T-cell experiments, they identified previously unannotated splicing events and evaluated whether the resulting peptides could be presented by major histocompatibility complex (MHC) molecules and recognized by immune cells. The study also examined potential RNA-binding-protein regulators of these events and compared the findings with publicly available peripheral blood mononuclear cell (PBMC) datasets.
Participants with SLE and disease controls
Freshly drawn blood was obtained from 34 adults with SLE, 20 healthy individuals and 15 patients with rheumatoid arthritis, who served as disease controls. Participants were recruited through the University of Washington Division of Rheumatology Biorepository for research studies at the University of Washington Medical Center in Seattle, Washington.
The study was approved by the institutional ethics board under protocol STUDY00006196. The research was conducted in accordance with all relevant guidelines and regulations, and all participants provided written informed consent in accordance with the Declaration of Helsinki.
The 34 patients with SLE represented the typical spectrum of disease seen at an academic medical center while receiving standard-of-care medication, as described in Supplementary Table 1. Eleven patients had active disease, defined as a Systemic Lupus Erythematosus Disease Activity Index (SLEDAI) score of at least 6. Twenty-four had inactive disease, with a SLEDAI score below 6 at the time of venipuncture.
Interferon-signature status was determined from the expression of 111 interferon-inducible genes in healthy donors. Patients whose average expression was above the 95th percentile of expression in healthy controls were considered interferon-signature positive. Twenty-six of the patients with SLE were interferon-signature positive. All healthy donors and patients with rheumatoid arthritis were interferon-signature negative.
Isolation of neutrophils and peripheral blood mononuclear cells
Polymorphonuclear (PMN) cells were isolated from freshly drawn venous blood within 1 hour of venipuncture by density-gradient centrifugation with PolymorphPrep, following the manufacturer’s instructions. The PMN fraction was more than 95% CD66b-positive and more than 85% CD15-positive.
The cells were washed and suspended in Hanks’ buffered salt solution at 107 cells per milliliter.
RNA isolation and sequencing
RNA was extracted with the Quick-RNA Whole Blood kit (Zymo Research, R1201). Cells were lysed in DNA/RNA Shield, and RNA was isolated according to the manufacturer’s instructions before being eluted in RNase-free water.
RNA samples were sent to the University of Washington Northwest Genomics Core for strand-specific, paired-end RNA sequencing. Each sample was sequenced to a depth of 50 million 101-base-pair reads.
Genome alignment and detection of alternative splicing
After sequencing-quality control, FASTQ files were aligned to the GRCh38 reference genome with STAR version 2.7.9a using the two-pass mode. This mode improves the detection of reads that map to novel splice junctions.
Following post-alignment quality control, sorted and indexed BAM files were analyzed with SplAdder version 3.0.3. The software combines alignment and annotation data to construct splicing graphs enriched for events supported by the RNA-sequencing data, and then quantifies those events.
SplAdder filters input reads according to their quality and provides four confidence levels. The analysis used the highest confidence setting. The software also applies event-specific criteria based on genomic coordinates and read coverage to confirm splicing events; only confirmed events were included.
Both annotated and novel events were detected. The analysis included six event types:
- exon skipping;
- alternative 3′ splice sites;
- alternative 5′ splice sites;
- intron retention;
- mutually exclusive exons; and
- multiple-exon skipping.
Discovery and translation of cryptic splice products
Cryptic alternative splicing in SLE was defined as a splicing event supported by sequencing reads in SLE neutrophils but absent or rarely supported in healthy individuals and rheumatoid arthritis controls.
The researchers used their established RiboSplitter methodology to translate splicing events into peptide sequences for downstream analysis and validation. Only splicing events with valid, unambiguous translations were used in subsequent analyses.
Because an alternative splicing event contains two isoforms, the analysis distinguished between cryptic splicing events, in which both isoforms were cryptic, and cryptic splicing isoforms, in which only one of the two isoforms was cryptic.
Strict filtering criteria were applied. A cryptic event or isoform had to meet one of two read-support requirements:
- at least 10 supporting reads in at least one SLE sample and no more than two supporting reads in each healthy or rheumatoid arthritis sample; or
- at least five supporting reads in at least one SLE sample and zero supporting reads in every healthy and rheumatoid arthritis sample.
Annotated splicing events and isoforms based on the GRCh38 reference genome were excluded. Cryptic peptides were also excluded if they matched a known annotated protein from the relevant gene. These criteria were intended to improve specificity for events that were cryptic and unique to SLE neutrophils.
Percent-spliced-in (PSI) values were consistently calculated for isoform 2. Consequently, a higher PSI always indicated a greater proportion of isoform 2, simplifying comparisons of which isoform predominated in each group.
MHC affinity prediction
Class I and class II MHC haplotypes were identified for each patient with SLE from the RNA-sequencing data using arcasHLA version 0.5.0. This method has been reported to be 100% accurate for class I MHC and more than 99.7% accurate for class II MHC.
Predicted MHC binding of cryptic SLE peptides was assessed with NetMHCpan-4.1 for 8- to 11-mer peptides and NetMHCIIpan-4.0 for 14- to 16-mer peptides. These tools use neural networks trained on binding-affinity and mass-spectrometry data.
Strong binding was defined as a predicted-affinity percentile rank of 2% or lower compared with a set of 100,000 random natural peptides, together with a predicted binding affinity below 500.
HLA immunoprecipitation and mass spectrometry
Class I MHC-bound peptides were immunoprecipitated using a previously described method. Antibodies against HLA-A, HLA-B and HLA-C, collectively recognized by the W6/32 antibody, or an isotype-control antibody were conjugated to protein A magnetic beads (Millipore-Sigma) at 1 mg per milliliter.
Lysates from 10 million cells were mixed with 100 microliters of anti-HLA beads or isotype-control beads. After washing, bound peptides were eluted with 0.2% trifluoroacetic acid, cleaned up with a C18 column and analyzed by liquid chromatography–mass spectrometry (LC–MS).
Mass spectrometry was performed at the University of Washington Proteomics Resource. Peptides were separated on a Thermo EASY-nLC system using a 120-minute gradient at 300 nl per minute. Mobile phase B increased from 6% to 45% over 89 minutes, followed by a ramp to 100% B and column re-equilibration. Samples were loaded at 2.5 microliters per minute.
Mass spectra were acquired on an Orbitrap Exploris 480 in positive-ion mode. Full scans were collected at a resolution of 120,000 at m/z 200 over an m/z range of 375–1575, with a normalized automatic gain control (AGC) target of 200%.
Targeted parallel-reaction-monitoring MS/MS scans were acquired at a resolution of 30,000 using higher-energy collisional dissociation fragmentation with a normalized collision energy of 30%. The isolation window was 1.6 m/z. Scheduled acquisition windows from 0 to 120 minutes were used for targeted precursor ions listed in the inclusion list.
Individual peptides were further analyzed with Skyline version 24.1.0.199. Chromatogram data were imported into and visualized with the 64-bit version of the software. The data were filtered to include only precursors with an idotp of at least 0.85 and a mass error below 10 parts per million. The researchers then visually inspected and confirmed the agreement between the daughter-ion peak shapes and retention times and those of the precursor spectra.
ELISA for neoantigen-specific IgG
Selected neoantigen peptides synthesized by Shanghai RoyoBiotechnology were coated onto medium-binding EIA plates at 1 ng per microliter in 0.1 M bicarbonate coating buffer at pH 9.5.
Plates were blocked with 2% bovine serum albumin (BSA) in 1× phosphate-buffered saline (PBS). Serum from patients with SLE and healthy donors was added to the blocked wells, followed by anti-human IgG conjugated to horseradish peroxidase.
Tetramethylbenzidine substrates were added, and the reaction was stopped with 2 N sulfuric acid. Absorbance was measured at 450 nm and 630 nm using a BioTek Synergy 2 plate reader.
Gene-expression analysis
Gene expression was quantified with the featureCounts function in Rsubread version 2.12.3. The average expression of the 111 interferon-stimulated genes was calculated for each sample.
SLE samples were classified as having a high interferon signature when their average interferon-stimulated-gene expression exceeded the 95th percentile of expression in healthy controls.
Comparison with PBMC splicing
To determine whether cryptic splicing events identified in SLE neutrophils also occurred in PBMCs, the researchers analyzed two publicly available RNA-sequencing datasets from patients with SLE.
GSE122459 included 20 patients with SLE and six healthy controls. GSE211700 included 20 patients with SLE and 10 healthy controls. The same analysis pipeline described above was used to align the data and detect alternative splicing events. The researchers then searched the PBMC datasets for cryptic splicing events identified in SLE neutrophils.
T-cell activation assays
PBMCs from patients with SLE were cultured at 2 × 10⁶ cells per well in 24-well plates containing RPMI 1640 medium (Gibco, 11-875-093) supplemented with 5% autologous patient serum. Serum was syringe-filtered through a 0.22-μm filter, heat-inactivated at 56 °C for 20 minutes and filtered again through a 0.22-μm filter.
Cells were stimulated with 5 μg per milliliter peptide pools containing three to six neoantigens. Interleukin-2 was added at 10 U per milliliter on days 4 and 9 (R&D, BT-002-050).
Positive controls were stimulated with phytohaemagglutinin-M at 10 μg per milliliter on day 1, followed by restimulation with CD3/CD28 Dynabeads on day 14. Tetanus toxoid served as an additional positive control in a subset of experiments.
On day 14, PBMCs were restimulated with individual peptides from each pool, and ELISPOT plates were coated with capture antibody overnight. After 18–24 hours of coculture, triplicate aliquots containing 3 × 10⁵ cells were resuspended in CTL medium supplemented with 1% L-glutamine (Gibco, 2503008), transferred to coated ELISPOT wells and incubated for four hours at 37 °C.
Spots were developed with the CTL-Human IFN-γ/IL-17 Double-Color ELISPOT Kit according to the manufacturer’s instructions and quantified with a CTL S6 Universal M2 reader. The remaining cells were collected for flow-cytometry analysis.
Flow cytometry
After 14 days of stimulation, cells were transferred to a 96-well round-bottom plate and washed with 1× PBS. To reduce nonspecific binding, cells were resuspended in 1× PBS containing 1% BSA and incubated at room temperature for 20 minutes.
Cells were stained for 30 minutes at 4 °C in the dark with fluorochrome-labeled monoclonal antibodies in 1× PBS containing 1% BSA. The antibody panel included:
- CD3 conjugated to Alexa Fluor 488 (BioLegend, 300320) at 1:50;
- CD4 conjugated to BV510 (BioLegend, 317444) at 1:50;
- CD8 conjugated to PE-Cy7 (BioLegend, 344712) at 1:50; and
- CD69 conjugated to APC (BioLegend, 985206) at 1:200.
Flow cytometry was performed on a CytoFLEX Flow Cytometer (Beckman Coulter), and the data were analyzed with FlowJo (Becton, Dickinson and Company).
T-cell receptor sequencing
After 14 days of culture with no peptide or with the neoantigens IFI44L-1 or IFI44L-2, 105 cryopreserved cells were sent to Adaptive Biotechnologies for the ClonoSeq procedure.
Approximately 20,000 resulting T-cell receptor beta (TCRB) sequences were sorted by template frequency. The four highest-frequency TCRB sequences in each sample are shown in Fig. 5j, together with the complementarity-determining region sequences of the most enriched receptor.
T-cell receptor alpha and beta pairs were sequenced from the same T-cell cultures used for TCRB sequencing, using TIRTL.
TCR retroviral transduction
TCR nucleotide sequences were synthesized by Twist and cloned into the MSGV1 retroviral backbone by Gibson Assembly (Telesis Bio). The sequences were codon-optimized for expression in human cells.
Human TCR constant regions were replaced with mouse TCR constant regions containing substitutions designed to improve surface expression and promote preferential pairing. TCR retroviral supernatants were generated by cotransfecting 293GP cells with the MSGV1 vector containing the relevant TCR sequence and an RD114 plasmid.
Two days after transfection, retroviral supernatants were collected and either used fresh or frozen at −80 °C. Transductions were performed on RetroNectin-coated plates (Takara) as previously described, using a modified T-FINDER cell line engineered to express both human CD8 and CD4 coreceptors.
Expression of the murine TCRβ constant region was measured by flow cytometry to determine transduction efficiency.
Functional assays with TCR cell lines
Transduced T-FINDER cells, at 5 × 10⁴ cells, were cocultured with 1 × 10⁵ patient-derived B-lymphoblastoid cell lines. The B-lymphoblastoid cells had been pulsed overnight with 10 μg per milliliter of the indicated IFI44 15-mer peptides or with a pool of 10-mer peptides spanning the IFI44 coding sequence.
After overnight culture, the percentage of GFP-positive cells among the murine TCRβ-expressing population was quantified by flow cytometry.
Immunofluorescence microscopy
Neutrophils from healthy donors and patients with rheumatoid arthritis or SLE were seeded onto glass-bottom 96-well plates and incubated at 37 °C for 30 minutes to allow them to adhere.
Cells were fixed with 4% paraformaldehyde for 15 minutes, washed three times with PBS and blocked overnight at 4 °C with 10% normal goat serum. Neutrophils were incubated overnight with the perforin 4G10 antibody at a 1:20 dilution.
After three PBS washes, cells were stained for 45 minutes with goat anti-mouse IgG conjugated to Alexa Fluor 647 (Thermo Fisher Scientific, A-21236) at a 1:1,000 dilution and with DAPI (Thermo Fisher Scientific, 62248). Cells were washed three additional times with PBS and resuspended in PBS.
Images were captured with a Keyence BZ-X810 fluorescence microscope and analyzed with Keyence Analyzer software. Control conditions included staining with primary antibody alone and secondary antibody alone in healthy, rheumatoid arthritis and SLE neutrophils.
Analysis of cryptic-splicing regulation with ENCODE shRNA-seq data
ENCODE short-hairpin RNA sequencing datasets generated in K562 cells were used to assess the potential effects of RNA-binding proteins on cryptic splicing.
Only paired-end, strand-specific, polyadenylated messenger RNA libraries were included. Reads were aligned and alternative splicing events were quantified using the pipeline described above. SLE-defined cryptic events were matched to ENCODE-derived splicing events by their genomic coordinates, and events with at least one supporting read were retained.
Each short-hairpin RNA knockdown sample was paired with its matched nontargeting control samples. Matching was performed at the sample level, and only explicitly matched controls were used for each knockdown replicate.
For each cryptic splicing event and RNA-binding protein, knockdown effects were evaluated with a replicate-aware, read-based framework. For the ith biological replicate, the effect size was defined as:
Δi = KDi − mean(Ci)
Here, KDi represents the cryptic-associated read metric for the knockdown replicate, and Ci is the set of matched control samples for that replicate. Each biological replicate therefore contributed one independent estimate of the change induced by the knockdown.
For each event–RNA-binding-protein pair, replicate-level effects were summarized by their mean and assessed for directional consistency across replicates. Candidate regulatory effects required support from at least two biological knockdown replicates, consistent directionality across replicates and a mean effect size greater than two reads.
Event-level results were then aggregated at the RNA-binding-protein level to summarize the number of cryptic splicing events observed after knockdown.
eCLIP enrichment analysis of RNA-binding proteins
ENCODE enhanced crosslinking and immunoprecipitation (eCLIP) peak data generated in K562 cells were used to assess physical associations between RNA-binding proteins and cryptic splicing events.
For each RNA-binding protein, biological replicates were merged to create a single reproducible peak set. Peaks were filtered using stringent criteria requiring both high statistical significance and binding enrichment: a −log10 P value of at least 3 and a log2 fold enrichment of at least 3. Only peaks with valid genomic coordinates were retained.
For each alternative splicing event, event-specific binding regions were defined to represent the genomic areas in which RNA-binding proteins were most likely to influence splice-site selection. Regions were centered on relevant splice junctions or exon bodies according to event type. For example, the analysis used donor or acceptor sites for alternative splice-site events, exon boundaries for exon skipping and intron boundaries for intron retention. A uniform window extending 300 base pairs on either side was used.
For each RNA-binding protein, the observed number of cryptic-event regions overlapping at least one filtered eCLIP peak was calculated with bedtools intersect. Each target region was counted only once.
To determine whether the observed overlap exceeded random expectation, cryptic-event regions were randomly shuffled across the genome 1,000 times with bedtools shuffle. The number of overlaps between the shuffled regions and the filtered peaks was calculated for every iteration, producing a null distribution.
The mean and standard deviation of expected overlaps were estimated from this distribution. An empirical P value was calculated as the proportion of shuffled overlap counts greater than or equal to the observed count, with a pseudocount added to prevent zero values. A z-score quantified the deviation of the observed overlap from the null expectation.
To account for differences in overall binding abundance between RNA-binding proteins, the total number of filtered peaks for each protein was recorded. Additional normalization metrics included peak density and a normalized enrichment score generated by scaling the z-score by the square root of the peak count.
Empirical P values were adjusted for multiple testing with the Benjamini–Hochberg procedure. RNA-binding proteins were prioritized using a combination of empirical significance, enrichment strength and normalized enrichment.
For enriched RNA-binding proteins, event-level binding was examined by intersecting filtered peaks with individual cryptic-event regions. When multiple peaks overlapped the same event, peak-level statistics were summarized using the maximum log2 fold enrichment and maximum −log10 P value. These summaries were used for downstream visualization, construction of event–RNA-binding-protein matrices and network analyses.
Statistical testing
Differentially expressed genes and normalized gene-expression counts were quantified with DESeq2 version 1.36.0 using the Wald test. Multiple comparisons were corrected with the Benjamini–Hochberg method.
Independent categorical data were tested with the χ2 test. Nonparametric data were analyzed with the Wilcoxon rank-sum test, and continuous variables were correlated using Pearson’s test. All P values were two-sided, and a cutoff of 0.05 was used to define statistical significance.
Reporting information
Additional information about the research design is available in the Nature Portfolio Reporting Summary linked to the article.
Source: www.nature.com