


MPXV Cell Culture
Expi293F cells (Thermo Fisher Scientific, A14527) were maintained in Expi293 Expression Medium (Thermo Fisher Scientific, A1435101) in accordance with the manufacturer’s instructions. Cells were tested monthly for mycoplasma contamination using the e-Myco PCR Detection Kit (Bulldog Bio, 25234), and no contamination was detected.
MPXV Protein Expression and Purification
All monkeypox virus (MPXV) protein sequences were obtained from MPXV isolate hMPXV/P12/2022 (clade IIb). Coding sequences for full-length MPXV E5 (GenBank: XNX20584.1, residues 1–785), E5(ΔRRM) (GenBank: XNX20584.1, residues 238–785), F8 (GenBank: XNX20538.1, residues 1–1006), C-terminally truncated F8 (GenBank: XNX20538.1, residues 1–984) and E4 (GenBank: XNX20583.1, residues 1–218) were cloned into the pCAGGS vector. Each construct contained an N-terminal maltose-binding protein (MBP) tag followed by an HRV 3C protease cleavage site (LEVLFQGP). Coding sequences for wild-type A22 (GenBank: XNX20615.1, residues 1–426) and A22 containing F217A and F263A substitutions (GenBank: XNX20615.1, residues 1–426) were cloned into an untagged pCAGGS vector. Plasmids encoding the MPXV polymerase subunits F8, A22 and E4 were co-transfected into suspension-adapted Expi293F cells using polyethylenimine (PEI; 25,000 MW, Polysciences). E5 was separately transfected into suspension Expi293F cells using PEI when the cell density reached 2 × 10⁶ cells per ml.
For purification of the wild-type MPXV polymerase holoenzyme (F8–A22–E4) and polymerase mutants, cells were cultured at 37 °C for 72 h and harvested by centrifugation at 4,000g for 20 min. Cell pellets were lysed in buffer containing 50 mM HEPES-NaOH, pH 7.5, 300 mM NaCl, 0.5% (v/v) Triton X-100, 5 mM MgCl2, 0.5 mM EDTA, 1 mM DTT and protease inhibitor cocktail (cOmplete Mini, EDTA-free, Millipore Sigma, 11836170001). Cellular debris was removed by centrifugation at 50,000g for 2 h using a Ti50.2 rotor. The clarified lysate was incubated with amylose resin (NEB, E8021S) at 4 °C for 1 h and washed with buffer containing 25 mM HEPES-NaOH, pH 7.5, 300 mM NaCl, 5 mM MgCl2, 0.5 mM EDTA and 1 mM DTT. The bound MPXV F8–A22–E4 complex was digested on-column overnight at 4 °C with HRV 3C protease (TaKaRa, 7360). Eluted fractions were collected in buffer containing 25 mM HEPES-NaOH, pH 7.5, 150 mM NaCl, 2 mM MgCl2 and 1 mM DTT, then concentrated to 500 μl for size-exclusion chromatography on a Superdex 200 Increase column (Cytiva, 28990944). Fractions containing the MPXV polymerase holoenzyme were pooled, concentrated to approximately 1.5 μg μl−1 and stored for structural and functional analyses. To generate the exonuclease-defective polymerase mutant, Asp166 and Glu168 in F8 were replaced with alanine by site-directed mutagenesis of the wild-type F8 pCAGGS construct. The mutant holoenzyme was purified using the same procedure.
For purification of MPXV E5 and E5(ΔRRM), cells were cultured at 37 °C for 72 h and harvested by centrifugation at 4,000g for 20 min. Cell pellets were lysed in buffer containing 50 mM HEPES-NaOH, pH 7.5, 500 mM NaCl, 0.5% (v/v) Triton X-100, 5 mM MgCl2, 0.5 mM EDTA, 1 mM DTT and protease inhibitor cocktail (cOmplete Mini, EDTA-free, Millipore Sigma, 11836170001). Cell debris was removed by centrifugation at 50,000g for 2 h using a Ti50.2 rotor. The supernatant was incubated with amylose resin (NEB, E8021S) at 4 °C for 1 h and washed with buffer containing 25 mM HEPES-NaOH, pH 7.5, 500 mM NaCl, 5 mM MgCl2, 0.5 mM EDTA and 1 mM DTT. Bound MPXV E5 or E5(ΔRRM) was digested on-column overnight at 4 °C with HRV 3C protease (TaKaRa, 7360). Eluted proteins were collected in buffer containing 25 mM HEPES-NaOH, pH 7.5, 150 mM NaCl, 2 mM MgCl2 and 1 mM DTT, then concentrated to 1 ml for purification using a Superdex 200 Increase column (Cytiva, 28990944). Fractions containing MPXV E5 or E5(ΔRRM) hexamers were pooled, concentrated to approximately 3 μg μl−1 and stored for subsequent structural and functional studies. For the primase-defective E5 mutant, Asp70 was replaced with alanine by site-directed mutagenesis of the wild-type E5 pCAGGS construct, followed by the same purification procedure. All purified proteins and protein complexes were analysed by SDS–PAGE.
MPXV Replisome Assembly
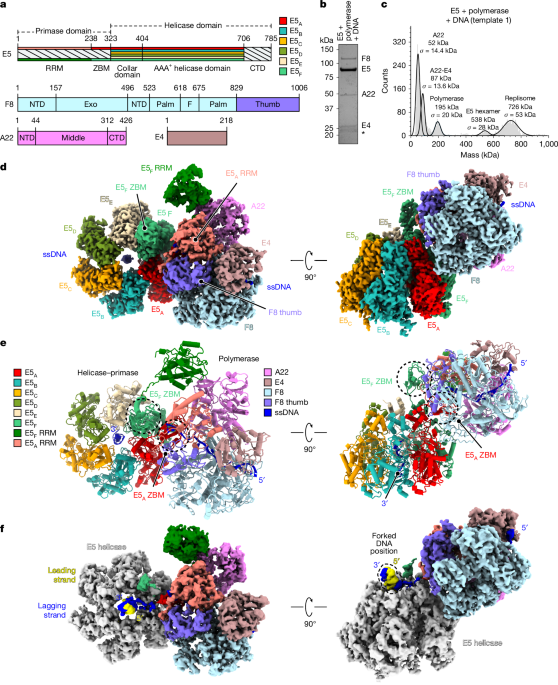
To determine the structure of the single-stranded DNA (ssDNA)-bound MPXV replisome, an 80-nucleotide DNA template was used: 5′-TTTTTTTTTTTTTTTTTTTTTTTTTTTTTTTTTTTTTTTTGGCTCCCGCGTCGGAGTCGTTTCGACTCCGACGCGGGAGC-3′ (template 1; Extended Data Fig. 1c and Supplementary Table 2). MPXV E5 helicase–primase, polymerase holoenzyme (F8–A22–E4) and DNA were mixed at a 1:1.2:1.2 molar ratio in buffer containing 25 mM HEPES-NaOH, pH 7.5, 150 mM NaCl, 2 mM MgCl2 and 1 mM DTT, followed by overnight incubation. The mixture was applied to a Superdex 200 Increase column (Cytiva, 28990944). Fractions containing the MPXV replisome were pooled and concentrated to approximately 0.3 μg μl−1 for subsequent analysis.
To determine the structure of the forked DNA-bound MPXV replisome, an 83-nucleotide DNA template was used: 5′-TTTTTTTTTTTTTTTTTTTTTTTTTTTTTTGTCGGAGTCGTTTCGACTCCGACTTTTTTTTTTTTTTTTTTTTTTTTTTTTTT-3′ (template 2; Extended Data Fig. 5b and Supplementary Table 2). E5 helicase–primase, polymerase holoenzyme (F8–A22–E4) and DNA were mixed at a 1:1.2:1.2 molar ratio in buffer containing 25 mM HEPES-NaOH, pH 7.5, 150 mM NaCl, 2 mM MgCl2 and 1 mM DTT, then incubated overnight. The mixture was applied to a Superdex 200 Increase column (Cytiva, 28990944). Fractions containing the MPXV replisome were pooled and concentrated to approximately 0.3 μg μl−1 for subsequent analysis.
To determine the structure of the MPXV replisome bound to an RNA–DNA hybrid, a 58-nucleotide DNA oligonucleotide (5′-TTTTTTTTTTTTTTTTTTTTTTTTTTTTTTTTTTTTTTTTGCTCCCGCGTCGGAGTCG-3′) and an 18-nucleotide RNA oligonucleotide (5′-CGACUCCGACGCGGGAGC-3′) were used (template 3; Extended Data Fig. 9b and Supplementary Table 2). E5 helicase–primase, polymerase holoenzyme (F8–A22–E4) and the RNA–DNA hybrid were mixed at a 1:1.2:1.2 molar ratio in buffer containing 25 mM HEPES-NaOH, pH 7.5, 150 mM NaCl, 2 mM MgCl2 and 1 mM DTT, followed by overnight incubation. The mixture was passed through a Superdex 200 Increase column (Cytiva, 28990944). Fractions containing the MPXV replisome were pooled and concentrated to approximately 0.3 μg μl−1 for structural analysis.
Cryo-EM Sample Preparation and Data Collection
Samples in elution buffer containing 25 mM HEPES-NaOH, pH 7.5, 150 mM NaCl, 2 mM MgCl2 and 1 mM DTT were vitrified using a Vitrobot Mark IV (Thermo Fisher Scientific). Samples were maintained at 100% humidity at room temperature. A 4 µl sample was applied to Quantifoil Au 1.2/1.3 300-mesh grids (EMS Q450CR1.3) that had been plasma-treated using a PELCO easiGlow discharge-cleaning system at 0.39 mBar and 15 mA for 30 s. Grids were blotted for 3 s.
Cryo-EM datasets were collected using EPU v.2.13 on a Titan Krios microscope (Thermo Fisher Scientific) operated at 300 kV. Images were recorded with a Falcon 4 detector and Selectris energy filter (Thermo Fisher Scientific) in counting mode at ×165,000 magnification, corresponding to a calibrated pixel size of 0.74 Å px−1. For the ssDNA-bound MPXV replisome assembled with template 1, 20,997 micrographs were collected at a dose rate of 8.88 e− px−1 s−1. The total exposure time was 3.28 s and was divided into 56 frames, corresponding to a total dose of approximately 54 e− Å−2. For the forked DNA-bound MPXV replisome assembled with template 2, 45,400 micrographs were collected at 0.74 Å px−1 with a dose rate of 10.92 e− px−1 s−1. The 2.55 s exposure was divided into 87 frames, corresponding to a total dose of approximately 51 e− Å−2. For the MPXV replisome bound to the RNA–DNA hybrid assembled with template 3, 27,692 micrographs were collected at 0.74 Å px−1 with a dose rate of 11.02 e− px−1 s−1. The 2.52 s exposure was divided into 43 frames, corresponding to a total dose of approximately 51 e− Å−2.
Cryo-EM Image Processing and 3D Reconstruction
All cryo-EM image processing was performed using Relion 3.0 (v.3.1.4)47 and cryoSPARC (v.4.4.1)48. For MPXV replisome datasets containing DNA, video frames were gain-normalized and motion-corrected with MotionCor2 (v.1.5.0)49. Contrast transfer function (CTF) estimation and correction were performed with CTFFind4.1 (v.4.1.14)50 as implemented in Relion 3.0.
For the ssDNA-bound MPXV replisome, automated particle picking yielded 4,073,693 particles (Extended Data Fig. 1d). Following multiple rounds of two-dimensional (2D) classification, 186,468 particles from the first heterogeneous-refinement round, which began with 1,210,465 particles, were subjected to a second round of heterogeneous refinement. A subset of 81,800 particles from the second round was then subjected to a third round of 3D classification. The resulting 56,874 particles were processed by homogeneous refinement, producing a final map with a resolution of 4.1 Å. To improve the resolution of individual MPXV replisome regions, the E5 helicase and polymerase–primase modules were separately masked and processed by local refinement, yielding maps at 3.8 Å and 3.5 Å, respectively, with improved density (Extended Data Fig. 1d–g). A further subset of 30,240 particles from the first heterogeneous-refinement round was subjected to local refinement, producing a 4.0 Å map of the MPXV polymerase–primase core complex (Extended Data Fig. 1h).
For the forked DNA-bound MPXV replisome, 31,005 particles from the second heterogeneous-refinement round, which began with 175,757 particles, were subjected to homogeneous refinement after multiple rounds of 2D classification. This process yielded a final map at 6.5 Å resolution (Extended Data Fig. 5a). Separate local refinement of masked E5 helicase and polymerase–primase modules produced maps at 4.5 Å and 4.1 Å, respectively, with improved density (Extended Data Fig. 5c–e).
For the MPXV polymerase–primase core complex bound to an RNA–DNA hybrid, 25,351 particles from the second heterogeneous-refinement round, which began with 61,436 particles, were subjected to homogeneous refinement following multiple rounds of 2D classification. The resulting final map had a resolution of 3.8 Å (Extended Data Fig. 9c,d).
Cryo-EM Model Building, Refinement and Figure Preparation
Two previously reported cryo-EM structures of ssDNA-bound E5 hexamers showed different ssDNA polarities within E5 (refs. 3,4). For initial model building, we used the higher-resolution structure PDB 8XJ74, because its ssDNA polarity was consistent with that reported for other superfamily-3 helicases51,52. We also used the previously determined MPXV polymerase structure PDB 8HG15. Initial models were fitted into the cryo-EM maps using UCSF Chimera X (v.1.2)53. Residues 1–323 of E5B, E5C, E5D and E5E, which form the E5 primase domain, were not visualized in the cryo-EM maps of the complex. For the ssDNA-bound MPXV replisome, the 3.5 Å polymerase–primase-focused map was used to build models of the polymerase, E5A primase and E5F RNA-recognition motif (RRM). Although the E5F RRM displayed weak density, coordinates from the E5 cryo-EM structure PDB 8HWA3 could be docked based on clear α-helical and β-sheet density. The 3.8 Å helicase-focused map was used to build the E5 helicase model, while the 4.1 Å overall map was used to model the interface between the E5A zinc-binding module (ZBM) and E5 helicase. For the forked DNA-bound MPXV replisome, the higher-resolution ssDNA-bound replisome structure was used as the starting model. The 3.8 Å map was used for model building and rigid-body docking of the polymerase–primase core complex bound to the RNA–DNA hybrid. Manual model adjustment and iterative real-space refinement were performed using Coot (v.0.9.8.8)54 and PHENIX (v.1.21-5207)55. Figures were prepared with PyMOL (v.2.5.4) and UCSF Chimera X (v.1.2)53. For the RNA–DNA hybrid-bound polymerase–primase core complex, a longer segment containing four additional base pairs was used for figure preparation because its density was sufficient for modelling but not adequate for deposition.
Mass Photometry Analysis of MPXV Protein Complexes
Mass photometry (MP) measurements were performed at room temperature using a Refeyn TwoMP mass photometer (Refeyn). Glass coverslips and gaskets were cleaned with HPLC-grade water and isopropanol, then dried with filtered gas. MPXV E5 alone, polymerase alone, E5 and polymerase with or without DNA substrate, and E5–polymerase complexes containing mutant subunits 2 or 3 were diluted to 200 nM in elution buffer containing 25 mM HEPES-NaOH, pH 7.5, 150 mM NaCl, 2 mM MgCl2 and 1 mM DTT. A volume of 18 μl buffer was used to focus the camera, followed by loading 2 μl of sample onto the gasket. Images were acquired using the medium camera setting as 1-min videos and processed by ratiometric imaging. The Refeyn TwoMP instrument was calibrated with monomeric BSA (66 kDa), dimeric BSA (132 kDa) and thyroglobulin (660 kDa), with a molecular-mass error below 5%. Data were analysed using DiscoverMP v.2.3 (Refeyn).
MPXV E5 Helicase Activity Assays
For helicase assays using a DNA substrate with a 5′ overhang, the oligonucleotides 5′-TTTTTTTTTTAGCTACCATGCCTGCACGAATTAAGCAATTCGTAATCATGGTCATAGCT-3′ and 5′-AGCTATGACCATGATTACGAATTGCTTAATTCGTGCAGGCATG-3′ were annealed to generate the substrate (Supplementary Table 2). The substrate was 6-FAM labelled at the 5′ end. E5-only reactions contained 50 nM labelled DNA substrate and E5 at 0.2, 0.5, 1 or 1.5 μM in 25 mM HEPES, pH 8.0, 50 mM NaCl, 10 mM MgCl2, 5 mM ATP and 1 mM dNTP. E5–polymerase reactions contained 50 nM labelled substrate, 1 μM E5 and polymerase at 0.5, 1 or 2 μM in the same reaction buffer. Reactions were incubated at 4 °C for 1 h and then at 37 °C for 2 h. Reactions were stopped by adding 20 mM EDTA, 0.5% (v/v) SDS, 0.2% (v/v) bromophenol blue and 2 μM unlabelled DNA strand, followed by incubation at 4 °C for 30 min. Proteins were digested with 2 mg ml−1 proteinase K (Roche, 3115887001) at room temperature for 30 min. Products were separated on 20% polyacrylamide–TBE gels and imaged using a Typhoon FLA 9500 system (GE Healthcare). Gel quantification was performed with Image Studio Lite (v.5.2). Relative ssDNA products were quantified by drawing a background box of equivalent size to the other bands from the same template at the ssDNA position in the negative-control lane. Values were normalized to the strongest signal, obtained with 1 μM E5 and 2 μM polymerase, which was assigned a value of 1.
For helicase assays using a forked DNA substrate, the oligonucleotides 5′-TTTTTTTTTTTTTTTTTTTTAGCTACCATGCCTGCACGAATTAAGCAATTCGTAATCATGGTCATAGCT with 3′-labelled 6-FAM and 5′-AGCTATGACCATGATTACGAATTGCTTAATTCGTGCAGGCATGTTTTTTTTTTTTTTTTTTTT-3′ were annealed (Supplementary Table 2). Reactions containing 50 nM labelled substrate and 0.5, 1 or 1.5 μM E5 were designated the E5-only group. E5–polymerase reactions contained 50 nM labelled substrate, 1 μM E5 and 0.5, 1 or 2 μM polymerase holoenzyme. All reactions used 25 mM HEPES, pH 8.0, 50 mM NaCl, 10 mM MgCl2, 5 mM ATP and 1 mM dNTP and were incubated at 4 °C for 1 h, followed by 37 °C for 2 h. Reactions were terminated with 20 mM EDTA, 0.5% (v/v) SDS and 0.2% (v/v) bromophenol blue, then incubated at 4 °C for 30 min. Products were separated by 20% polyacrylamide–TBE gel electrophoresis and imaged using a Typhoon FLA 9500 system. Image Studio Lite (v.5.2) was used for gel analysis. Relative ssDNA products were quantified against the negative-control background and normalized to the strongest signal, obtained with 1 μM E5 and 2 μM polymerase, which was assigned a value of 1.
To evaluate polymerase–E5 interface mutations, helicase assays were performed with the 5′-overhang DNA substrate described above. Reactions contained E5 alone (1 μM), E5 (1 μM) with wild-type polymerase (2 μM), or E5 (1 μM) with polymerase containing mutant 1, 2 or 3 (2 μM). Reactions were performed in 25 mM HEPES, pH 8.0, 50 mM NaCl, 10 mM MgCl2, 5 mM ATP and 1 mM dNTP. To compare wild-type E5 with E5(ΔRRM), reactions contained E5 alone (1 μM), E5 (1 μM) with wild-type polymerase (1 μM), or E5(ΔRRM) (1 μM). All reactions were incubated at 4 °C for 1 h and then at 37 °C for 2 h. Time-course helicase assays used E5 (1 μM) with polymerase (2 μM) and either the 5′-overhang or forked DNA substrate in the same reaction buffer. Reactions were terminated with 20 mM EDTA, 0.5% (v/v) SDS, 0.2% (v/v) bromophenol blue and 2 μM unlabelled DNA strand, followed by incubation at 4 °C for 30 min. Proteins were digested with 2 mg ml−1 proteinase K at room temperature for 30 min. Products were resolved on 20% polyacrylamide–TBE gels and imaged using the Typhoon FLA 9500 system. Gel quantification was performed with Image Studio Lite (v.5.2). Data from polymerase mutant assays were normalized to the strongest signal from 1 μM E5 with 2 μM wild-type polymerase. Time-course data for both DNA substrates were normalized to the strongest signal from 1 μM E5 with 2 μM wild-type polymerase using the 5′-overhang substrate at 60 min. E5(ΔRRM) data were normalized to the strongest signal from 1 μM E5(ΔRRM). GraphPad Prism (v.10.1.2) was used to generate figures and perform statistical analyses of biochemical assays.
MPXV Polymerase DNA Elongation Assay
The oligonucleotides 5′-TTTTTTTTTTTTTTTTTTTTAGCTACCATGCCTGCACGAATTAAGCAATTCGTAATCATGGTCATAGCT-3′ and 5′-AGCTATGACCATGATTACGAATTGCTTAATTCGTGCAGGCATG-3′ were annealed to produce the 5′-overhang DNA substrate (Supplementary Table 2). The first oligonucleotide was labelled with 6-FAM at the 5′ end. DNA elongation reactions contained polymerase alone (1 μM), polymerase (1 μM) with wild-type E5 (1 μM), or polymerase (1 μM) with E5(ΔRRM) (1 μM) in 25 mM HEPES, pH 8.0, 50 mM NaCl, 10 mM MgCl2 and 5 mM dNTP. Reactions were incubated at 4 °C for 1 h and then at 37 °C for 2 h. Reactions were stopped with 20 mM EDTA, 0.5% (v/v) SDS and 0.2% (v/v) bromophenol blue and incubated at 4 °C for 30 min. Proteins were digested with 2 mg ml−1 proteinase K at room temperature for 30 min. Products were separated on 20% polyacrylamide–TBE gels and visualized with a Typhoon FLA 9500 system. Image Studio Lite (v.5.2) was used for gel quantification. DNA polymerase elongation activity was quantified by drawing a background box equivalent in size to the other bands from the same template at the dsDNA position in the negative-control lane. Values were normalized to the strongest signal, obtained with 1 μM polymerase alone, which was assigned a value of 1.
Optical Tweezer Analysis of MPXV DNA Unwinding
Single-molecule experiments were performed using a C-trap instrument (LUMICKS) that integrated optical tweezers with microfluidics. The five-channel laminar-flow cell was passivated with 0.5% (w/v) Pluronic F127 in PBS and subsequently treated with BSA at 1 mg ml−1.
Experiments used wild-type E5 and an exonuclease-defective MPXV polymerase holoenzyme (F8–A22–E4). Streptavidin-coated polystyrene beads (0.005% (w/v), 4.35 µm; Spherotech, SVP-40-5) were introduced into channel 1. A biotin-labelled 17 kb DNA molecule containing two nicks approximately 5 kb apart on one strand (approximately 2 pM; LUMICKS, 00027) was flowed into channel 2. Buffer A, containing 25 mM HEPES, pH 7.5, 150 mM NaCl, 0.1 mg ml−1 BSA and 1 mM DTT, was introduced into channel 3. E5 was diluted to 10 nM in buffer A and introduced into channel 4. For combined reactions, E5 and exonuclease-defective polymerase were diluted to 10 nM and 20 nM, respectively, in buffer A and introduced into channel 5.
Single-molecule measurements were conducted on the five-channel microfluidic chip by sequentially loading streptavidin-coated polystyrene beads into channel 1, the biotin-labelled 17 kb DNA substrate into channel 2 and buffer A into channel 3. Buffer A was used for baseline measurements, washing and equilibration. Channels 4 and 5 were used for protein delivery. The tested conditions included E5 alone (10 nM), polymerase alone (20 nM), E5 (10 nM) with polymerase (20 nM), E5 (10 nM) with polymerase (100 nM), and E5(ΔRRM) (10 nM). Conditions were alternated across measurements. When protein conditions were changed within a channel, the system was extensively flushed with buffer A and re-equilibrated to reduce carryover and maintain consistent assay conditions.
Experiments were performed at room temperature (28 °C). Optical traps were calibrated from the Brownian-motion power spectrum of trapped beads to obtain a trap stiffness of 0.16–0.18 pN nm−1. After two beads were optically trapped, the DNA molecule was tethered between them under flow in channel 2. A single DNA tether was confirmed by measuring a force–extension curve at a constant pulling rate of 0.2 µm s−1 and comparing the result with the worm-like-chain model for dsDNA. The tethered DNA was extended beyond its contour length of 6.34 μm to approximately 8.5 μm and held for 10 s under flow to remove a segment of ssDNA and create a 5 kb gap. The DNA tether was then transferred to channel 5 and incubated with protein for 10–30 s. In most experiments, DNA was held at a very low force of approximately 1 pN during protein loading. Unwinding measurements were performed in the same channel at a constant force of 52 pN, and changes in bead-to-bead distance were recorded using BlueLake software (v.2.6.4). Measurements were repeated 33 times for the E5:polymerase 1:2 ratio, 19 times for the E5:polymerase 1:10 ratio and 25 times for the E5(ΔRRM) mutant (Supplementary Figs. 1d and 2a,b). At lower forces of 5 pN and 20 pN, the E5:polymerase 1:2 condition showed no detectable unwinding activity (n = 12 and 10, respectively). The E5(ΔRRM) mutant showed weak unwinding activity at 5 pN and 20 pN (n = 8 and 9, respectively; Supplementary Figs. 2c,d and 3).
Control experiments at 52 pN were performed without protein to assess substrate stability (Supplementary Fig. 1a). No spontaneous DNA unwinding or mechanical rupture was detected, confirming that the observed activity depended on protein. Additional controls using E5 alone (n = 19) or polymerase alone (n = 12) showed no processive unwinding comparable to that produced by MPXV E5 with polymerase or by E5(ΔRRM) alone (Supplementary Fig. 1b,c).
Optical Tweezer Data Acquisition and Analysis
Data were analysed in Python using custom scripts and Lakeview (v.1.3). Helicase activity was recorded as changes in the distance between optically trapped beads and converted into the number of nucleotides unwound42. Multiple 15 s windows, containing approximately 250 data points each, were extracted from every raw trace. These segments were smoothed with a Savitzky–Golay filter, and linear regression was applied to estimate unwinding rates. To identify pauses, raw data were first filtered with the Savitzky–Golay method. The discrete derivative of unwound nucleotides with respect to time was then calculated. Timepoints with instantaneous unwinding rates below 2 nucleotides per second were classified as paused. The first 60 s of each unwinding trace was used to quantify paused-state duration (Supplementary Fig. 1e). Statistical comparisons between experimental conditions were performed using Welch’s t-tests, with pairwise comparisons specified in the text. Statistical analyses were conducted in Python using standard scientific libraries.
MPXV E5 Primase RNA Synthesis Assay
To measure nucleotide synthesis, 2 µM wild-type E5 and 4 µM or 0.02–4 µM wild-type polymerase holoenzyme were incubated with 15 µM M13 ssDNA (NEB, N4040S) on ice for 60 min. To assess inhibition of nucleotide synthesis by mutant E5 or polymerase, 2 µM E5(D70A) primase-dead mutant or E5(ΔRRM) was incubated with 10 µM wild-type, mutant 2 or mutant 3 polymerase holoenzyme and 15 µM M13 ssDNA on ice for 60 min. The protein–DNA mixture was then incubated at 37 °C for 60 min with 1,000 µM unlabelled ATP (Jena Bioscience), 250 µM GTP, 250 µM UTP, 25 µM CTP (New England Biolabs, N0450L) and 0.5 µM α32P-labelled CTP (Perkin Elmer/Revvity; approximately 1 µCi) in reaction buffer containing 25 mM Tris-HCl, pH 7.5, 30 mM KCl, 10 mM MgCl2, 10 mM DTT and 100 µg ml−1 BSA. Reaction mixtures (6 µl) were heated at 80 °C for 10 min and treated with 0.5 µl Quick CIP phosphatase (New England Biolabs, M0525S) at 37 °C for 90 min to remove terminal phosphate groups from unreacted nucleotides. Where indicated, reactions were additionally treated with 1 µl DNase I (Thermo Fisher Scientific, EN0521) or with 1 µl RNase T1 (Thermo Fisher Scientific, AM2283) and 1 µl RNase A (NEB, T3018L). To generate a size ladder, 25 µM scrambled ssRNA oligonucleotides of 10, 15, 20, 25, 30, 40, 50 and 60 nucleotides were labelled with 10 U T4 PNK (NEB, M0201L) and 0.5 µM γ32P-labelled ATP (Perkin Elmer/Revvity; approximately 20 µCi) in buffer containing 70 mM Tris-HCl, pH 7.6, 10 mM MgCl2 and 5 mM DTT at 37 °C for 60 min. Reactions were denatured with 2× STOP loading dye containing 95% (v/v) deionized formamide, 20 mM EDTA, 0.01% (v/v) bromophenol blue and xylene cyanol. Products were analysed on 20% urea–PAGE gels, exposed to a phosphor screen and imaged using a Typhoon Trio Variable Mode Imager (GE Healthcare).
Reporting Summary
Additional information about the research design, experimental methods and reporting criteria is available in the Nature Portfolio Reporting Summary linked to this article.
Source: www.nature.com