


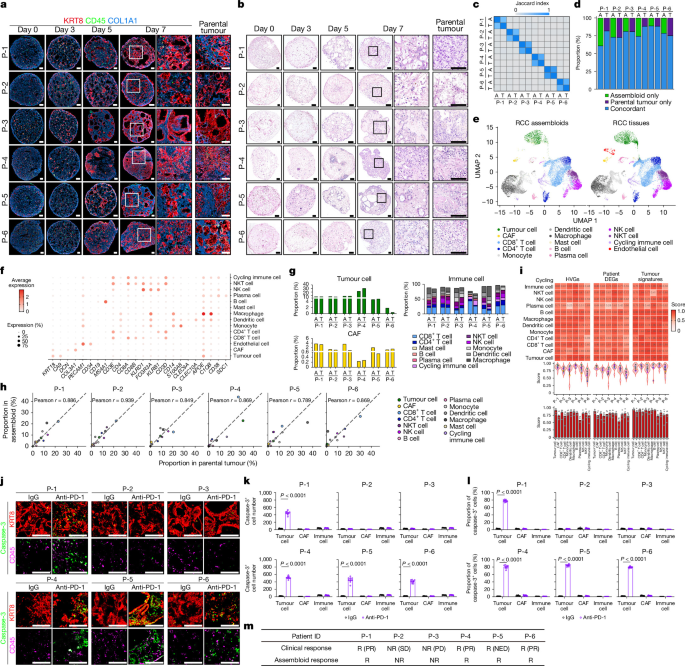
The study used human renal cell carcinoma (RCC) tissue and blood to build patient-specific three-dimensional tumour models containing tumour cells, cancer-associated fibroblasts (CAFs) and tumour-infiltrating immune (TII) cells. The researchers combined these RCC assembloids with organoid, air–liquid interface (ALI), humanized-mouse, single-cell, spatial-transcriptomic, whole-exome and bulk RNA-sequencing approaches to investigate tumour–stroma–immune interactions and responses to programmed cell death protein 1 (PD-1) blockade.
Human samples and animals
Pretreatment RCC specimens of approximately 4–10 cm3 and 30 ml of peripheral blood were collected from patients undergoing radical or partial nephrectomy at Samsung Medical Center (SMC) and Seoul National University Hospital (SNUH). The protocols were approved by the institutional review boards at both hospitals: SMC IRB nos. 2019-05-025 and 2020-03-063, and SNUH IRB nos. 2307-191-1455 and 2402-155-1518. All participants provided written informed consent before enrolment, and all work with human samples followed IRB requirements.
All in vivo experiments used male and female NSG mice aged 6–9 weeks. Mice were housed under specific-pathogen-free conditions with a 12-h light–dark cycle, a temperature of 24 ± 2 °C and humidity of 55 ± 5%. Procedures were performed under isoflurane anaesthesia delivered with a precision vaporizer. Experiments were approved by the Institutional Animal Care and Use Committee of Seoul National University and followed institutional and national guidelines.
The approved humane endpoint for tumour experiments was a tumour burden equal to 10% of body weight; this threshold was not reached or exceeded. Sample sizes were based on comparable published studies and kept as small as practicable. No statistical method was used to predetermine sample sizes. Mice were assigned randomly to treatment groups, but investigators were not blinded during group allocation or outcome assessment.
Isolation and culture of RCC cells
Tissue dissociation
RCC tissue was washed twice in DMEM containing 10% fetal bovine serum (FBS) and 1% penicillin–streptomycin. Samples were minced in DMEM containing 10 mM HEPES at pH 7.4 and digested in 9 ml of the same medium supplemented with 750 µl of 20 mg ml−1 collagenase II, 10 µl of 10 mg ml−1 hyaluronidase and 10 µl of 10 mM Y-27632. Digestion was performed for 1.5 h at 37 °C, with pipetting every 15 min. Ice-cold DMEM containing 10% FBS and 1% penicillin–streptomycin was then added, and the suspension was passed through a 100-µm cell strainer. Red blood cells were removed with ammonium–chloride–potassium (ACK) lysis buffer, and cells were counted with a haemocytometer.
RCC organoids
CA9-positive and CA9-negative cells were separated from dissociated RCC tissue by magnetic-activated cell sorting with EpCAM and CA9 beads. Sorted cells were mixed with ice-cold phenol-red-free Matrigel, seeded as 40-µl droplets at approximately 50,000 cells per well in 24-well plates and polymerized for 25 min at 37 °C.
Each well received 600 µl of organoid medium consisting of Advanced DMEM/F-12 supplemented with 10% R-spondin-1-conditioned medium, 10 mM HEPES, 10 mM nicotinamide, 1 mM N-acetyl-l-cysteine, GlutaMAX, 1% penicillin–streptomycin, 100 µg ml−1 primocin, 50 ng ml−1 human EGF, 100 ng ml−1 human Noggin, B-27, 500 nM A83-01 and 10 µM Y-27632. Medium was replaced every 2–3 days and Matrigel every 10 days.
For passaging, organoids measuring approximately 200 µm were released from Matrigel with collagenase–dispase for 1 h at 37 °C, with pipetting every 20 min. They were collected by centrifugation at 1,500 rpm for 5 min at 4 °C, washed in ice-cold DMEM and partially dissociated with 0.25% trypsin–EDTA containing 10 µM Y-27632 for 3 min at 37 °C. After gentle trituration for 1–2 min, approximately 50,000 cells were resuspended in 40 µl of fresh Matrigel and replated. CA9-positive and CA9-negative organoids were expanded and maintained separately until they were used to make RCC assembloids.
CAF and TII-cell cultures
Mechanically and enzymatically dissociated tumour samples were initially embedded in Matrigel. Fibroblast-like cells separated from the embedded tumour cells and adhered to the culture surface outside the Matrigel droplets. These cells were isolated with 0.25% trypsin–EDTA for 2–3 min at 37 °C, neutralized, collected and replated in Medium 106 supplemented with low-serum growth supplement. Medium was replaced every 2–3 days, and cells were passaged at a 1:2 ratio. Cultures were passaged at least three times to reduce epithelial contamination. Pan-keratin-negative and vimentin-positive immunocytochemical staining was used to confirm fibroblast identity.
For TII-cell cultures, approximately 2 × 10⁶ cells from heterogeneous RCC suspensions were seeded at 1 ml per well in 24-well plates. The immune-cell medium contained RPMI 1640, 10% human AB serum, 10 IU ml−1 IL-2, 5 ng ml−1 IL-7, 1 ng ml−1 IL-15, 10 ng ml−1 BAFF, 2 ng ml−1 CD40L, 2 ng ml−1 IL-21, 2 ng ml−1 GM-CSF, 2 ng ml−1 M-CSF, 10 mM HEPES, 55 µM 2-mercaptoethanol, l-glutamine and 1% penicillin–streptomycin. BAFF, CD40L and IL-21 were added weekly. Adherent and non-adherent fractions were collected and maintained together to preserve immune-cell diversity. Cultures were gently shaken at 90 rpm, half the medium was replaced every other day, and cells were passaged at a 1:2 ratio.
Peripheral-blood mononuclear cells
Blood was kept at room temperature for at least 20 min, diluted 1:1 with PBS and layered over Lymphoprep at one-third of the total volume in 50-ml tubes. Samples were centrifuged at 800g for 20 min at room temperature with the brake off. The mononuclear-cell layer was collected and washed twice with 10 ml PBS at 1,650 rpm for 3 min at 4 °C. When excess Lymphoprep was carried over, an additional spin at 4,200 rpm for 3 min at 4 °C was used. PBMCs were counted with a haemocytometer and either used immediately or frozen in 90% FBS containing 10% DMSO.
Genetic manipulation and conditioned media
The pSicoR-mCh-empty vector (Addgene, 21907) was used to label tumour organoids with red fluorescent protein. Human INHBA or LRP6 cDNA was amplified by PCR and inserted into pLenti6.3/V5-DEST. For shRNA-mediated knockdown of human FGF2, INHBA, SEMA3B, TNF or WNT2B, modified pLKO.3G vectors were used. These vectors were based on Addgene plasmid 14748, supplied by C. Benoist and D. Mathis, and were engineered to contain puromycin- or blasticidin-resistance cassettes. Target-specific shRNAs without significant homology to other human genes were selected from the RNAi Consortium database: https://portals.broadinstitute.org/gpp/public/.
For tumour-cell conditioned medium, separately maintained CA9-positive and CA9-negative organoids were cultured for 2–3 days at 3–5 × 10⁴ cells per well in 1 ml RPMI 1640 containing B-27 and penicillin–streptomycin. Supernatants were filtered through 0.22-µm membranes and stored at 4 °C for up to 5 days. Media from the two organoid populations were mixed 1:1. CAF-conditioned medium was collected after culturing 1 × 10⁵ CAFs per well in 6-well plates in 2 ml of the same medium for 2–3 days, followed by filtration and storage at 4 °C for up to 5 days.
Patient-derived RCC assembloids and ALI organoids
Patient-specific CA9-positive cells, CA9-negative cells, CAFs and TII cells were combined at ratios reflecting their composition in the corresponding parental tumour. CA9-positive and CA9-negative organoids were separately dissociated, then mixed with independently expanded CAFs and TII cells in Matrigel at a total density of 1 × 10⁴ cells per µl. Two-microlitre droplets were polymerized at 37 °C in 5% CO2 for 10 min and transferred to a shaking incubator at 90 rpm.
Assembloids were cultured for 7 days in RCC organoid medium supplemented with 2 ng ml−1 FGF2, 10 IU ml−1 IL-2, 5 ng ml−1 IL-7, 1 ng ml−1 IL-15, 10 ng ml−1 BAFF, 2 ng ml−1 CD40L, 2 ng ml−1 IL-21, 2 ng ml−1 GM-CSF and 2 ng ml−1 M-CSF. BAFF, CD40L and IL-21 were pulsed weekly, and half of the medium was replaced every other day. After 1 week, assembloids were collected for downstream experiments.
Patient-derived ALI organoids were generated as previously described, with modifications. Fresh RCC tissue was minced on ice, washed in Advanced DMEM/F-12 and resuspended in type I collagen mixed with 10× concentrated assembloid medium at a 9:1 ratio. The collagen mixture was placed in 0.4-µm-pore Transwell inserts and solidified at 37 °C. Minced tumour fragments embedded in collagen were overlaid on the solidified gel to establish the air–liquid interface. Cultures were maintained in RCC assembloid medium, with half the medium replaced every other day.
For PD-1 blockade experiments, RCC assembloids and ALI organoids were cultured for an additional week with 10 µg ml−1 anti-PD-1 antibody or 10 µg ml−1 mouse IgG1 isotype control. Treatment medium was refreshed every other day before samples were collected for analysis.
Flow cytometry
Cells were stimulated with Cell Stimulation Cocktail for 5 h at 37 °C, washed in PBS and stained with Fixable Viability Dye 506 for 10 min at 4 °C. Surface antibodies were applied for 30 min at 4 °C. Cells were then fixed and permeabilized with an eBioscience Fixation/Permeabilization Buffer set for 30 min at 4 °C and stained intracellularly for 30 min. Data were acquired on a BD LSRFortessa X-20 cytometer.
Human antibodies targeted CD3, CD8, PD-1, TCF1, TIM3, IFNγ, granzyme B, perforin, CD45, SLAMF6, CD4, CD20, CD56, CD11b, CD14, CD19, CD163, HLA-DR, αSMA, PDGFRα, podoplanin, CD90 and FAP. Antibodies were obtained from BioLegend, BD Biosciences, R&D Systems or other suppliers specified in the experimental protocol and were generally used at a 1:100 dilution.
Lentivirus production and infection
HEK293T cells from the American Type Culture Collection (ATCC CRL-3216) were authenticated by ATCC using short-tandem-repeat profiling and tested negative for mycoplasma. For virus production, 7 × 10⁶ cells were plated on 10-cm dishes in antibiotic-free DMEM containing 10% FBS and cultured for 14–18 h to approximately 70% confluence. Cells were transfected with 9 µg pCMV.dR8.74 packaging vector, 3 µg pMD2.G VSV-G envelope vector and 10 µg transfer vector using TransIT-LT1 at a 1:3 DNA-to-reagent ratio. Supernatants were collected after 48 h, filtered through 0.45-µm membranes and concentrated at 24,000 rpm for 2 h at 4 °C. Pellets were resuspended in DMEM containing 10% FBS at approximately 10-fold the original concentration.
For tumour organoids, single cells were incubated with concentrated virus at a multiplicity of infection of 5–10 and 8 µg ml−1 polybrene for 1 h at 37 °C. Cells were embedded in 40 µl phenol-red-free Matrigel per 1 × 10⁵ cells. Two days later, organoids were selected with either 1 µg ml−1 puromycin or 6 µg ml−1 blasticidin. CAFs grown to confluence in 10-cm dishes were infected at a multiplicity of infection of 2 for 6 h in the presence of 8 µg ml−1 polybrene. The virus-containing medium was then replaced, and antibiotic selection began after 2 days using the same puromycin or blasticidin concentrations.
Mouse models and treatment
Patient-derived tumour organoids and CAFs were reconstituted into RCC assembloids. After 7 days, assembloids were gently broken into small fragments, suspended in ice-cold phenol-red-free Matrigel and injected under the left renal capsule of NSG mice with 29-gauge insulin syringes. Each injection contained five assembloids in 20 µl Matrigel. Mice were kept on a warming pad throughout the procedure, and transplantation was performed approximately 60 days before PBMC infusion to allow stable tumour formation.
Patient-derived PBMCs were injected intravenously into tumour-bearing NSG mice. Tail veins were briefly warmed, and 3 × 10⁶ PBMCs in 100 µl sterile saline were administered with a 29-gauge needle. Human leukocyte engraftment was assessed by peripheral-blood flow cytometry 3–4 weeks later. Only mice with detectable human CD45-positive cells were treated.
Humanized mice were randomized to receive intraperitoneal anti-human PD-1 antibody or mouse IgG1 isotype control, each at 200 µg in 150 µl sterile saline. Doses were administered every other day for three treatments, such as on days 28, 30 and 32 after PBMC infusion.
Four weeks after PBMC infusion, blood was collected by submandibular puncture. Red blood cells were removed with ACK buffer, and leukocytes were analysed by flow cytometry. Mice were euthanized 7 days after the final antibody dose. Tumour-bearing kidneys were removed, photographed and weighed. One half was fixed in 4% paraformaldehyde, washed, cryoprotected in 30% sucrose, embedded in OCT and frozen; the other half was fixed in 10% neutral-buffered formalin and processed for paraffin histology.
Whole-exome sequencing
Genomic DNA from CA9-positive cells, CA9-negative cells, primary RCC tissue and matched patient-derived assembloids from six patients was extracted with a DNeasy Blood & Tissue kit. Libraries were prepared from 0.5–2 µg DNA using the Twist Human Core Exome v.2 kit and sequenced as paired-end 150-bp reads on an Illumina NovaSeqX platform. Mean on-target coverage was approximately 300×, with a range of 278–324×.
Reads were aligned to GRCh38 with BWA-MEM. Somatic single-nucleotide variants and short insertions and deletions were identified with GATK Mutect2 v.4.5.0.0 in tumour-only mode. A 1000 Genomes-based hg38 panel of normals was used to suppress recurrent technical artefacts, and a gnomAD allele-frequency resource was used to reduce common germline variants. Mutect2 used a maximum population allele-frequency threshold of 0.001 and an allele-frequency prior of 5.0 × 10⁻⁸ for alleles absent from the germline resource. FilterMutectCalls was applied, and PASS variants were retained in VCF format.
PASS-filtered VCF files were converted to mutation annotation format with vcf2maf v.1.6.22 and Ensembl Variant Effect Predictor v.115 using the GRCh38 cache. Annotation included dbSNP build 156, 1000 Genomes Phase 3, ClinVar, COSMIC and gnomAD exome and genome allele frequencies. Mutation analyses were performed in R v.4.5.2 using maftools v.2.26.0, dplyr v.1.2.0 and readr v.2.2.0.
Nonsynonymous variants were used for mutation burden, concordance and oncoplot analyses. Tumour mutation burden was displayed as log10-transformed nonsynonymous mutation counts. Mutation landscapes were visualized for a predefined 50-gene clear-cell RCC panel and for the most frequently mutated genes. For six tumour samples, unsupervised heatmaps used log10 mutation counts, six base-substitution classes and variant-class fractions with Euclidean distance and complete-linkage clustering.
Mutation concordance between matched tumours and assembloids was calculated from unique variant keys comprising gene, chromosome, position, reference allele and alternative allele. Similarity was measured with the Jaccard index, defined as shared variants divided by the union of variants, and displayed in a non-clustered heatmap. For each matched pair, the proportions of concordant and sample-specific variants were calculated among all unique nonsynonymous variants.
Single-cell RNA sequencing
Pretreatment RCC tissue was collected immediately after resection, rinsed in DPBS, dissociated and passed through a 40-µm strainer. Assembloids were dissociated with collagenase–dispase, gentle pipetting and brief trypsinization. Viability was assessed with trypan blue or propidium iodide, and only samples with at least 70% viability were processed.
Between 1 × 10⁴ and 2 × 10⁴ cells per sample were loaded onto Chromium Single Cell 3′ chips. Libraries were prepared with the Chromium Next GEM Single Cell 3′ Reagent Kit v.3.1 or the Chromium GEM-X Single Cell 3′ workflow, including on-chip multiplexing where applicable. Libraries were sequenced as paired-end reads on an Illumina NovaSeq 6000.
BCL files were converted to FASTQ with Cell Ranger mkfastq v.6.1.2. Reads were aligned to GRCh38 and quantified with Cell Ranger count v.6.1.2. Seurat v.4.3.0 or v.5.4.0 was used for downstream analysis. Cells were filtered using sample-specific thresholds for detected features, unique molecular identifiers and mitochondrial reads. Genes detected in at least five cells were retained. Data were log-normalized, and the 2,000 most variable genes were selected.
To reduce batch effects between sequencing batches and library chemistries, Seurat objects were split by sample and integrated using RunFastMNN from SeuratWrappers v.0.2.0 with fastMNN from batchelor v.1.18.1. UMAP and t-SNE used dimensions 1–50 of the MNN reduction, and a shared-nearest-neighbour graph was generated with FindNeighbors. Louvain clustering was performed with FindClusters. Cluster markers were identified with FindAllMarkers using a Wilcoxon rank-sum test and a Benjamini–Hochberg-adjusted P < 0.05. Cell identities were assigned using canonical markers and published references.
Matched parental tumours and assembloids were compared using the same tumour, CAF and immune-cell annotation framework. Differential expression used Seurat’s FindMarkers and a Wilcoxon rank-sum test. Gene-set enrichment analysis was performed in CAFs for WNT signalling and related pathways. Expression patterns were visualized with UMAPs, violin plots, dot plots and cell-type proportion plots using Seurat, ggplot2 v.3.3.5 or v.4.0.2, and patchwork v.1.1.3 or v.1.3.2.
Cell-type-matched mean-expression profiles were generated by averaging log-normalized RNA expression after quality control. Patient-associated variation was used to select 375 genes per cell type for the highly variable gene analysis and 1,500 genes per cell type for the patient-specific differential-expression analysis. Profiles were standardized across 12 patient samples, and Pearson correlation coefficients (PCCs) were calculated between parental tumours and assembloids. Combined analyses concatenated features from 12 cell types, producing 4,500 features for the highly variable gene analysis and 18,000 for the patient-specific differential-expression analysis. Similarity was evaluated across all 36 parental tumour–assembloid pairings, including six matched and 30 unmatched pairs.
Five MSigDB Hallmark programs—hypoxia, epithelial–mesenchymal transition, glycolysis, fatty-acid metabolism and mTORC1 signalling—were scored as the mean log-normalized expression of their genes. Program activities were standardized separately across parental tumours and assembloids. Similarity was based on root-mean-square Euclidean distance and converted to a bounded score using S = exp[−0.5(d/σ)2], where σ was the median of all 36 distances. For combined analyses, the five programs across 12 cell types generated 60-feature profiles; scores were linearly rescaled as 2S − 1.
Spatial transcriptomics and GeoMx analysis
Visium
Raw Visium datasets, including filtered count matrices and high-resolution tissue images, were obtained from the Gene Expression Omnibus: GSM6415705 for a responder sample and GSM5924038 for a non-responder sample. Data were analysed in R v.4.2 with Seurat v.4.3.0. Spatial data were imported with Load10X_Spatial. Spots with fewer than 200 or more than 10,000 detected features, or more than 20% mitochondrial transcripts, were removed. Remaining spots were normalized with SCTransform v.0.4.3, and the top 3,000 variable genes were used for dimensionality reduction. UMAP used the first 30 principal components, and clustering used FindNeighbors and FindClusters at resolution 1.0.
Module scores for CD8-positive T cells, CAFs, tumour cells, endothelial cells and myeloid cells were calculated with curated gene sets. Cluster identities were assigned using module scores and canonical markers. Spatial analyses examined WNT2B, LRP6, INHBA and TCF7. Proximity between WNT2B-positive tumour spots, LRP6-positive and INHBA-positive myCAFs, and TCF7-positive CD8-positive T-cell spots was quantified by counting adjacent spots within defined neighbourhood radii. Gene-set enrichment analysis was applied to CAF spots next to WNT2B-positive tumour spots.
GeoMx digital spatial profiling
An independent pretreatment cohort of six patients—three responders and three non-responders—was analysed with the GeoMx DSP platform. Formalin-fixed, paraffin-embedded sections were stained for PanCK to identify tumour epithelium, αSMA to identify myCAFs and DAPI to identify nuclei. Free-form regions of interest were selected in PanCK-positive tumour areas and adjacent αSMA-positive stromal regions at the tumour–stroma interface, while necrosis, haemorrhage and technical artefacts were avoided.
Segments were ultraviolet-photocleaved and collected according to the manufacturer’s whole-transcriptome analysis workflow. Libraries were prepared with the GeoMx protocol and sequenced on an Illumina platform. FASTQ files were processed with the GeoMx NGS pipeline v.2.0.0, and quality control was performed in GeoMx DSP Analysis Suite v.2.4. Regions failing vendor criteria, such as low aligned reads, low sequencing saturation or high negative-control signal, were excluded. PanCK-positive tumour and αSMA-positive myCAF data were analysed separately after background correction, upper-quartile normalization and log-transformation.
Bulk RNA sequencing and cell–cell communication
Total RNA was extracted with an RNeasy Mini kit. Strand-specific libraries were prepared from 1–5 µg total RNA with the TruSeq Stranded mRNA Library Prep Kit and sequenced as paired-end reads on an Illumina NovaSeq 6000. Reads were aligned to GRCh37/hg19 with STAR using ENCODE-recommended parameters. Gene-level abundance was quantified and normalized with RSEM. Differential expression was assessed with DESeq2 v.1.24.0 using the Wald test and Benjamini–Hochberg false-discovery-rate correction.
Additional differential-expression analyses used the Degust web application, Classic v.3.1.0: https://degust.erc.monash.edu/. Gene Ontology enrichment used the Gene Ontology web application, with archived resources available through Zenodo at https://doi.org/10.5281/zenodo.14083199 and https://doi.org/10.5281/zenodo.19377705. PCCs were calculated between log-transformed, normalized gene-level expression matrices.
Putative ligand–receptor interactions among CA9-positive cells, CA9-negative cells and CAFs were inferred with CellChat v.1.6.1 adapted for bulk RNA-sequencing data. Raw count matrices from three responder patients were duplicated into two identical pseudo-cells per condition so that they could be processed through the single-cell workflow. Ensembl identifiers were converted to HGNC symbols with org.Hs.eg.db v.3.19.1, and genes without valid symbols were removed. CellChatDB.human and default parameters were used to calculate global and pathway-specific interaction probabilities.
Public datasets
TCGA analysis
Normalized gene-level RNA-sequencing data and clinical annotations for TCGA tumours were obtained through the UCSC Xena platform using the TCGA Pan-Cancer Atlas dataset. The analysis included gastric cancer, lung cancer, ovarian cancer and prostate cancer. LUAD and LUSC were combined as lung cancer, whereas STAD, OV and PRAD retained their TCGA cancer-type designations.
Scores were calculated for WNT expression using all 19 WNT ligand genes, hot-tumour signatures, CAF signatures and stem-like T-cell signatures. INHBA and LRP6 expression were extracted directly. Tumours were first filtered using predefined thresholds for WNT expression, hot-tumour signatures and CAF scores. Among tumours exceeding all three thresholds, k-means clustering with k = 2 used stem-like T-cell score, INHBA expression and LRP6 expression.
ICI-treated cohorts
Public pretreatment or baseline tumour transcriptomes from patients treated with immune checkpoint inhibitors were analysed for gastric, lung and ovarian cancers. The datasets were ENA PRJEB25780 for gastric cancer; GEO GSE126044, GSE274975 and GSE248378 for lung cancer; and GSE188249 and GSE206422 for ovarian cancer. Curated resources including TIGER were used where applicable to obtain or cross-check expression matrices and response annotations.
Gene identifiers were harmonized to official gene symbols. Complete response, partial response and pathological complete response were classified as responses, whereas stable disease, progressive disease and non-pathological complete response were classified as non-responses. Samples without evaluable binary response annotations were excluded. Within each cohort, gene-wise z scores were calculated and averaged to generate signature scores. WNT expression used all 19 WNT ligand genes, while the stem-like T-cell score used established markers of stem-like and progenitor-exhausted T cells. INHBA and LRP6 were analysed as individual z-scored features.
Samples were retained when their WNT score exceeded the cancer-specific pooled-cohort 10th percentile. Percentile ranks for the stem-like T-cell score, INHBA and LRP6 were summed to create an integrated joint score.
Public single-cell datasets
Single-cell datasets from gastric cancer (GSE206785), lung cancer (GSE131907), ovarian cancer (GSE192898) and prostate cancer (GSE176031) were obtained from GEO. Cell-level matrices were combined with patient identifiers and published cell-type annotations. Labels were harmonized into major compartments, including tumour and epithelial cells, fibroblasts and CAFs, endothelial cells, myeloid cells, T cells, B cells, NK cells, plasma cells, mast cells and other cells.
For each patient, tumour WNT expression was the mean expression of the 19 WNT ligand genes in tumour cells. In patients with measurable tumour WNT expression, CAF-associated features were calculated as the proportions of CAF or fibroblast cells expressing INHBA, expressing LRP6 or co-expressing both. Stem-like CD8-positive T cells were quantified as a proportion of CD8-positive T cells expressing stem-like signatures. Patients were divided into high and low groups using a composite score based on the proportions of stem-like CD8-positive T cells and INHBA-positive LRP6-positive CAFs. Heatmaps displayed tumour WNT expression, stem-like CD8-positive T-cell proportions and CAF-associated features after within-cohort z-score normalization.
RT–qPCR, histology and immunostaining
Total RNA for RT–qPCR was isolated with an RNeasy Plus Mini kit. First-strand cDNA was generated with a High-Capacity cDNA Reverse Transcription kit using oligo(dT) primers. RT–qPCR used SYBR Green Supermix on a One-Step Cycler, with expression normalized to GAPDH.
Samples were fixed in 10% neutral-buffered formalin for 24 h at 4 °C, rotating, and embedded in paraffin. RCC organoids were first embedded in 3% agarose, fixed under the same conditions and then processed for paraffin embedding. Sections were cut at 4 µm and stained with haematoxylin and eosin.
For frozen sections, samples were fixed in 4% paraformaldehyde, embedded in OCT and sectioned at 10–25 µm. Sections were blocked in PBS containing 0.25% Triton X-100 and 2% goat serum. Primary antibodies included markers for CA9, TCF1, COL1A1, CD8, pan-keratin, vimentin, αSMA, KRT8/18, CD45, LRP6 and cleaved caspase-3. Alexa Fluor 488, 594, 633 or 647 secondary antibodies were used with DAPI.
Paraffin sections underwent heat-mediated antigen retrieval in 10 mM Tris–EDTA, pH 9.0, at 60 °C overnight before blocking and antibody staining. For whole-mount staining, samples were fixed in 4% paraformaldehyde for 15 min at room temperature, blocked for 4 h and incubated with primary antibodies for 24 h with agitation. Secondary antibodies, DAPI and, where applicable, 2 µM CellEvent Caspase-3/7 Detection Reagent were then applied. Samples were imaged by fluorescence microscopy.
Data analysis and reporting
Fluorescence images were analysed with NIS-Elements BR v.6.02, flow cytometry data with FlowJo v.10.10.0 and statistical analyses with GraphPad Prism v.10. A P value below 0.05 was considered significant. Additional information about the research design is provided in the Nature Portfolio Reporting Summary linked to the study.
Source: www.nature.com