


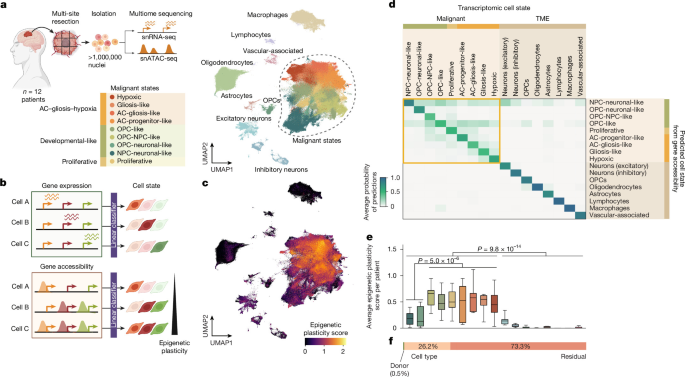
Researchers built a multiomic and spatial framework to study how glioblastoma (GB) cells change state and how their regulatory networks may enable those transitions. The study combined single-nucleus RNA sequencing and ATAC sequencing from 57 tumour sites across 12 patient tumours, spatial transcriptomics from 97 tissue sections, computational modelling with the scDORI method, developmental brain comparisons, pooled transcription-factor screens, molecular assays and mouse xenografts. The analyses were designed to measure epigenetic plasticity, identify regulatory networks, predict transitions between cell states and test selected regulators experimentally.
Patient tissue and multiomic profiling
Patients with suspected GB gave pre-operative consent at Cambridge University Hospitals NHS Foundation Trust. Written informed consent was obtained under the Declaration of Helsinki 2000, and the work was approved by the Cambridge Local Research Ethics Committee (REC 18/EE/0172).
Tumours were resected under 5-aminolevulinic acid (5-ALA) guidance. Where possible, samples were collected from superior, anterior, posterior and middle regions of each tumour. Tissue was embedded in optimal cutting temperature compound and flash-frozen. Cryosections were assessed for RNA integrity after extraction, and only blocks with an RNA integrity number above 7, measured with an Agilent Tapestation, were serially sectioned for parallel single-nucleus and spatial profiling.
Nuclei were isolated from 50-µm cryosections using Dounce homogenization and Percoll-gradient purification. They were processed with the 10x Genomics Chromium Next GEM Single Cell Multiome ATAC + Gene Expression assay, using 5,000 to 10,000 nuclei per reaction and two or three reactions per site. In total, 57 sites from 12 tumours were processed. Libraries were paired-end sequenced on an Illumina NovaSeq 6000, with a target of at least 100,000 read pairs per nucleus for each modality.
Matched Visium libraries were prepared from adjacent sections that had previously been stained with haematoxylin and eosin (H&E) for reference. These libraries were also sequenced on a NovaSeq 6000, with a target of at least 50,000 read pairs per spatial spot. Detailed tissue processing and library preparation were described in the companion manuscript.
Quality control, integration and cell-state annotation
Reads from the single-nucleus RNA-sequencing and ATAC-sequencing libraries were aligned with Cell Ranger ARC to a custom reference genome combining the 10x Genomics GRCh38 pre-mRNA reference with the Cell Ranger ARC ATAC genome, version 1.0.1. Nuclei were filtered using gene counts, unique molecular identifier (UMI) counts and mitochondrial read fractions. Doublets were removed with Scrublet.
ATAC-sequencing data were processed with ArchR using thresholds for fragment counts and transcription-start-site enrichment. The analysis was restricted to barcodes that passed RNA quality control, producing a final dataset of 1,025,329 nuclei. Transcriptome counts were integrated with scVI, using patient, tumour site, reaction date and cell-cycle phase as batch covariates.
Malignant populations were identified from copy-number profiles inferred with inferCNV, and clusters were annotated using marker-gene expression. Malignant subclusters were assigned to cell states by scoring gene modules described by Neftel and colleagues, projecting cells onto a first-trimester developmental brain atlas and performing gene-set enrichment analysis.
The study’s cell-state assignments were based on an earlier annotation because the atlas annotation was finalized in the companion manuscript after the analyses described here had been completed. The earlier and final annotations agreed for 99.85% of malignant nuclei and for all neural and vascular microenvironment populations. Per-cell Topic activities and both annotations were made available through Zenodo (ref. 73).
Measuring epigenetic plasticity
Accessible chromatin at a gene locus that is not yet being transcribed can indicate a primed state that is ready for possible activation. The researchers therefore quantified epigenetic plasticity by measuring how strongly chromatin accessibility and transcription were decoupled at marker genes. The measure was intended to capture the ability of a cell’s chromatin landscape to support transcriptional identities other than the identity it currently expresses.
Following a previous study, the researchers trained a classifier to predict cell states from gene-expression profiles and then applied it to accessibility profiles from the same cells. Cells whose accessibility was compatible with several transcriptional states received lower-confidence classifications and higher plasticity scores.
Scores were calculated on groups of cells called metacells. These were generated by Leiden clustering in Scanpy, using the scVI RNA-embedding latent variable within each cell state, donor and batch stratum. The procedure produced 16,423 metacells. Cell-state, donor and batch groups containing fewer than 40 cells were treated directly as metacells.
For each metacell, the researchers calculated mean RNA counts and mean ArchR gene scores. The latter combine ATAC signal from promoters, gene bodies and distance-weighted distal elements. Both matrices were normalized to library size, and the RNA matrix was log-transformed. A multinomial logistic-regression model was trained on 3,160 highly variable genes to predict the 17 cell states shown in Fig. 1a, using 80% of metacells for training and 20% as a held-out set. The model was then applied to scaled ATAC gene scores. Epigenetic plasticity was estimated as the Shannon entropy of the resulting class probabilities, with higher entropy indicating less certain state assignment. Metacell scores were projected back onto individual cells for visualization.
Variance components were estimated by ordinary least squares with cell state and donor as fixed effects, followed by analysis of variance. Additional information on factors contributing to plasticity variance and on global RNA-to-ATAC coupling was provided in Supplementary Methods section 2.
scDORI regulatory-network modelling
scDORI was used to infer enhancer-mediated gene-regulatory networks (eGRNs) from paired single-cell or single-nucleus RNA and ATAC profiles. Unlike workflows that perform dimensionality reduction and network inference separately within predefined cell types, scDORI is designed to give its latent factors regulatory meaning.
An encoder maps each cell to a low-dimensional representation, while mechanistically constrained decoders reconstruct the observed accessibility and expression. A factor is expected to reconstruct the data well only when it represents a coherent programme in which transcription factors bind accessible elements and regulate nearby genes. The resulting factors, called Topics, are signed networks connecting co-accessible peaks, co-expressed genes and predicted activating or repressing regulators.
Each cell is modelled as a mixture of Topics rather than assigned to a single cluster. This allows regulatory networks to vary continuously between cells and allows one Topic to be active across several states. Training uses mini-batches, enabling the method to scale to millions of cells without first aggregating them. Detailed descriptions of the architecture, training schedule and empirical null model were provided in Supplementary Methods sections 1.1 to 1.11.
Training scDORI on the patient atlas
scDORI was trained on 95% of the patient-atlas cells and evaluated on the remaining 5%. The model used 182,677 highly variable peaks, 3,192 highly variable genes and 195 transcription factors to learn 50 latent factors, or Topics.
During the second training phase for gene-regulatory-network inference, the encoder and modules 1–3 were frozen to preserve the Topic representations learned during the first phase. Empirical Topic-level transcription-factor expression was used for network pruning rather than denoised transcription-factor estimates from module 3.
Consistency across model restarts was assessed using three random seeds and the Jaccard similarity between the top 500 genes of the most active Topic in each GB state and the corresponding genes from reference run 0. Run 0 was used for all subsequent analyses. Topics with a maximum activity above 0.1 across cells were retained, leaving 31 of the 50 Topics.
Dominant gene programmes were identified by gene-set enrichment analysis with decoupler version 1.6.0. The top 250 genes for each Topic were compared with gene sets containing 15 to 500 genes from the H, C2, C5 and C8 subcategories of MSigDB version 2023.1.Hs.
Benchmarking the method
scDORI was assessed using three complementary benchmarks: prediction of peak–gene links, the biological relevance of its latent space and the ability of inferred eGRNs to explain differential gene expression.
Peak–gene links were compared with SCENIC+ using simulated single-cell multiomic profiles derived from bulk RNA-sequencing and ATAC-sequencing data from the ENCODE cell lines IMR90, K562 and GM12878. Predictions were evaluated against BENGI, a curated collection of enhancer–gene interactions assembled from CRISPR perturbations, chromatin-interaction assays and expression quantitative trait locus data. Performance was measured by the area under the precision–recall curve (AUPRC).
The learned latent space was compared with MOFA and SCENIC+, with SCENIC+ represented by AUCell scores over the same transcription factors used by scDORI. These comparisons were performed on metacells because of memory requirements. Biological relevance was measured by the ability to predict cell-state labels using logistic regression with fivefold cross-validation.
Inferred eGRNs were also tested with an independent single-cell GB atlas, following the GRaNPA framework. For each pair of states or Leiden clusters, the researchers formed a network from the union of TF–gene links in Topics with a mean activation above 0.2 in either population. Logistic regression using signed TF–gene links was then used to predict whether genes were upregulated or downregulated. Performance was measured by AUPRC and compared with SCENIC+ and randomized eGRNs.
Topic regulators and state regulators
Topic-level transcription-factor activity was defined as the aggregate regulatory strength of each transcription factor across its target genes within a Topic, calculated separately for activating and repressive links. Scores were normalized across transcription factors and Topics to reflect both the intensity and Topic specificity of activity.
Transcriptional regulators (TRs) were defined as transcription factors with the strongest downstream activation of genes within a Topic. Transcriptional safeguards (TSs) were defined as transcription factors that most strongly repressed genes from at least two alternative Topics. A transcription factor could be both a TR and a TS. The researchers also calculated Topic regulation scores by combining activating and repressive scores, and state regulation scores by weighting Topic regulation across the Topics active in each state.
Priming of transcriptional regulators
To examine whether TRs were epigenetically primed, the researchers compared their expression with chromatin accessibility across the patient atlas. For each Topic, they selected the 5,000 cells with the highest Topic activity and calculated average TR expression and ArchR gene scores. Values were min–max scaled across GB Topics.
A TR was considered epigenetically primed in a Topic-defined substate when its scaled expression was below 0.3 and its scaled accessibility was above 0.5.
Transition and repression potential
The Topic activation potential (TAP) was defined as a measure of how readily cells associated with a source Topic A could activate the programme of a target Topic B. The measure was based on the premise, supported by the study’s gain-of-function screen and earlier reprogramming work, that activating the target Topic’s TRs can drive its programme.
For every activating link between a transcription factor expressed in source Topic A and a TR in target Topic B, the researchers multiplied three values: whether the activating link was present, the scaled accessibility of the target TR in Topic A and the target TR’s total activation strength in Topic B. The sum of these values represented the potential of Topic A to activate Topic B. ATAC-derived Topic eGRNs were used so that regulators could be included even when they were accessible but not necessarily expressed.
The Topic repression score (TRS) was calculated in a similar way using repressive interactions, expression-pruned eGRNs and chromatin closure at target TRs in the source Topic. Significance was estimated using 1,000 randomized TF–gene permutations, with values above the 95th percentile of the null distribution considered significant. Scores were normalized by the number of transcription factors expressed in the source Topic and by self-activation of the target Topic. Pan-state Topics 18, 31 and 39 were excluded because their non-specific activity limited interpretation.
Net transition potential was defined as TAP minus TRS. Topic-driven plasticity was calculated by aggregating net transition potential from a source Topic towards Topics active in alternative states. State-level interactions were obtained by aggregating Topic-level TAP and TRS values and weighting them by the proportional activity of each Topic in the relevant state.
Positive and negative transition-potential values were not interpreted as proof that a transition was fixed or impossible. Instead, they represented how permissive the regulatory landscape was in one state towards another.
Spatial and temporal analyses
The researchers used cell2location to map Topics onto 338,481 spot transcriptomes from 97 Visium sections derived from the same 12 tumours. The Topic–gene matrix was supplied as the reference, treating each Topic as a distinct transcriptional programme.
A Topic was assigned to a spot when its inferred abundance exceeded both the median abundance for that Topic across all spots and a baseline threshold of 5. For each Topic pair in each section, the researchers calculated distances between all spot pairs and examined the closest 10% of locations. Spatial co-activity was defined as the percentage of sections in which the mean distance within this closest group was zero, indicating direct co-activity at the spot level. Each Topic pair was observed in at least 17 sections, with an average of 60 sections, from at least seven patients, with an average of 10.
Temporal co-activity was assessed along 60 pseudotemporally ordered clonal trajectories. Clones were inferred jointly from RNA and ATAC data using large-scale copy-number variations detected by inferCNV and epiAneufinder. The two modalities were matched using shared cells and copy-number-profile similarity, and high-confidence clone identities were assigned by label spreading.
Cell2fate was used for pseudotemporal ordering. Topic activity was smoothed with a 100-cell moving average, and a net pseudotime score was calculated for each Topic within each clone. Directional Topic pairs were identified according to whether a candidate target Topic was inactive or became active later than a reference Topic. Co-activity was measured by cosine similarity between Topic-activity vectors. A total of 57 of the 60 clones ranked among the top 10% for at least one Topic pair.
To test whether predicted transitions corresponded to tumour organization, the researchers correlated net transition-potential values with spatial and temporal co-activity. Spatial correlations used the average of A→B and B→A values, whereas temporal correlations were calculated separately for outgoing and incoming directions. Correlations with P < 0.05 were considered significant. Cross-state Topic pairs were also examined across 84 pairs, using the same significance threshold.
Developmental brain comparison
The framework was applied to a published multiome atlas of the human cortex containing 45,549 nuclei from 12 donors collected at six time points spanning mid-gestation to adulthood. This dataset was used to compare GB chromatin permissiveness with the developing brain and to test whether scDORI and net transition potential could recover known developmental relationships.
For plasticity analysis, cells were grouped into six neuroectodermal types: radial glia cells, neural progenitor cells, neurons, astrocytes, oligodendrocyte precursor cells and oligodendrocytes. Microglia were retained as a negative control. A linear-regression model was trained on 2,559 metacells, using an 80/20% training and test split, and accessibility-based predictions were used to calculate plasticity.
scDORI was trained with 30 Topics rather than 50 because the developmental dataset was smaller and had a more compact lineage hierarchy. Net transition potentials were calculated for 13 Topics active in cells of dorsal telencephalic origin. The resulting patterns were compared with lineage relationships previously confirmed by lineage-tracing experiments.
Cell culture and perturbation experiments
S24 patient-derived glioma cells (PDGCs) were obtained from freshly dissected adult patient tissue after informed consent. P3XX and BG5 PDGCs were provided by H. Miletic of the University of Bergen. Cells were maintained under stem-like neurospheroid conditions in GB medium containing DMEM/F12, B27 supplement without vitamin A, insulin, heparin, basic fibroblast growth factor and recombinant human epidermal growth factor.
All PDGC lines were authenticated using Illumina Infinium Methylation Analysis, which detects more than 850,000 CpG sites. HEK293T cells (CRL-3216, ATCC) were used to produce lentiviral particles. Cell lines were tested regularly for mycoplasma infection.
Lentivirus was produced in HEK293T cells using third-generation packaging plasmids following the Trono laboratory protocol. Viral particles were concentrated by ultracentrifugation at 69,000g for 2 hours at 4 °C and stored at −80 °C. For transduction, 1 × 10⁶ PDGCs were exposed to 10 µg ml−1 polybrene and lentiviral particles for 24 hours. Puromycin selection began after 48 hours at 2 µg ml−1. Transcription-factor manipulation was confirmed by quantitative PCR, western blotting or normalized RNA-sequencing read counts.
Co-culture with primary neurons
Primary cortical cultures were isolated from wild-type B6N mice at postnatal day 0. Cortex was dissected in ice-cold Hanks’ balanced salt solution, digested with papain and seeded on Matrigel-coated wells at 180,000 cells per cm2. After maturation for seven days, the cultures were confirmed to form electrical networks using field-potential recordings on multi-electrode-array plates.
PDGCs were dissociated with Accutase and seeded onto the cortical cultures, generally at 14,000 cells per cm2. Half of the medium was replaced every second day until collection. Primary hippocampal cultures were prepared in the same way, with hippocampi dissected instead of cortical tissue, for morphology experiments.
Pooled screen of 55 candidate regulators
To identify regulators that could drive GB state transitions, the researchers performed a pooled overexpression screen of 55 candidate transcription factors in S24, P3XX and BG5 PDGCs co-cultured with primary cortical cells. The panel included scDORI-predicted TRs with activity scores above 0.5 in GB-associated Topics and TSs that repressed Topics from at least two alternative states.
Each transcription factor was cloned into a doxycycline-inducible pLIX_puro vector containing a unique transcriptional barcode. Barcode-only controls were included at a 2:1 ratio relative to each transcription-factor vector. PDGCs were transduced at a multiplicity of infection of 0.1 to favour single-vector integration, selected with puromycin for at least seven days and seeded on seven-day-old cortical cultures at 9,000 or 14,000 cells per cm2.
Transcription-factor expression was induced with 2 µg ml−1 doxycycline for four days. Cells from four to six wells were pooled, isolated by fluorescence-activated cell sorting and processed with the ScaleBio Single Cell RNA Sequencing Kit v1.1. Libraries were sequenced on a NovaSeq X Plus. Cells were retained when they contained at least three barcode UMIs and the dominant transcription factor accounted for at least 70% of barcode UMIs, yielding 261,566 barcode-assigned cells.
Screen cells were projected onto the patient atlas by combining them with 96,295 atlas cells, calculating 200 principal components from 4,315 features and correcting batches with Harmony. Logistic-regression classifiers assigned cells to four core GB states or 17 Topic classes. The balanced accuracy was 0.89 for state assignment and 0.87 for Topic assignment.
Effects were reported as mean differences in state or Topic probability scores and Cohen’s d. Significance was tested using matched label permutation and subsampling over 1,000 permutations, followed by Benjamini–Hochberg correction. Effects were considered significant at P < 0.05 with an absolute Cohen’s d greater than 0.2. Additional analyses assessed dose dependence and enrichment of state signatures among differentially expressed genes.
Reversible regulator perturbations and therapeutic pressure
The effects of inducing and removing regulators associated with high- and low-plasticity states were tested using MEOX2 and MYT1L, respectively, in S24 PDGCs. Cells carrying doxycycline-inducible vectors were co-cultured with primary cortical cells. For induction experiments, doxycycline was added on the day of seeding. For removal experiments, it was added three days before co-seeding and withdrawn 24 hours after co-seeding. Cells were collected six days later for ATAC and/or RNA sequencing.
MYT1L overexpression was also examined after chemotherapy or radiotherapy. S24 PDGCs were treated with 300 µM temozolomide for four days, with drug replenished on day 2, or with 2 Gy ionizing radiation on two consecutive days. Surviving cells were cultured for 48 hours in normal growth medium before being seeded onto primary cortical cultures. MYT1L expression was induced after seeding.
Bulk sequencing and chromatin assays
Bulk ATAC-sequencing libraries were prepared from 50,000 nuclei isolated from perturbed or control PDGCs. DNA was tagmented with in-house-assembled Tn5, purified, indexed by PCR and size-selected between 100 and 500 base pairs. Libraries were sequenced on an Illumina NextSeq 2000 and processed with the nf-core ATAC-seq pipeline. Peaks were called with MACS2, and differential accessibility was analysed with DiffBind. Peaks with a false discovery rate below 0.05 were considered significant.
Bulk RNA sequencing was performed on three biological replicates per condition from neurosphere cultures or neuronal co-cultures. RNA libraries were prepared using SMART-Seq v4 and NEBNext protocols or the Illumina TruSeq Stranded Total RNA protocol, depending on the vector system. Libraries were sequenced on NovaSeq 6000 or NovaSeq X Plus instruments. Reads were aligned to hg38 with STAR, and differential expression was assessed with DESeq2 using a Benjamini–Hochberg-corrected P < 0.05 threshold.
CUT&RUN was used to identify MYT1L-bound DNA regions in S24 PDGCs eight days after transduction. One hundred thousand cells per sample were incubated with MYT1L antibody or an IgG control, and protein A–MNase was used to release antibody-bound DNA. Libraries were sequenced on a NextSeq 2000 and analysed with the nf-core/cutandrun pipeline. Consensus peaks were defined with Genrich using a Benjamini–Hochberg-adjusted false discovery rate below 0.005.
Neuronal-like transcription-factor regulons were defined using genes that changed in the same direction at both the ATAC and RNA levels after overexpression. For MYT1L, CUT&RUN binding data were also used to identify target genes. These experimentally determined targets were compared with the union of neuronal-like Topic eGRNs from Topics 24, 36, 37, 41 and 49, and with regulons inferred by SCENIC+.
Functional assays
PDGC proliferation was measured with the AlamarBlue assay in S24 and BG5 cells after MYT1L overexpression or knockout. Fluorescence was measured on days 3, 5 and 7 and normalized to the day-0 measurement.
Tumour-microtube formation was examined in a two-dimensional Matrigel model using high-glucose, growth-factor-free GB medium. S24 and BG5 PDGCs were incubated for three days, stained with MemGlow560 and imaged by confocal microscopy. A previously established image-analysis pipeline quantified nuclei and tumour-microtube connectivity. Total tumour-microtube length was divided by nuclei count, and only regions within one standard deviation of the mean nuclei density were retained.
For neuron–PDGC morphology experiments, low-density S24 cells were seeded onto primary hippocampal cultures and fixed seven days later. Primary branches and total terminal branches were counted manually from microscopy images.
Neurospheroid growth was measured by embedding single S24 spheroids in Geltrex with or without doxycycline. Spheroids were imaged on days 0 and 7, and growth was calculated from the normalized raw integrated fluorescence density. To distinguish activation from repression, the MYT1L DNA-binding domain was fused separately to the VP64 activation domain or the Drosophila engrailed repressor domain. Proliferation and spheroid-growth assays were then performed after induction.
Patient-derived xenografts
Patient-derived xenografts were generated in male NMRI nude mice aged 8–10 weeks. For survival studies, 100,000 S24 PDGCs in phosphate-buffered saline were stereotactically injected into the mouse cortex after MYT1L overexpression or control transduction.
For intravital two-photon imaging, mice received a chronic cranial window and titanium ring. Two weeks later, 300,000 tdTomato-labelled S24 PDGCs were injected into the cortex at a depth of 500 µm. Imaging was performed 21 days after injection under isoflurane anaesthesia. FITC–dextran was administered intravenously to generate angiograms, and images were acquired at depths of 200 and 300 µm across the injection site and both hemispheres. PDGCs were counted manually after image segmentation.
All mouse experiments were approved by the local authorities of Regierungspräsidium Karlsruhe. Animals were monitored regularly and euthanized when tumours reached the permitted maximum size or when humane endpoints were met. Mice were housed at the DKFZ animal facilities at 20–24 °C and 45–65% humidity on a 12-hour light–dark cycle, with food and water available without restriction.
Statistics and reproducibility
Sample sizes were not predetermined statistically. Analyses were performed in Python or GraphPad Prism version 9.0, with the relevant tests described in the figure legends and Methods sections. Mice used for primary cultures and in vivo experiments were selected randomly before treatment. Investigators were blinded during microscopy analysis and quantification; otherwise, blinding and randomization were not used.
Figures were assembled in Affinity Designer. Several figures were created with BioRender, including Figures 1a,b, 2a,d, 3a, 4a–e,g–j and 5a,d,f–i, and Extended Data Figures 1f, 2a, 6a, 7a, 8a,d, 9b, 10b,e,i,j and 11a. Microsoft Excel version 16.0 was used to create and organize supplementary tables and source data. Additional information on the research design was provided in the Nature Portfolio Reporting Summary linked to the article.
Source: www.nature.com