


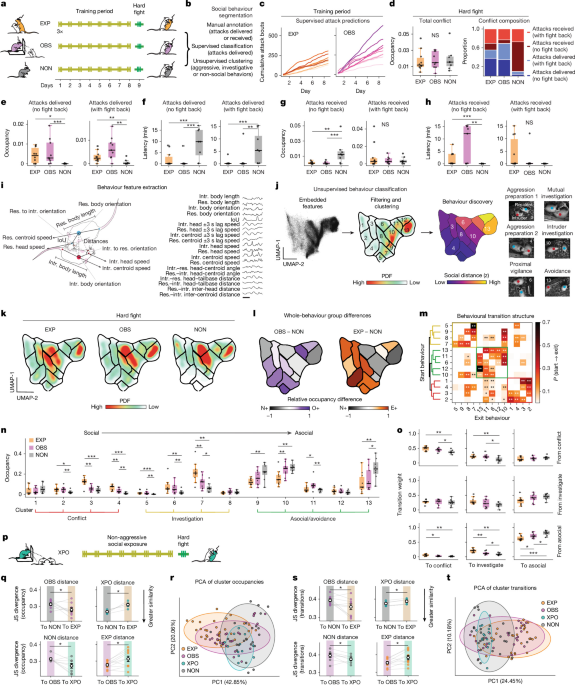
This study used male mice to examine how observing aggression affects later behaviour and brain activity. The experiments combined longitudinal resident–intruder assays, multi-site fibre photometry, automated pose tracking, supervised and unsupervised behavioural classification, optogenetic and chemogenetic manipulations, and whole-brain histology. Animals were assigned to aggression-experience (EXP), observation (OBS) or non-social control (NON) groups, and neural activity was recorded across social-behaviour networks during training and subsequent hard-fight sessions.
Animals and experimental design
All animal procedures were approved by the Princeton University Institutional Animal Care and Use Committee and followed National Institutes of Health standards. Only male mice were used. The animals were housed on a 12 h–12 h light–dark cycle, with experiments conducted exclusively during the dark phase. Food and water were available ad libitum, ambient temperature was maintained at 21–26 °C and humidity at 30–70%.
For multi-fibre photometry, the researchers used Vgat+/− mice backcrossed with CD1 males from Charles River for at least three generations, along with wild-type BALB/cJ males from Taconic and wild-type CD1 males. Experimental Vgat+/− and CD1 mice were sexually naive and 12–18 weeks old. BALB/cJ mice used as social targets were sexually naive and 8–26 weeks old. Aggressors used in hard fights were single-housed, aggression-experienced males aged 16–25 weeks. Mice used for optogenetically simulated fights were 15–16-week-old Esr1-cre+/− males backcrossed to CD1 for at least three generations.
Before fibre photometry experiments, Vgat+/− and wild-type CD1 mice used in aggression or observation experiments were socially isolated for at least one week. Animals were bred at Princeton or obtained from Taconic Biosciences or Charles River. Assignment to the EXP, OBS and NON groups was random, subject to the availability of animals with the required genotype. Experimenters were blinded to group identity during behavioural scoring and histological verification, although blinding during data collection was not possible because the group was evident from the experimental setup.
Behavioural assays
Aggression experience, observation and non-social controls
Animals underwent longitudinal resident–intruder experiments for eight consecutive days. EXP mice received unrestricted access to three different male BALB/cJ intruders in three separate 9 min sessions each day. Each session was preceded by a 1 min baseline without a social stimulus. The interactions took place in the experimental animal’s home cage, which measured 34.3 cm × 29.2 cm × 15.5 cm.
For the OBS condition, each observer mouse occupied a compartment at the front of a cage extender made from black acrylic and clear plexiglass. The compartment measured 10 cm × 13 cm × 17 cm and was separated from the cage floor by a clear barrier containing horizontal openings that allowed visual and olfactory access. Each observer was paired with a unique CD1 male. The paired CD1 mouse underwent three consecutive resident–intruder sessions in its home cage on each of the eight days. Before the sessions began, the observer and the paired CD1 mouse were allowed up to 15 min to habituate while separated by the barrier. Each session then consisted of 9 min of interaction between the CD1 resident and a different male BALB/cJ intruder, preceded by a 1 min baseline.
NON mice were exposed to an inanimate toy resembling a mouse for the same duration and number of sessions as the EXP and OBS animals. Although OBS mice did not directly engage in social behaviour during training, they underwent photometry recordings so that any signal decay associated with repeated imaging would be comparable across groups.
On day 9, mice from all groups underwent a hard fight consisting of three consecutive 4–5 min resident–intruder sessions in their home cage, preceded by a 1 min solitary baseline. In each session, the experimental animal had unrestricted access to a unique undefeated CD1 aggressor that had previously been screened for aggression against other CD1 males. Two EXP animals were inadvertently exposed to CD1 aggressors outside the scheduled protocol and were excluded from hard-fight behavioural analyses. Their neural data were retained because the exclusion concerned behavioural interpretation rather than data quality. The final sample sizes were 10 EXP animals for behavioural analyses and 12 EXP animals for neural analyses.
Familiar and novel aggressors
To compare responses to familiar and novel males, mice were first defeated in their home cage by a unique screened CD1 aggressor during a 9 min interaction preceded by a 1 min baseline. The defeated animals then watched four resident–intruder sessions from the observer compartment. Two sessions involved the familiar CD1 aggressor and two involved a novel CD1 male that the observer had not previously encountered. Each session included 9 min of interaction between the CD1 resident and a different BALB/cJ intruder, preceded by a 1 min baseline. The order of familiar and novel sessions was randomized, and subsequent neural analyses used only the first session of each type.
Simulated attacks
For simulated attack observations, the researchers expressed ChR2(H134R)-mCherry unilaterally in the VMHvl of Esr1+/− CD1 males. After viral expression, the mice were screened for stimulation-evoked attacks on an inanimate toy mouse. Observers watched both optogenetically evoked attack-like behaviour directed at the toy and naturalistic aggression directed at a live BALB/cJ intruder. Each trial began with a 1 min baseline, followed by 5 min of intermittent optogenetic stimulation. Immediately afterwards, the same observer watched a standard resident–intruder session involving the same resident and a live BALB/cJ intruder, again preceded by a 1 min baseline. This within-animal design controlled for the identity of the observed aggressor.
Video acquisition and behavioural analysis
Social interactions were recorded with customized multi-camera systems containing top and side cameras operating at 40 Hz. A data-acquisition device and Measurement Computing software synchronized the cameras with an FP3002 CMOS camera. The top camera was positioned 50 cm above the home cage, and the side camera was 30 cm high and within 3 cm of the observer compartment. Black paper-chip bedding was used, and food pellets and other objects were removed before recording. Behavioural analyses used the top-down view because it approximated what observers saw from the raised platform.
Manual annotation and pose tracking
Manual annotations were made with BORIS v.9.3.2. During training, attack behaviour was defined as rapid forward movement by the resident towards the intruder, including chases and lunges. The annotated dataset contained 29,805 attack frames among 759,074 frames from 49 videos.
Hard-fight videos were scored manually while blinded to group identity. Five categories were defined: attacks delivered without resistance; attacks delivered with resistance; attacks received without resistance; attacks received with resistance; and fleeing. Delivered attacks without resistance were forward lunges or chases that caused the CD1 aggressor to flee or remain passive. Delivered attacks with resistance caused active defence, such as counter-biting or physical pushback. Received attacks without resistance involved the experimental mouse being attacked without retaliating or pushing back, whereas received attacks with resistance involved active defence. Fleeing was rapid movement away from the aggressor after an attack, approach or investigation.
SLEAP v.1.2.2 was used to track resident and intruder positions. A total of 6,305 frames from 141 videos were labelled and divided into training and test sets using an 80:20 split. The tracked points included the nose, head, neck, both ears, trunk, all four paws, tail base, three tail segments and tail tip. The model was trained for 93 iterations with a bottom-up approach, using U-Net initialization and a batch size of 4.
Behavioural features and supervised classification
Pose data were converted into 19 features describing body length, body orientation, overlap between animals, head and centroid speeds, lagged speeds within a ±3 s window, head-centroid angles, head-to-tailbase distances and distances between the animals’ centroids and heads. Pixel-based distances were converted to centimetres using stereo-camera parameters and pixel-depth information.
For each session, values more than 3 standard deviations from the session mean were removed, features were smoothed with a 0.275 s Gaussian filter, missing values were linearly interpolated, and the data were z-scored using means and standard deviations pooled across sessions. This pooled normalization was intended to preserve broader differences in feature dynamics rather than forcing every session to unit variance.
A supervised multilayer perceptron was trained with Keras and TensorFlow v.2.11.0 to detect attacks during training sessions. The sequential model contained an input layer, two hidden layers interleaved with batch normalization, and a sigmoid output layer. The input and hidden layers each contained 512 ReLU units. The training labels comprised 29,805 attack frames and 729,269 non-attack frames. In addition to the 19 pose-derived features, the model used 19 lagged features describing temporal dynamics.
Because attack frames were less common, they were oversampled using a synthetic time-series procedure. The resulting dataset contained 699,464 attack frames and 729,269 non-attack frames and was divided into training and validation sets using a 67:33 split. A separate held-out test set contained 13,747 attack frames and 433,936 non-attack frames. Its balanced accuracy was 0.92. A frame was classified as an attack when the predicted probability exceeded 0.25, provided that the bout lasted at least 200 ms and was separated from neighbouring bouts by at least 200 ms.
Supervised classification was not applied to NON mice because they did not participate in social interactions. Instead, their labels were generated through a yoked design using labels from a randomly assigned EXP or OBS mouse recorded on the corresponding day and session. Hard-fight analyses used only blinded manual annotations because those sessions involved bidirectional aggression and were not suitable for one-sided attack classification.
Unsupervised behaviour embedding
To characterize behaviour without relying solely on predefined labels, the 19 features were embedded in two dimensions using UMAP and divided into high-density clusters. An importance-sampling procedure first selected 80,000 frames uniformly from 504 videos and added 20,000 frames aligned to attacks. These 100,000 frames were embedded with UMAP using 50 neighbours and a minimum distance of 0.1. The result was binned into a 200 × 200 histogram, smoothed with a two-dimensional Gaussian kernel and divided into 21 clusters with watershed segmentation.
A multilayer perceptron was then trained to map the original 19-dimensional feature space into the UMAP space. Two frames from each of the 21 clusters in every recorded session were sampled, producing 21,168 frames, and used to generate a final embedding. The complete set of frames was mapped into this embedding and divided into 13 final clusters. NON labels were again generated through a yoked design.
For each cluster, the researchers measured occupancy, persistence and frame-to-frame transition probabilities. Transition matrices were tested against surrogate sequences that preserved self-transitions and empirical state-duration distributions while replacing off-diagonal transitions with uniform probabilities. A total of 104 surrogate sequences, each containing 105 samples, were generated. The 156 off-diagonal transitions were tested and corrected using a false discovery rate of 0.05. Hierarchical clustering used complete linkage and Jensen–Shannon distance.
Support-vector-machine classifiers with leave-one-session-out cross-validation were used to test whether occupancy, persistence or transition patterns predicted group identity. Statistical significance was evaluated with 1,000 shuffled group-label permutations. Additional classifiers were used to compare OBS and EXP-like or NON-like behavioural profiles. Jensen–Shannon divergence was calculated for occupancy and transition distributions, with category- or row-wise averaging used to reduce the influence of highly common behavioural states. Values closer to zero indicated greater similarity.
Video classification of observer behaviour
A separate deep neural network classified observer behaviour directly from raw video. The model processed 20-frame clips, corresponding to 0.5 s at 40 fps, and assigned probabilities to seven labels: attention, grooming, scratching, still, investigate, rearing and turning. It was implemented in PyTorch v.2.5.1.
The encoder consisted of four three-dimensional convolutional layers. Each layer used 3 × 3 × 3 convolutions, batch normalization, ReLU activation, 2 × 2 × 2 max pooling and a spatiotemporal attention module. Channel dimensions increased from 64 to 128, 256 and 512, and global average pooling produced a 512-dimensional representation. A three-layer classifier mapped this representation through 512, 256, 128 and 7 units, with dropout of 0.3. The outputs were converted to class probabilities with softmax.
The attention mechanism was adapted from CBAM for video. It first calculated channel weights using adaptive average pooling and a bottleneck with a reduction ratio of 8. A second three-dimensional convolution generated a spatiotemporal attention map, allowing the network to emphasize behaviourally relevant regions such as the hind limbs during scratching or the head during grooming.
The classifier was trained with AdamW for 300 epochs using cross-entropy loss with label smoothing of 0.1. The classifier learning rate was 3 × 10⁻⁴, while the encoder learning rate increased from 7 × 10⁻⁵ to 3 × 10⁻⁴ during the first 20 epochs. Training used an effective batch size of 256, gradient clipping with a maximum norm of 1.0 and mixed-precision FP16 training. Models reached approximately 86% validation accuracy and 92% training accuracy.
The manually labelled dataset contained approximately 18,000 frames: rearing 6%, turning 5%, investigate 7%, still 10%, grooming 22%, scratching 8% and attention 43%. Fivefold cross-validation was used. For the main analyses, the seven labels were combined into four categories: exploratory behaviour, idle behaviour, self-directed behaviour and attention. Performance was evaluated using the area under the receiver operating characteristic curve.
Surgery and neural recording
Viral injections and implants
At 12–18 weeks of age, Vgat+/− mice were anaesthetized with isoflurane and placed in a stereotaxic frame. A 1:1 mixture containing 300 nl of Cre-out GCaMP6f and Cre-activated jRCaMP1b was injected unilaterally into the PrL, vLS, mPOA, BNST, AH, VMHvl, LHb, MeA, PA, PMv and lPAG. An additional 150 nl of GRAB DA1m was delivered to the NAc. All regions included in the final analyses had correctly positioned fibres according to histology.
For chemogenetic experiments, Vgat+/− or wild-type Vgat−/− mice received bilateral injections of 150 nl of Cre-dependent hM3Dq-mCherry into the MeA, vLS, PMv and AH. This expressed the Gq-coupled receptor in Vgat-positive inhibitory neurons in Vgat+/− mice and served as a control in wild-type animals. For optogenetic experiments, Esr1+/− mice received 150 nl of a Cre-dependent ChR2(H134R)-mCherry vector in the right VMHvl.
A custom multi-fibre implant containing twelve 200 μm-core optic fibres was fixed to the skull with Metabond. The implant was lowered 5.55 mm relative to the VMHvl brain surface. The fibres were cut to match the depth of each targeted region. Before implantation, bulk light efficiency was measured; implants with average efficiency below 70% were discarded. Mice recovered for at least three weeks before recording.
Fibre photometry
Recordings from up to 12 sites were made with a custom branching patchcord. Excitation LEDs delivered 470 nm light for GCaMP6f and DA1m, 560 nm light for jRCaMP1b and 415 nm light as a calcium- and dopamine-independent control. The wavelengths were interleaved at 40 Hz, producing a total sampling rate of 120 Hz. Fluorescence was split at 552 nm and detected with a CMOS sensor.
Signals were processed by subtracting the baseline with an adaptive iteratively reweighted penalized least-squares algorithm, z-scoring, and regressing out motion-related activity using 415 nm control signals. Ridge-regression regularization was selected separately for each session. The corrected signals were normalized to the mean activity during the 1 min baseline before social interaction and expressed as z-scored ΔF/F. A Savitzky–Golay filter with a seven-sample window and third-order polynomial was used to remove residual high-frequency artefacts. The traces were then linearly resampled to match the temporal resolution of the SLEAP-derived behavioural features.
For optogenetic stimulation, a 460 nm blue laser delivered 20 ms pulses at 20 Hz with a 40% duty cycle. An Arduino system converted manual button presses into trains of pulses with 20 ms on and 30 ms off periods.
Neural analysis
Time alignment and peri-event activity
Because neural responses could occur at variable delays relative to attack onset, the researchers used a shift-only time-warping procedure based on the ShiftWarping algorithm in affinewarp v.0.20.0. The procedure learned one temporal shift per trial without stretching or compressing the signal. The shift was determined jointly from all simultaneously recorded populations rather than separately for each brain region.
EXP trials covered −6 s to +6 s around attacks and were limited to a maximum shift of ±0.5 s. OBS trials allowed a maximum shift of ±2 s and used smoothness, warp and L2 regularization. Seven of nine observer animals were used to fit the primary model, and the remaining two were aligned to the learned template. NON data were aligned using the OBS template and the same parameters. Missing regions were temporarily replaced with the nearest available region during shift optimization and restored as missing values in the final data.
Three controls tested whether the alignment captured aggression-specific activity: synthetic attack sequences generated with a tenth-order Markov chain, high-resident-speed events defined by centroid velocity above 2 z-score units, and a yoked analysis applying the OBS model to NON data. Peri-event time histograms were computed after alignment, with baseline correction using the median activity from −5 s to −3 s before the event. For attention-filtered analyses, trials required at least 5 s of positive attention during the attack window.
Decoding behaviour and social context
Observer behaviour was decoded from 1.5 s neural windows with a 0.75 s stride. Windows were retained when one behavioural category occupied at least 90% of the frames. Ten summary statistics were extracted from each of 19 neural populations, producing 190 features. Logistic-regression classifiers were evaluated with blocked, stratified fivefold cross-validation repeated 10 times. Comparisons were made between a decoder using all regions and the best single-region decoder. Chance performance was estimated with 100 label permutations per animal and category. SHAP values were used to estimate each population’s contribution.
Additional single-region logistic-regression analyses tested whether attack-aligned activity encoded whether aggression was directed towards a live conspecific or a toy, whether the aggressor was familiar or novel, and whether attacks differed in vigour or effectiveness. High- and low-vigour trials were defined using the 90th and 10th percentiles of resident attack speed. Attack effectiveness was similarly defined using the intruder’s flight speed.
For each neural population, response half-life was measured from the peak of the baseline-corrected attack-aligned trace. Peaks were searched for between −0.5 s and +0.5 s, and half-life was the time until the signal first crossed 50% of the peak after attack onset. Linear interpolation provided sub-frame precision. Signals that did not reach the half-peak level were classified as non-decaying and assigned missing values.
Neural and behavioural similarity
For each neural population, activity was averaged within each of the 13 UMAP behavioural clusters to create a 13-element activity vector. Similarity between sessions was quantified using cosine distance. Training-period vectors were mean-centred and compared with a soft cosine distance that grouped clusters into aggressive, investigative and asocial categories. Hard-fight comparisons used standard cosine distance without mean-centring.
To determine whether network activity distinguished EXP from NON animals, linear discriminant analysis was applied to population activity during social behavioural clusters. Models were trained on EXP and NON animals and evaluated with leave-one-out cross-validation and 1,000 permutations. OBS animals were held out and projected onto the learned EXP–NON axis. A normalized value of 0 represented the EXP end of the axis, while 1 represented the NON end. Principal-component analysis provided a complementary visualization.
Shared and unique variance
An automatic relevance determination regression framework was used to estimate the unique and shared contributions of recorded regions to VMHvl excitatory activity. Predictor regions included VMHvl inhibitory, lPAG excitatory, PMv excitatory, PMv inhibitory, AH inhibitory, MeA inhibitory, BNST inhibitory and vLS inhibitory populations. Epochs with fewer than 80 timepoints or regions containing only missing values were excluded.
Full models used threefold cross-validation. Unique variance was estimated by permuting one predictor during testing and comparing the resulting out-of-sample R2 with the full model. Marginal variance was estimated with a single-predictor ordinary least-squares model, and shared variance was defined as marginal variance minus unique variance, with negative values set to zero. Linear mixed-effects models tested changes in unique variance across the eight training days, using day as a fixed effect and animal as a random intercept.
Finally, linear Gaussian generalized linear models estimated how each neural signal encoded each behavioural feature. Feature values were divided into 20 bins, and leave-one-animal-out cross-validation assessed group-specific tuning. Feature–region pairs were analysed further only when at least two of the EXP, OBS and NON groups showed cross-validated R2 significantly above zero.
Histology
After experiments, mice were deeply anaesthetized with ketamine and xylazine and perfused with 4% paraformaldehyde in PBS. Brains were post-fixed for 12–24 h. In five of 12 EXP mice, tissue was cleared with iDISCO+, imaged with light-sheet microscopy at ×1.1 or ×1.3 magnification and registered to the Paxinos Atlas. Fibre tips were identified manually and mapped to anatomically defined subregions.
In a separate subset—7 of 12 EXP, 7 of 9 OBS and 6 of 8 NON mice—brains were cryoprotected in 30% sucrose, embedded in OCT compound and sectioned at 30 μm. Sections were stained and imaged with a NanoZoomer S60 digital slide scanner. Fibre placement summaries are provided in Extended Data Fig. 4, with coronal reference sections adapted from the Allen Reference Atlas. Experimenters were blinded to group identity during histological verification.
Chemogenetic perturbation
To test the causal contribution of inhibitory populations to observation-related changes in aggression, a separate cohort of OBS-Gq Vgat+/− mice expressing hM3Dq-mCherry and OBS-control wild-type Vgat−/− littermates underwent five days of observation training. Each day included three resident–intruder observation sessions. On day 6, the animals underwent a hard fight with a screened CD1 aggressor.
Thirty minutes before the hard fight, mice received an intraperitoneal injection of clozapine-N-oxide at 1 mg kg−1 and were returned to their home cages. Behavioural outcomes were compared between the OBS-Gq and OBS-control groups using unsupervised clustering and annotated fight-outcome categories. Group assignment was determined by genotype; both groups received identical viral injections and CNO. Experimenters were not blinded to genotype during CNO administration.
Statistical analysis
Analyses were performed in Python v.3.9.23 using NumPy 1.23.0, pandas 2.3.1, Matplotlib 3.9.4, seaborn 0.13.2, SciPy 1.13.1, scikit-learn 1.6.1 and statsmodels 0.14.5. Individual animals were the biological replicates unless the scientific question concerned trial-level neural–behavioural relationships, for which individual trials were used.
Independent and paired comparisons were selected according to the experimental design. Normality was assessed with the Shapiro–Wilk test and variance equality with Levene’s test. Depending on distribution and variance, two-group comparisons used Student’s or Welch’s t-tests, or the Brunner–Munzel test, with the Mann–Whitney U-test used as a fallback when the Brunner–Munzel statistic was undefined. Paired comparisons used paired t-tests or Wilcoxon signed-rank tests.
For three independent groups, the researchers used one-way ANOVA, Welch’s ANOVA or Kruskal–Wallis tests as appropriate, followed by corrected pairwise tests. The single analysis involving three related conditions used a Friedman test followed by corrected Wilcoxon tests. Other analyses used Kolmogorov–Smirnov tests, one-sample tests against chance decoding accuracy of 0.5, permutation tests or linear mixed-effects models, as specified for each analysis.
One-sided tests were used only when a directional hypothesis had been specified in advance; otherwise, tests were two-sided. Multiple comparisons were corrected with Bonferroni or false-discovery-rate procedures. For mixed-effects models, up to six optimization and estimation combinations were attempted, and non-converged models were excluded. The study followed Nature Portfolio recommendations for inclusion and ethics in global research, and additional design information was provided in the linked Nature Portfolio Reporting Summary.
Source: www.nature.com