


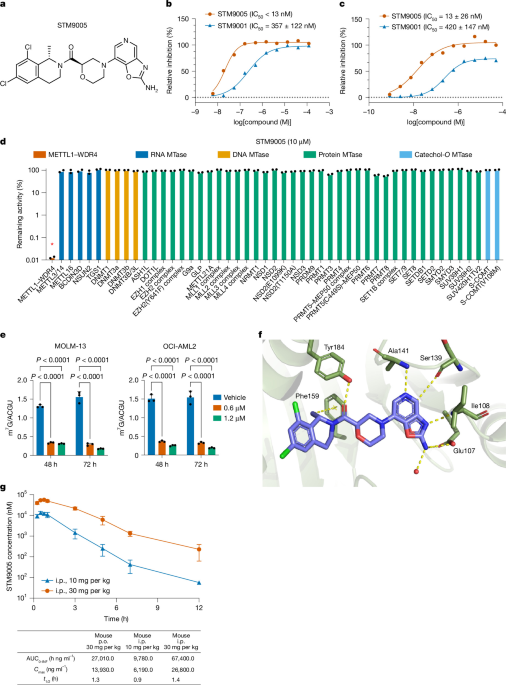
The study developed and characterized the METTL1–WDR4 RNA methyltransferase system using purified human protein, biochemical and biophysical assays, cellular models, sequencing, and mouse experiments. Full-length His-tagged METTL1 and Flag-tagged WDR4 were co-expressed in insect cells, while a truncated METTL1 construct was prepared for X-ray crystallography. The work evaluated the inhibitor STM9005 and related compounds through RapidFire mass spectrometry, surface plasmon resonance, selectivity panels, cellular target-engagement assays, cancer-cell proliferation experiments, RNA and ribosome profiling, and several mouse tumour models. The experimental procedures, including controls, ethical approvals and statistical limitations, are described below.
Protein production and purification
Full-length METTL1–WDR4 complex
Sf21 cells in Sf-900 II serum-free medium (Gibco, 11497-013) were co-infected with baculoviruses encoding His-tagged METTL1 and Flag-tagged WDR4 at a multiplicity of infection of 1 for each virus. Cultures were incubated for 72 h at 27 °C and 110 rpm. Cells were collected by centrifugation at 3,400g for 15 min at 4 °C, and pellets were stored at −80 °C.
Pellets were lysed in 25 mM Tris, pH 8.0, 300 mM NaCl, 1 mM TCEP, 5% glycerol, 0.25% CHAPS and 1 mM PMSF, supplemented with protease inhibitor tablets and 10 U ml−1 benzonase. Homogenization was performed for two cycles at 20 kilopounds per square inch using an IKA high-pressure homogenizer. Lysates were centrifuged briefly between cycles at 2,000 rpm for 15 min to remove foam, then clarified by ultracentrifugation at 150,000g for 45 min at 4 °C.
The complex was purified sequentially by immobilized metal-affinity chromatography (IMAC), desalting, ion-exchange chromatography (IEX) and size-exclusion chromatography (SEC). IMAC used a 5 ml HisTrap FF Crude column (Cytiva) at 4 ml min−1. The column was washed with IMAC buffer A containing 25 mM Tris, pH 8.0, 300 mM NaCl, 1 mM TCEP, 5% glycerol and 20 mM imidazole. Complexes were eluted with a 0–100% gradient of IMAC buffer B, which consisted of buffer A plus 500 mM imidazole, over 15 column volumes (CV).
Desalting was performed on a 53 ml HiPrep column (Cytiva) at 5 ml min−1 in 25 mM Tris, pH 8.0, 50 mM NaCl, 1 mM TCEP and 5% glycerol. IEX used a 5 ml HiTrap Q HP anion-exchange column at 4 ml min−1. The column was washed with the same low-salt buffer and eluted with a 0–100% gradient over 15 CV, followed by 5 CV at 100% of IEX buffer B, containing 25 mM Tris, pH 8.0, 1 M NaCl, 1 mM TCEP and 5% glycerol.
SEC was performed on a 320 ml Superdex S200 26/60 column (Cytiva) at 2 ml min−1 in 25 mM Tris, pH 8.0, 300 mM NaCl, 1 mM TCEP, 5% glycerol and 3 μM S-adenosylmethionine (SAM; Santa Cruz Biotechnology, sc-286738C). Samples were concentrated using an Amicon-15 centrifugal filter with a 10,000 molecular-weight cut-off (Merck).
In-vitro transcription of the pre-tRNA-Phe substrate
The METTL1–WDR4 substrate pre-tRNA-Phe2 was generated with the TranscriptAid T7 High Yield Transcription Kit (Thermo Fisher Scientific, K0441). DNA templates were purchased from IDT as complementary upper- and lower-strand Ultramer oligonucleotides containing the T7 promoter sequence TAATACGACTCACTATAGGG; the sequences are listed in Supplementary Table 15.
Transcription products were purified with the RNA Clean & Concentrator-25 Kit (Zymo Research, R1018). For denaturation and renaturation, tRNA was diluted in annealing buffer containing 10 mM Tris, pH 8.0, 50 mM NaCl and 1 mM EDTA. Samples were heated to 94 °C for 5 min and allowed to cool slowly to room temperature in a Thermomixer Comfort (Eppendorf), then snap-frozen and stored at −80 °C.
Biochemical and binding assays
RapidFire mass-spectrometry methyltransferase assay
The RapidFire mass-spectrometry assay was established to determine inhibitor IC50 values. The enzyme was full-length human His-tagged METTL1 co-expressed with full-length human Flag-tagged WDR4 in a baculovirus system and purified as described above.
Reactions contained 25 nM METTL1–WDR4 complex, which was pre-incubated with different compound concentrations for 10 min. In-vitro-transcribed pre-tRNA-Phe and SAM were then added to final concentrations of 1 µM each. Reactions continued for 90 min at 37 °C before being quenched with 40 µl of 7.5% trichloroacetic acid containing D4-SAH and 13C10-SAH as internal product standards. Plates were sealed, centrifuged and stored at 4 °C until analysis.
METTL1–WDR4 activity was measured without an external label using the RapidFire MS platform, as described previously.27 IC50 values were calculated from activity measurements across inhibitor dilution series. Relative inhibition was normalized to control wells containing either 1 µM sinefungin (Merck, S8559) for full inhibition or DMSO alone for no inhibition. Data were fitted with a four-parameter logistic equation in GraphPad Prism v.10.
Surface plasmon resonance
Compound binding to METTL1 was characterized on a Biacore 8K instrument (GE HealthCare) using Series S NTA chips at 20 °C. For kinetic measurements, approximately 2,000–3,000 response units of the His–METTL1–WDR4 complex were immobilized on flow cell 2. The sensor chip was pre-activated with EDC/NHS according to the manufacturer’s instructions.
The running buffer contained 20 mM HEPES, pH 7.5, 150 mM NaCl, 1 mM TCEP and 0.05% Tween-20. After protein capture, the surface was washed with 60 s pulses of ethanolamine and 10 mM EDTA. Serial compound dilutions in running buffer containing 2% DMSO were injected in single-cycle kinetics mode, with 90 s association at 80 μl min−1. Dissociation was monitored for 5,000 s.
Data were processed with Biacore Insight Evaluation software v.3.0.12. Signals from reference flow cell 1, which contained no protein, were subtracted from those recorded on the METTL1–WDR4 surface. Buffer-only injections provided double referencing, and solvent correction was applied to account for buffer mismatches. Kinetic parameters were obtained by fitting the data to a simple 1:1 Langmuir interaction model.
STM9005 selectivity profiling
STM9005 selectivity was assessed by measuring inhibition across a methyltransferase panel supplied by Reaction Biology. Five additional RNA methyltransferases were tested using the RapidFire MS assay described previously.27 Data were plotted in GraphPad Prism v.10. Additional profiling used the commercial SAFETYscan and KINOMEscan scanEDGE panels from Eurofins DiscoverX, following the provider’s standard protocols.
X-ray crystallography
Protein expression and purification
The crystallography construct was designed to match the protein boundaries used in PDB structure 3CKK: residues 32–265 of METTL1, with an N-terminal His tag followed by a TEV protease cleavage site. The synthetic construct was cloned into pTriIJ-HV (Evotec).
The protein was expressed in BL21-CodonPlus (DE3)-RIL cells grown in Terrific Broth (Teknova, T7060) at 37 °C. At an optical density at 600 nm of 1.5, expression was induced with 1 mM IPTG and continued for 18 h at 15 °C. Cells were collected at 4,000g for 20 min at 4 °C and stored at −80 °C.
Cells were disrupted at 25,000 psi and 4 °C using a Constant Systems cell disruptor in 20 mM HEPES, pH 7.4, 500 mM NaCl, 2 mM β-mercaptoethanol, 5% glycerol, 1 mM PMSF and 40 µl l−1 benzonase. Debris was removed by centrifugation at 200,000g for 45 min at 4 °C. The supernatant was loaded onto a 5 ml HisTrap Crude FF column (Cytiva), washed with 10 CV of buffer containing 50 mM imidazole, and eluted with 250 mM imidazole.
The protein was dialysed for 18 h at 4 °C in 20 mM HEPES, pH 7.4, and 250 mM NaCl in the presence of TEV protease (Evotec). It was then loaded onto a 5 ml HiTrap SP HP ion-exchange column, washed with 20 mM PIPES, pH 6.5, and eluted with a linear gradient to 500 mM NaCl. Protein was concentrated with a 10 kDa molecular-weight cut-off centrifugal concentrator to 28.7 mg ml−1 and flash-frozen in liquid nitrogen.
Crystallization and compound soaking
Protein samples were thawed to 4 °C and incubated on ice for 1 h with 10 mM STM00005451, also called STM5451, at a final DMSO concentration of 2%. Crystals were grown by hanging-drop vapour diffusion from 1 µl protein mixed with 1 µl reservoir solution containing 100 mM Bis-Tris, pH 5.5, 200 mM lithium sulfate and 20% (w/v) PEG 3350. Seeding was used to improve reproducibility, and crystals grew overnight at 22 °C.
To replace STM5451 with STM9005, crystals were transferred into 2 µl reservoir solution containing 25 mM STM9005 and 5% DMSO and incubated for 24 h at 22 °C. Crystals were cryoprotected by adding 15% PEG to the soaking solution and then collected in liquid nitrogen.
Data collection and structure determination
Diffraction data were collected at 100 K on beamline ID17B at the Advanced Photon Source using a 1.0 Å wavelength. Data were processed with autoPROC and STARANISO.38–43 An in-house-generated model derived originally from PDB 3CKK was used for molecular replacement with dimple.44,45 Model building and refinement were performed iteratively with Coot and Buster.46,47 STM9005 was fitted using restraints generated by Grade2.48
Final structure statistics are provided in Extended Data Table 1. All protein residues were favoured in the Ramachandran analysis. The structure was deposited in the Protein Data Bank under accession code 9RYL. Structural analysis used Molecular Operating Environment (Chemical Computing Group), and images were produced with PyMOL Molecular Graphics System v.2.6.0a0 (Schrödinger).
Cellular target engagement and cell culture
METTL1 target engagement
Cellular target engagement by STM9005 was measured by thermal shift using InCELL Pulse technology (Eurofins DiscoverX). HeLa cells were transfected with 9 µg of pcDNA3.1-WDR4-P2A-METTL1-ePL and 21 µg of pcDNA3.1(+) empty-vector carrier using FuGENE (Promega). Twenty-four hours after transfection, cells were frozen and stored in liquid nitrogen until the assay.
Eleven-point, threefold compound dilutions were dispensed into 384-well assay plates with a top assay concentration of 50 μM and a final DMSO concentration of 0.5%. Frozen WDR4-P2A-METTL1-ePL HeLa cells were thawed, washed with Opti-MEM and seeded at 1,500 cells per well in 20 µl. Plates were incubated for 1 h at 37 °C and 5% CO2. A 60 °C heat pulse was applied for 5 min, followed by 10 min at room temperature and brief centrifugation.
Detection solution from the InCELL Detection Kit was then added at 25 µl per well and incubated for 30 min in the dark at room temperature. A 42 µl portion of each reaction was transferred to a measurement plate, and luminescence was measured with an EnVision multimode plate reader. Values were normalized to wells with full stabilization containing 50 µM reference compound and wells without stabilization containing DMSO. IC50 values were calculated in GraphPad Prism v.10.
Cell lines and primary cells
HL-60, K562, Loucy, MOLM-13, MV-4-11, PEER, H1299, H1975, OE21 and OE33 cells were cultured in RPMI-1640 with l-glutamine, 10% FBS and 1% penicillin–streptomycin. B16F10, mouse pancreatic ductal adenocarcinoma cells mPDAC1 and mPDAC2, and HEK293FT cells were maintained in DMEM with l-glutamine, 10% FBS and 1% penicillin–streptomycin. A549, LoVo and SK-MES-1 cells were cultured in F-12K nutrient mix with l-glutamine, 10% FBS and 1% penicillin–streptomycin. SW982 cells were maintained in DMEM supplemented with 10% FBS, 1% sodium pyruvate and 1% penicillin–streptomycin.
OCI-AML2 and OCI-AML3 cells were cultured in Alpha-MEM with l-glutamine, 20% FBS and 1% penicillin–streptomycin. HeLa cells were grown in MEM with 10% FBS, 1% l-glutamine and 1% non-essential amino acids. All cells were maintained at 37 °C and 5% CO2. MOLM-13, K562, HL-60, MV-411, PEER, Loucy, OCI-AML2 and OCI-AML3 cells came from the Sanger Institute Cancer Cell Collection. OE21 and OE33 were purchased from Merck, and all other cell lines were purchased from ATCC. All cell lines tested negative for mycoplasma.
Primary mouse MLL-AF9/Flt3ITD/+, MLL-AF4/Flt3ITD/+, Npm1cA+Flt3ITD/+ and MLL-ENL/Flt3ITD/+ cells were generated as described previously.31 Npm1cA+NrasG12D/+ mice were described previously.49 Primary Dnmt3aR882H/+Npm1cA/+ cells were obtained by crossing Dnmt3aR992H/+ mice with Npm1cA/+ mice.45,50 Npm1cA/+NrasG12D/+Idh1R132H/+ cells came from mice generated by crossing Npm1cA/+NrasG12D/+ mice with Idh1R132H/+ mice.51 Primary mouse cells were maintained in X-VIVO 20 supplemented with 5% FBS, 1% GlutaMax, 1% penicillin–streptomycin, 50 ng ml−1 mouse stem-cell factor, 10 ng ml−1 mouse IL-3 and 10 ng ml−1 mouse IL-6.
Vectors and lentiviral production
Cas9 was introduced with the pKLV2-EF1a-Cas9-2A-Bsd-W lentiviral vector (Addgene, 68343). Guide RNAs were cloned into pKLV2-U6gRNA5(BbsI)-PGKpuro2A-mAzamiGreen (Addgene, 67976), as described previously.30,52 Guide sequences are listed in Supplementary Table 15. The overexpression vectors pLKO.1-puro-ΔU6-Arg-TCT-4-1 and control pLKO.1-puro-ΔU6 were described previously.11
The pKLV-EF1a-puro-TY1 vector was generated by replacing Cas9 in pKLV-EF1a-puro2A-hCas9 with a 2×TY1 tag and adding XmaI and XbaI sites. Human CDK4 and MYC were amplified from MOLM-13 cDNA, and human METTL1 from A549 cDNA. The resulting constructs were pKLV-EF1a-puro2A-2×TY1-hCDK4, pKLV-EF1a-puro2A-2×TY1-hMYC and pKLV-EF1a-puro2A-2×TY1-hMETTL1. Mouse Cdk4, Myc and Mettl1 were amplified from B16F10 cDNA to generate the corresponding mouse constructs. METTL1 mutants were made with the Q5 site-directed mutagenesis kit by introducing L160A and D163A into human METTL1 or L154A and D157A into mouse Mettl1. Primer sequences are provided in Supplementary Table 15.
For competition assays and Arg-TCT overexpression, HEK293FT cells were transfected in 12-well plates with the appropriate gRNA vector and packaging plasmids pPAX2 and pMD.2G at a 1:2.5:0.05 ratio. Supernatants were collected after 48 h, passed through 45 μm PVDF filters and stored at −80 °C.
For Cas9, CDK4, MYC and METTL1 overexpression, HEK293FT cells in 15 cm dishes were transfected with the relevant lentiviral vector, pPAX2 and pMD.2G at a 1:1:0.2 ratio. Supernatants were collected at 48 and 72 h, filtered through 0.45 μm PVDF filters, combined and concentrated by overnight centrifugation at 6,000g and 4 °C. Viral pellets were resuspended in PBS at 10× concentration.
Cellular assays
Competition and overexpression experiments
Suspension cells were seeded at 0.25 × 10⁶ cells per well and transduced in 2 ml of medium containing polybrene at 8 μg ml−1 for human cells or 4 µg ml−1 for mouse cells. Spinfection was performed for 1 h at 900g and 32 °C. Adherent cells were seeded at 0.05–0.5 × 10⁶ cells per well, transduced in 2 ml and passaged after reaching confluence.
Four days after transduction, flow cytometry confirmed an efficiency of 50% ± 10%. The percentage of transduced cells was then monitored on days 7, 10 and 13. DAPI was used as a live/dead stain, and analysis was performed with CytoFLEX and FlowJo. Gating strategies are provided in Supplementary Fig. 2.
For overexpression experiments, cells were selected with 1 µg ml−1 puromycin on days 3 and 5 after transduction. Subsequent experiments began 6–10 days after transduction.
Proliferation assays
Suspension cells were seeded at 12,500 cells per 100 µl and treated for 3 days with vehicle or STM9005 at concentrations from 100 μM to 781 nM. Cells were then passaged and retreated with fresh compound while maintaining the original cell density. Adherent cells were seeded at densities expected to produce 80–90% confluence by day 6 and were retreated on day 3. On day 6, proliferation was measured with the CellTiter 96 AQueous Non-Radioactive Cell Proliferation Assay. Absorbance was read at 490 nm on a CLARIOStar Plus microplate reader.
In an optimized assay, A549, OE21 and LoVo cells were seeded at 400, 1,000 and 2,500 cells per well, respectively, in 96-well plates. After 18 h, the medium was replaced with assay medium containing 2% FBS for OE21 or 2.5% FBS for A549 and LoVo. Cells were treated for 7 days, then measured with CellTiter-Glo. Luminescence was read on a SpectraMax i3x or EnVision multimode reader.
Primary human hepatocytes came from liver biopsies from deceased organ donors who had provided informed consent. Tissue was dissociated mechanically and enzymatically and cultured in modified HM medium. Cells were treated with vehicle or STM9005 for 72 h, and viability was measured with CellTiter-Glo. Doxorubicin was used as a positive control. Each experiment used three biopsy samples from two donor livers, under Research Ethics Committee approval REC 23/NS/0106.
Confluency, colony and blood-cell assays
For methylene-blue assays, adherent cells were seeded to reach confluence in 3 days in control wells. Cells were passaged and retreated on days 3, 6 and 9. On days 3, 6, 9 and 12, cultures were stained for 20 min with 1% methylene blue in 70% ethanol, washed, dried and scanned with an Epson Perfection V850. Images were analysed with ImageJ v.1.54 and normalized to untreated controls.
For serial replating of mouse cells, 100,000 wild-type bone-marrow cells or 10,000 primary MLL-AF9/Flt3ITD/+ cells were suspended in 3 ml methylcellulose containing 1% penicillin–streptomycin and divided between two wells of six-well SmartDish plates. Colonies were imaged and counted after 7 days using STEMvision, then replated at the starting density and counted again after a further week. Drug experiments used 1 µM or 2.5 µM STM9005 or vehicle, with treatment renewed at each plating.
Human methylcellulose complete medium was used to test STM9005 in CD34+ haematopoietic stem and progenitor cells from healthy donors. Mononuclear cells were isolated from cord blood from three healthy donors by density centrifugation, and CD34+ cells were positively selected with the CD34+ MicroBead Kit. One thousand cells were suspended in 110 µl IMDM containing 2% FBS and vehicle, 2.5 µM STM9005 or 5 µM STM9005, then added to 1.1 ml methylcellulose medium in 35 mm dishes. Colonies were counted microscopically after 14–16 days. Samples were obtained with informed consent under REC 24/EE/0116.
Cell-cycle, apoptosis and differentiation assays
For cell-cycle analysis, adherent cells were seeded to reach 70–80% confluence at the analysis time points and retreated on days 3 and 6. On days 5 and 7, 0.5 × 10⁶ cells were analysed with the APC BrdU Flow Kit. BrdU was added for 2 h to suspension cells and 4 h to adherent cells. Flow cytometry used CytoFLEX or CytoFLEX LX, with analysis in FlowJo.
For apoptosis measurements, suspension cells were seeded at 0.1 × 10⁶ cells per well in 2 ml medium and treated with vehicle, 1 µM or 2 µM STM9005. Cells were retreated on days 3 and 6. Adherent cells were seeded to reach 70–80% confluence and treated on the same schedule. Apoptosis was measured on days 3, 5 and 7 by staining 0.1 × 10⁶ cells with APC Annexin V and propidium iodide, followed by flow cytometry.
For differentiation assays, cells were seeded at 0.25 × 10⁶ cells per well and treated with 10, 5, 2.5 or 1 µM STM9005. On days 3 and 6, mouse cells were stained with anti-mouse Ly-6G/Ly-6C (Gr-1)-APC and human cells with anti-human CD11b-APC. Cells were passaged and retreated on day 3 while maintaining the initial density.
RNA, tRNA and protein analyses
RNA extraction and quality control
Total RNA was extracted with TRIzol and purified on RNA Clean & Concentrator-100 columns. RNA quantity was measured with the Qubit RNA Broad Range assay. Integrity was assessed with the Agilent Bioanalyzer RNA 6000 Nano kit or the 4200 TapeStation system. For quantitative PCR, RNA was extracted with the GenElute Mammalian Total RNA Miniprep Kit.
tRNA-Val methylation assay
Cells treated with STM9005 at the concentrations and time points specified in the figure legends were lysed in prewarmed HB42 buffer containing 50 mM Tris-HCl, pH 7.5, 750 mM NaCl, 1 mM EDTA, 1% SDS and 15% formamide. Lysates were heated for 20 min at 95 °C, snap-frozen and stored at −80 °C.
Streptavidin-coated plates were blocked for 1 h at room temperature with 5% BSA and 100 µg ml−1 salmon-sperm DNA in TBS containing 0.05% Tween-20. After washing, plates were coated with a biotinylated capture oligonucleotide, /5Biosg/CGAACGTGATAACCACTACACTACGGAAAC, at 0.25 pmol per well. Thawed lysates were heated to 95 °C for 10 min and cooled slowly to 42 °C. Twenty-five microlitres was added to each well and incubated overnight at 42 °C with agitation.
After washing with buffers containing RNase inhibitors, plates were incubated with anti-m7G antibody at 0.2 µg ml−1 for 2 h. Anti-mouse SULFO-TAG antibody was then added at 1 µg ml−1 for 1 h. Plates were developed with MSD read buffer T and read on a Sector 600 Mesoscale Discovery reader. Dose–response curves were fitted with a four-parameter nonlinear regression model in GraphPad Prism v.10.
For total RNA from cell lines, animal tissues or tumours, 0.5–1 µg RNA was diluted to 20–40 ng µl−1 in HB42, heated to 95 °C for 10 min and cooled to 42 °C before overnight incubation on the MSD plate.
RNA nucleoside quantification
Total RNA from cell lines, animal tissues and tumours was separated by SEC in isocratic 0.1 M ammonium acetate, pH 5.5, at 65 °C and 1,000 µl min−1 for 7.5 min. Separation used an Agilent SEC-5 1000 Å, 4.6 × 300 mm column on a Thermo UltiMate 3000 HPLC system with ultraviolet detection at 260 nm. Nucleosides were prepared and quantified as described previously.27
Western blotting
Depending on the experiment, cells were lysed in RIPA buffer containing protease inhibitors, or in whole-cell lysis buffer containing 0.2% IGEPAL CA-630, 50 mM Tris-HCl, pH 8.0, 450 mM NaCl, 1 mM EDTA, protease and phosphatase inhibitors and 1 mM DTT. Lysates were incubated on ice, cleared at 20,000g and quantified with either the Pierce BCA or Bradford assay. Samples were mixed with NuPAGE LDS buffer and reducing agent, heated at 70 °C for 10 min and snap-frozen.
Between 10 and 20 µg of protein was separated by SDS–PAGE and transferred to PVDF membranes. Antibodies were used against METTL1, GAPDH, CDK1, CDC25A, cyclin B1, p21WAF1/CIP1, CDK4, cyclin A2, H3, β-actin, KDM1A, METTL3, WDR4, MYC and p53, with the corresponding HRP-, Alexa Fluor- or DyLight-conjugated secondary antibodies listed in the source protocols. Uncropped blots are provided in Supplementary Fig. 1.
Sequencing analyses
Reverse-transcription quantitative PCR
cDNA was synthesized from 500 ng RNA in 10 µl reactions using SuperScript IV VILO Master Mix. Specific RNA levels were measured with PowerUp SYBR Green Master Mix on a QuantStudio 5 Real-Time PCR system. Primer sequences are listed in Supplementary Table 15.
mRNA sequencing
Total RNA from OE21 and LoVo cells treated in vitro with vehicle or 1 µM STM9005, and from B16F10 tumours in mice treated twice daily for 5 days with vehicle or 30 mg kg−1 STM9005, was processed by Novogene. Libraries were prepared with poly(A) enrichment and directional sequencing in paired-end 150-base mode on an Illumina NovaSeq X Plus. The minimum output was 11 Gb per sample, corresponding to more than 60 million reads. Three independent samples were processed for each condition.
FASTQ files were processed with the nf-core RNA-seq Nextflow pipeline v.3.9 or v.3.13.2. Reads were aligned to human GRCh38 or mouse GRCm39 reference genomes with STAR, and transcript expression was quantified with Salmon. Differential expression was analysed with DESeq2 after removing genes with fewer than 10 reads. DESeq2 log2 fold-change values were used for gene-set enrichment analysis with clusterProfiler and the hallmark gene sets from MSigDB, using Benjamini–Hochberg correction and a P-value cut-off of 0.05. Analyses were performed in R.
tRNA sequencing
mim-tRNA-seq was adapted from a previous method to measure tRNA abundance and methylation at the G46 position. Five micrograms of total RNA were deacylated with Tris-HCl and SUPERase.In, then dephosphorylated with T4 PNK. RNA was recovered by ethanol precipitation.
Abasic sites at m7G-modified positions were generated by incubating RNA on ice for 40 min with m7GTP, Tris-HCl and sodium borohydride. The reaction was stopped with sodium acetate, water, GlycoBlue and ethanol, and RNA was recovered by precipitation. RNAs between 65 and 90 nucleotides were selected from a 10% TBE–urea gel and converted into sequencing libraries as described previously.59 Libraries were sequenced in single-end 100-base mode on an Illumina NextSeq 2000.
FASTQ files were demultiplexed and trimmed with cutadapt. The mimseq command in the mimseq conda package v.1.3.8 was used with --cluster-id 0.97 --threads 15 --min-cov 0.0005 --max-mismatches 0.075 to count isodecoders and anticodons and determine misincorporation at G46. Changes in tRNA abundance were analysed with DESeq2, with Benjamini–Hochberg adjustment. Changes in misincorporation at m7G46 were calculated for each replicate and tested with a two-tailed t-test.
tRNA northern blotting
Up to 2 µg total RNA from control or inhibitor-treated cells, or 0.5 µl low-molecular-mass marker, was mixed with 2× Novex TBE–urea sample buffer, heated to 80 °C for 10 min and separated on 10% Novex TBE–urea gels. RNA was transferred to positively charged nylon membranes by semi-dry electroblotting at 3.3 mA cm−2 for 1 h and cross-linked with 120,000 µJ cm−2 ultraviolet energy. Membranes were baked at 80 °C for 10 min and stored at −20 °C.
Membranes were hybridized overnight at 55 °C with approximately 30-nucleotide biotinylated probes specific to individual tRNAs. After stringency washes, biotinylated probes were detected with streptavidin–HRP and the Chemiluminescent Nucleic Acid Detection Module Kit. Images were analysed with ImageJ or Image Lab.
Ribosome profiling
Cells were incubated for 2 min at 37 °C in medium containing 100 µg ml−1 cycloheximide, washed with PBS containing 20 µg ml−1 cycloheximide and lysed in buffer containing 20 mM Tris-HCl, pH 7.4, 150 mM NaCl, 5 mM MgCl2, 1 mM DTT, 1% Triton X-100, 0.1% IGEPAL CA-630, 100 µg ml−1 cycloheximide and 25 U ml−1 TURBO DNase. Lysates were triturated through a 26-gauge needle and cleared at 20,000g for 5 min at 4 °C.
Ribosome-protected fragments (RPFs) were generated by treating cleared lysates with RNase I for 45 min at 23 °C and 1,400 rpm. Digestion was stopped with SUPERase.In. Ribosomes were enriched using Illustra MicroSpin S-400 HR columns. RNA was extracted with TRIzol, depleted of rRNA and separated on a 15% TBE–urea gel. Fragments of 27–32 nucleotides were excised, extracted at 70 °C and precipitated. After treatment with T4 PNK, libraries were prepared with the NEBNext Small RNA-seq kit.
mRNA and RPF libraries were sequenced on an Illumina NovaSeq X Plus in paired-end 150-base mode, to more than 40 million and 100 million reads, respectively. Reads were trimmed with cutadapt, and rRNA, tRNA, snoRNA and snRNA reads were removed with SortMeRNA. Remaining reads were aligned to the MANE Select transcript set using STAR. riboWaltz was used to identify the codon at the ribosome A site.
RUST ratios, representing observed versus expected RPF density, were calculated for each A-site codon after excluding the first 40 and last 20 codons and transcripts shorter than 80 codons. Codons were classified according to whether their cognate tRNAs carried m7G. Individual codons were tested with a one-sample, one-tailed t-test, and grouped m7G and non-m7G codons with a two-sample, two-tailed t-test.
mRNA reads were quantified with Salmon. Integrated differential-expression analysis of RNA-seq and Ribo-seq counts classified genes as forwarded, intensified, exclusive or buffered according to changes in transcription and translational efficiency, using an adjusted P-value threshold of 0.2.
Comparison analysis
Pairwise overlap between differentially expressed gene sets, defined as absolute log2 fold change greater than 1 and adjusted P < 0.05, was measured with Jaccard similarity. Significance was assessed with a one-tailed hypergeometric test against a background of 20,000 protein-coding genes. P values were adjusted with the Benjamini–Hochberg false-discovery-rate method; all reported overlaps remained significant after correction, with FDR < 0.001.
Histology and animal studies
Histology
Tissues were fixed in 10% formalin, dehydrated and embedded in paraffin. Sections 5–7 μm thick were cut with a Leica RM2255 microtome and mounted on Superfrost Plus slides. Formalin-fixed, paraffin-embedded sections were stained with haematoxylin and eosin. Images were acquired with a Zeiss ApoTome 2.0 using Zen Blue software. Biopsies from both groups were reviewed by two clinicians experienced in mouse histology who were blinded to group assignment. No gross histological differences were observed between groups.
Pharmacokinetics
For all animal experiments, STM9005 was prepared in 20% (2-hydroxypropyl)-β-cyclodextrin in water. For pharmacokinetic analysis, male C57BL/6J mice received intraperitoneal injections of 10 or 30 mg kg−1 STM9005, with three mice per dose, and were sampled serially for up to 12 h. For oral dosing, a 10 mg ml−1 stock was administered by gavage at 30 mg kg−1.
Blood was collected from the tail vein into K2-EDTA tubes. Plasma was isolated by centrifugation, and 5 µl was mixed with 200 µl acetonitrile containing internal standard. Three-microlitre injections were analysed by LC–MS/MS on an AB Sciex Triple Quad 6500+ instrument coupled to a Waters ACQUITY UPLC I-Class PLUS system.
STM9005 was separated on an ACQUITY UPLC HSS T3 column using a 15–95% gradient of mobile phase B over 78 s at 0.6 ml min−1. Mobile phase A contained 0.1% formic acid and 2 mM ammonium formate in water; mobile phase B contained the same additives in 95:5 acetonitrile–water. Retention time was 0.86 min, and the mass transition was 462.1/219.1 Da. The calibration range was 2.00–3,000 ng ml−1, with a lower limit of quantification of 2 ng ml−1.
Mouse tumour models
For subsequent experiments, animals were treated twice daily by intraperitoneal injection with 30 mg kg−1 STM9005 or vehicle. For B16F10 experiments, 0.5 × 10⁶ cells were transplanted subcutaneously into female C57BL/6J mice. For mPDAC1 and A549 models, 1 × 10⁶ or 2 × 10⁶ cells, respectively, were transplanted into male NSG-SGM3 mice. Cells were suspended in a 1:1 mixture of Matrigel and PBS.
Treatment began when tumours became palpable, as measured with digital callipers. Treatment lasted 5 days for B16F10 tumours and 9 days for A549 and mPDAC tumours. Tumours were monitored regularly, and animals were collected when vehicle-treated tumours reached the humane endpoint specified in the study plan. Tumour and kidney tissues were collected for analysis.
For a disseminated leukaemia model, male NSG-SGM3 mice received 0.5 × 10⁶ MLL-AF9/Flt3ITD/+ cells intravenously. Daily treatment began 12 days after transplantation and continued for 5 days. Disease progression was monitored by weekly tail-vein bleeds. Twenty microlitres of blood was collected into EDTA-containing capillary tubes, and complete blood counts were obtained with a Vet abc Plus analyser. C57BL/6J mice were treated in parallel for 5 days and monitored for toxicity and weight changes.
For the patient-derived AML model, female NSG-SGM3 mice were transplanted intravenously with the AML-491 PDX. Daily vehicle or STM9005 treatment began 22 days after transplantation and continued for 10 days. Disease progression was followed by weekly bleeds, and mice were collected at humane endpoints. In one experiment, a subset was collected on day 43 after transplantation; bone marrow was stained with anti-human CD45-FITC and engraftment was measured by flow cytometry.
Bone marrow from four wild-type C57BL/6J mice was used for colony serial-plating experiments. In separate experiments, C57BL/6J mice were treated twice daily for 12 days with vehicle or 30 mg ml−1 STM9005, and tissues were collected 30 days after treatment. Bone marrow and spleen were analysed by flow cytometry, bone marrow was tested for colony-forming capacity, and heart, liver, kidney and spleen were examined histologically.
In-vivo absorption, distribution, metabolism and excretion studies were performed by WuXi AppTec in accordance with institutional animal-care and use procedures, the US Animal Welfare Act and the Guide for the Care and Use of Laboratory Animals. Experiments associated with Fig. 4, Extended Data Fig. 7 and Extended Data Fig. 8 were conducted under United Kingdom Home Office project licences PP3797858, PP9816216, PP3042348 and PP7037913, in accordance with the Animal Scientific Procedures Act 1986.
Flow cytometry and quantitative analysis
For blood-cell and progenitor analyses, cells were stained with antibody panels against CD4, CD8a, B220, Gr-1, CD11b, lineage markers, Sca-1, KIT, CD48, CD150, CD135, CD34 and CD16/32, together with viability dyes. B cells were defined as B220-PE-Cy5+B220-AF700+; T cells as CD4-PE-Cy5+CD8-PE-Cy5+AF700−; and myeloid cells as CD11b-AF700+Gr1-AF700+PE-Cy5−.
Lineage-negative, KIT-positive and Sca-1-negative cells were classified as LK cells, whereas lineage-negative, KIT-positive and Sca-1-positive cells were classified as LSK cells. Within LK cells, megakaryocyte–erythroid progenitors, common myeloid progenitors and granulocyte–monocyte progenitors were defined by CD34 and CD16/32. Within LSK cells, short-term and long-term haematopoietic stem cells and multipotent progenitors were defined using CD150 and CD48. HSC, MPP and LMPP populations were distinguished by CD135. Acquisition used an LSRFortessa with BD FACSDiva software, and data were analysed with FlowJo. Gating strategies are provided in Supplementary Fig. 2.
No statistical method was used to predetermine sample sizes. Experiments were not randomized, and investigators were not blinded during allocation or outcome assessment. Statistical tests and sample sizes are reported in the relevant figure legends. Further information on research design is available in the Nature Portfolio Reporting Summary linked to the study.
Source: www.nature.com