


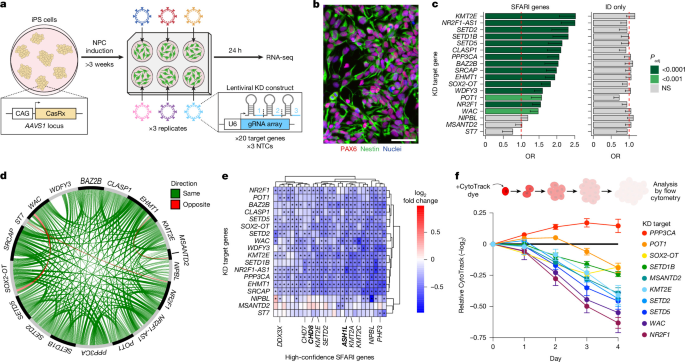
The study used CasRx, a programmable RNA-targeting CRISPR system, to reduce expression of selected transcripts in human induced pluripotent stem cell (iPSC)-derived neural progenitor cells (NPCs) and cerebral organoids. The researchers combined multiplexed guide-RNA arrays, piggyBac-integrated expression constructs, bulk and single-cell RNA sequencing, protein and fluorescence assays, and gene-regulatory-network analyses to examine how perturbing autism-associated and intellectual-disability genes affected neural development. The methods also included comparisons with shRNA knockdown, published knockout and chromatin-immunoprecipitation datasets, and single-nucleus RNA-sequencing data from autistic male individuals.
CasRx guide design and molecular cloning
CasRx17, specifically NLS-RfxCas13d-NLS (Addgene, 109049), was combined with gene-specific guide RNAs (gRNAs) to reduce the abundance of targeted transcripts. A deep-learning tool66 was used to design spacer sequences. Spacers containing homopolymers—more than four consecutive As or more than three consecutive Cs, Gs or Ts—were excluded. Potential off-target interactions were assessed with BLAST67, and spacers with such interactions were removed.
Three spacer sequences were selected for each target gene and assembled into a tandem pre-gRNA array. Each spacer was preceded by the CasRx direct-repeat sequence (DR36): CAAGTAAACCCCTACCAACTGGTCGGGGTTTGAAAC. CasRx processed the tandem arrays into individual gRNAs for knockdown (KD). Complete sequences are provided in Supplementary Table 1.
Expression constructs
Initial NPC KD constructs used the lentiviral pSicoR plasmid (Addgene, 11579) as the backbone. The mouse U6 promoter was replaced with the human U6 promoter to drive the CasRx gRNA arrays. These constructs were used with a CasRx knock-in cell line.
For validation by auto-western blot, an all-in-one construct was generated in which CasRx and EGFP were expressed from the CAG promoter and gRNA arrays were expressed from the human U6 promoter. The construct also contained inverted terminal repeats for genomic integration by piggyBac transposase69. It was based on the LiOn design70 (Addgene, 154019), in which CasRx and EGFP expression depended on piggyBac-mediated recombination, preventing expression from the episomal plasmid. The same all-in-one design was used for fluorophore KD and NPC proliferation assays.
For fluorophore expression in NPCs, iOn-based constructs were made with mKO2, mScarlet or iRFP670 under the CAG promoter.
For shRNA-mediated KD, shRNAs were designed with the Horizon siDesign Center. Predicted shRNAs beginning with G were selected, and candidates with potential BLAST67-identified off-target interactions were excluded. The selected shRNAs, listed in Supplementary Table 13, were cloned into pSicoR (Addgene, 11579).
FLICK constructs
For organoid experiments, the researchers engineered the FLICK construct using a backbone incorporating the FLEx design71. The construct contained a modified Cre recombinase with an intron that prevented plasmid recombination during cloning72, CasRx17, and all components required for doxycycline-inducible Tet-On 3G recombination73. Short identifying barcode sequences were placed upstream of the polyadenylation sites for the fluorescent reporters, allowing the integrated KD construct in each cell to be identified by single-cell RNA sequencing (scRNA-seq). Inverted terminal repeats enabled genomic integration by piggyBac transposase69. All construct sequences were verified by whole-plasmid sequencing by Plasmidsaurus.
Cell culture and cerebral organoids
All human cell culture work was conducted under protocols approved by the Boston Children’s Hospital institutional review board (IRB S07-02-0087). The control male human iPSC line 280 had been generated and fully characterized previously74. Human iPSCs and iPSC-derived NPCs were grown on plates coated with Matrigel (Corning, 354277) or Geltrex (Thermo Fisher, A1413302). Cells were passaged with Accutase (Millipore Sigma, SCR005) or ReleSR (STEMCELL Technologies, 100-0483).
Human iPSCs were maintained in mTeSR Plus medium (STEMCELL Technologies, 100-0276). NPCs75 were generated with the STEMdiff SMADi Neural Induction Kit (STEMCELL Technologies, 08582), using the monolayer protocol for at least 3 weeks. NPCs were continuously maintained in neural induction medium plus SMADi rather than being transferred to neural progenitor medium. Following iPSC or NPC passaging, the medium was supplemented with 10 μM Y-27632 (STEMCELL Technologies, 72304) for approximately 1 day.
Cerebral organoids were generated from 280 iPSCs with the STEMdiff Cerebral Organoid Kit (STEMCELL Technologies, 08570), incorporating recommendations from Giandomenico et al.76 and additional modifications. Organoids were embedded in Matrigel on day 7, grown in expansion medium until day 14, then removed from Matrigel and transferred to maturation medium on an orbital shaker. The complete protocol is available at protocols.io.
None of the cell lines was authenticated. All cell lines routinely tested negative for mycoplasma contamination.
CasRx knock-in cells and lentivirus
CasRx17 was inserted into the AAVS1 safe-harbour locus of 280 iPSCs using targeting constructs described previously73. Individual colonies were picked and expanded. Celplor performed Southern blotting to confirm correct targeting of AAVS1.
KaryoStat analysis (Thermo Fisher) identified a 2.4-Mb gain on chromosome 1, reported in microarray notation as arr[GRCh37] 1q32.1(204108163_206539638)x3. The gained region did not contain any of the target genes.
Lentiviruses were produced using previously described standard protocols77. Cells were infected at a multiplicity of infection of 4.0, which yielded more than 98% transduced cells. RNA was extracted 24 h later.
Nucleofection and knockdown assays
Nucleofection was performed with a Neon Transfection System (Thermo Fisher Scientific). For NPCs, 2 million cells received 10 μg of transposable plasmid and 2 μg of a piggyBac-transposase plasmid69 in 100-μl tips. For iPSCs, 1 million cells received 5 μg of transposable plasmid and 1 μg of piggyBac-transposase plasmid in 100-μl tips. In small-scale experiments, 10-μl tips were used and cell and plasmid quantities were reduced proportionally.
NPC nucleofection used 1,600 V, a 10-ms pulse width and three pulses. iPSC nucleofection used 950 V, a 30-ms pulse width and two pulses.
Protein and fluorophore assays
For auto-western blotting, LiOn-based KD constructs were introduced into 280 NPCs with piggyBac transposase. After 4 days, EGFP-positive cells were collected by fluorescence-activated cell sorting (FACS) with a BD FACSymphony S6, pelleted and flash-frozen in liquid nitrogen. RayBiotech performed protein extraction and auto-western blotting using antibodies against vinculin (R&D Systems, MAB6896, clone 728526; 1:25) and WAC (Abcam, AB109486; 1:50).
For fluorophore KD, mKO2-, mScarlet- and iRFP670-expressing constructs were nucleofected into 280 iPSCs with piggyBac transposase. Cells expressing all three fluorophores were isolated with a Cytek Aurora CS spectral cell sorter, expanded and differentiated into NPCs. LiOn-based CasRx KD constructs were then introduced into the NPCs. After 4 days, cells expressing all four fluorophores, with EGFP marking KD-construct expression, were sorted and analysed. Differences in geometric mean fluorescence intensity on a log2 scale were tested with ordinary two-way ANOVA and Bonferroni’s multiple-comparisons test.
shRNA knockdown
For each target, three pSicoR-based shRNAs were pooled and nucleofected into 280 NPCs. Because these constructs were not transposable, piggyBac transposase was omitted and the total pSicoR plasmid quantity was increased to 15 μg. The next day, EGFP-positive cells were isolated by FACS with a BD FACSymphony S6 and replated overnight. RNA was collected the following day with Zymo DNA/RNA Shield, and 3′ RNA-seq was performed by Plasmidsaurus using its DGE RNA-Seq service.
NPC proliferation
LiOn-based KD constructs were nucleofected into 280 NPCs with piggyBac transposase. Four days later, cells were labelled for 20 min with dye from the CYTOTRACK Red 628/643 Cell Proliferation Assay Kit (Bio-Rad, 1351205), diluted 1:500. Cells were rinsed with PBS (Thermo Fisher Scientific, 10010031), passaged and distributed into four plates, with one-fifth of each sample placed in a well for each later time point. The remaining cells were analysed by flow cytometry to establish the initial day-0 CytoTrack intensity.
One well per sample was dissociated and analysed on each of the next 4 days. Negative log2 CytoTrack intensity from EGFP-positive cells was normalized to EGFP-negative cells in the same well, then normalized to the day-0 intensity. Each KD was displayed relative to the mean of the NTC samples as mean ± s.e.m. Statistical testing used ordinary two-way ANOVA with Dunnett’s multiple-comparisons test in GraphPad Prism. Sample numbers and statistical results are provided in Supplementary Table 10.
Bulk RNA sequencing
Bulk RNA was extracted with the Direct-zol RNA Microprep Kit (Zymo Research, R2062). 3′ RNA-seq libraries were prepared using a modified TagSeq protocol78 incorporating recommendations and pooling strategies from CheapSeq79.
For each sample, 200 ng total RNA was combined with an indexed oligo(dT) primer and buffer (NEB, M0466L). RNA was fragmented at 94 °C for 2.5 min in a preheated thermocycler without the lid and immediately transferred to ice. A template-switching oligo containing an index and unique molecular identifier (UMI), together with reverse-transcription reagents, was then added. Reverse transcription was performed at 42 °C for 90 min without heat inactivation.
Remaining single-stranded RNA and oligos were digested with 0.5 μl buffer EB (Qiagen, 19086), 0.5 μl thermolabile ExoI (NEB, M0568S) and 0.25 μl RNase A (Thermo Fisher, EN0531) at 37 °C for 30 min. Samples were heat-inactivated at 85 °C for 5 min and held at 4 °C.
Up to eight differently indexed samples were pooled. cDNA was purified using a 1.4× left-sided solid-phase reversible immobilization (SPRI) selection (Beckman Coulter, B23317) and amplified for 7 cycles with Q5 UltraII Mastermix (NEB, M0544L), partial read 1 and read 2 primers, and a C1000 Touch Thermal Cycler (Bio-Rad, 1851197). A 0.7× left-sided SPRI selection followed. Final libraries were generated with Q5 UltraII Mastermix and standard TruSeq indexing primers (NEB, E6440S), using 8 amplification cycles. Libraries were purified with a 0.4×–0.65× double-sided SPRI selection and assessed with a TapeStation HSD1000 (Agilent, 5067-5584 and 5067-5585). Oligo sequences are listed in Supplementary Table 14.
The CheapSeq PCR program was 98 °C for 30 s; X cycles, as specified above, of 98 °C for 10 s and 65 °C for 75 s; 65 °C for 5 min; and a 4 °C hold.
Bulk RNA-seq analysis
CasRx KD in NPCs
Three independent NPC samples were analysed per condition. Each KD condition was compared with three NTC conditions, treated together as a set of nine control samples. Gene expression was quantified with alevin-fry using UMI deduplication in salmon v1.9. A salmon index and transcript-to-gene map were generated from GENCODE v45, and counts from transcripts mapping to the same gene were summed.
Only genes with a baseMean expression greater than 10 in NTC samples were analysed further. Differential expression was tested with DESeq2 v1.42.0 using the model ~Batch + sgRNA. For KD confirmation, Benjamini–Hochberg correction was applied across the 20 directly targeted genes. SRCAP was excluded from the RNA-seq analysis because of low expression; its raw P value came from droplet digital PCR (ddPCR). For transcriptome-wide analyses, correction was applied across 11,168 genes with baseMean greater than 10 in NTCs.
SRCAP ddPCR validation
The RNA samples used for RNA-seq were converted to cDNA with SuperScript IV VILO Master Mix (Thermo Fisher Scientific, 11756050). ddPCR reactions contained cDNA equivalent to 0.25 ng μl−1 RNA, or 5 ng per 20-μl reaction, primers at 0.1 μM and QX200 ddPCR EvaGreen Supermix (Bio-Rad, 1864033). Reactions were run on a QX200 AutoDG Droplet Digital PCR System. Expression was normalized to HPRT1. The model was Expr ~ Batch + type, where type was NTC or SRCAP-targeting. The raw P value was adjusted with the other KD targets using Benjamini–Hochberg correction across the 20 directly targeted genes.
Primer design
Primers in Supplementary Table 15 were designed with Primer-BLAST80, which assesses potential off-target interactions using BLAST67. Oligos were ordered from Azenta or IDT. Primer specificity was confirmed by Sanger sequencing of PCR products by Azenta.
shRNA and published-data analyses
shRNA RNA-seq data were analysed with the same general pipeline. DESeq2 v1.42.0 used the model ~targetGene to compare each target with NTC shRNAs directed against non-expressed luciferase and lacZ transcripts. Transcriptome-wide correction was applied across 14,601 genes with baseMean greater than 10 in NTC cells. DEGs were defined as genes with adjusted P < 0.05.
For data from reference 20, gene-expression counts were downloaded from GEO accession GSE107878. The same DESeq2 pipeline was used, with the model expression ~ targeted gene, to identify DEGs relative to controls in neurons and iPSCs. Only genes with mean control expression greater than 10 were considered, and DEGs were defined by adjusted P < 0.05.
DEG overlap was assessed among four datasets: CasRx KD in NPCs, shRNA KD in NPCs, knockout iPSCs from reference 20 and knockout excitatory neurons (ExNs) from reference 20. Pairwise enrichment used one-sided Fisher’s exact tests with a gene universe expressed in both sample types, followed by Benjamini–Hochberg correction.
Gene sets and enrichment analysis
The analyses used three gene sets:
- SFARI genes, defined as all genes in the SFARI gene database in its 3 April 2025 release14.
- HC-SFARI genes, defined as SFARI genes with a score of 1.
- Intellectual-disability genes, defined from the SysNDD database81 accessed on 23 August 2025. These genes had to be associated with at least one of the terms HP:0001249, HP:0001256, HP:0002342, HP:0010864 or HP:0002187; belong to the “definitive” category; and not be SFARI genes.
Enrichment was tested with one-sided Fisher’s exact tests in base R v4.3.1. P values were adjusted by the Benjamini–Hochberg method. Bar plots show the odds ratio from the one-sided Fisher’s exact test; error bars show the lower bound of the 95% confidence interval, because no upper bound is defined for a one-sided test.
Co-expression with SFARI genes
For each gene of interest, the median Pearson correlation between its expression and the expression of each SFARI gene was calculated in NPC RNA-seq data. An empirical null distribution was generated from 1,000 randomly selected gene sets of the same size as the SFARI set, using NPC-expressed genes with baseMean greater than 10 in NTCs. A one-sided empirical P value was calculated as the proportion of null values greater than or equal to the observed median correlation. Regulators with P < 0.05 were considered significantly correlated with SFARI genes.
Consistently downregulated genes and constraint
Consistently downregulated DEGs were defined as genes significantly downregulated by at least three KDs and showing at least 80% concordance in the direction of significant differential expression across all KDs.
LOEUF scores, or oe_lof_upper, were obtained from gnomAD v282. A per-gene score was calculated as the median LOEUF value across a gene’s associated transcripts. Although LOEUF is continuous, LOEUF < 0.35 was used, as recommended, to identify highly constrained genes.
Candidate autism-spectrum-disorder risk genes in Supplementary Table 8 that were identified in major sequencing studies are listed in Supplementary Table 9, including references 2, 52 and 83–86. References 87–90 provided additional support for some candidates.
FLICK induction and validation
Cells or organoids were treated with 2 μg ml−1 doxycycline (Sigma, D9891-1G) for 24 h to induce Cre expression and recombination of the FLICK construct.
To assess FLICK KD efficiency, three independent samples were analysed per condition. Control 280 iPSCs were nucleofected with either an NTC1 gRNA array or an array targeting ENSG00000261840, together with piggyBac transposase. After 24 h of doxycycline treatment, recombined EGFP-positive cells were isolated by FACS, replated in triplicate and grown for 2 additional days.
RNA was extracted with the Direct-zol RNA Microprep Kit. Five hundred nanograms of RNA were reverse-transcribed with SuperScript IV VILO Master Mix. qPCR reactions contained cDNA equivalent to 1 ng μl−1 RNA, or 10 ng per 10-μl reaction, primers at 0.5 μM and PowerUp SYBR Green Master Mix (Thermo Fisher Scientific, A25742). Reactions were run in technical triplicate on a CFX384 Touch Real-Time PCR Detection System (Bio-Rad, 1855484), using the fast-cycling conditions in the master-mix protocol. ENSG00000261840 expression was measured with the ΔΔCt method, normalized first to HPRT1 and then to the mean of NTC controls. Results are reported as mean ± s.e.m.; significance was tested with a two-tailed t-test in GraphPad Prism.
Organoid processing and imaging
Cerebral organoids were fixed overnight at 4 °C in 4% paraformaldehyde diluted in PBS from a 16% stock (Electron Microscopy Sciences, 15710). They were rinsed with PBS and equilibrated in 30% sucrose in PBS for at least one night at 4 °C. For large organoids, the sucrose solution was replaced at least once to ensure complete cryoprotection.
Organoids were embedded in Tissue-Tek O.C.T. Compound (Sakura, 4583), frozen on dry ice and sectioned at 30 μm with a Leica CM3050 S cryostat. Sections were collected on Fisherbrand Superfrost Plus slides (Fisher Scientific, 12-550-15) and stored at −80 °C.
For immunohistochemistry, the blocking buffer contained 0.3 M glycine (Sigma, G7403-1KG), 1% bovine serum albumin (Sigma, A4503-50G), 0.3% Triton X-100 (Sigma, T8787-50ML), 10% normal goat serum (Fisher Scientific, NC9660079) and PBS. Sections were blocked for 1 h at room temperature, incubated overnight at 4 °C with primary antibodies in blocking buffer, rinsed three times in PBS for 5 min each and incubated for 30 min at room temperature with secondary antibodies and DAPI. Secondary antibodies were diluted 1:500 and DAPI 1:1,000. Slides were mounted with Fluoromount-G (Fisher Scientific, OB100-01), dried overnight and stored at 4 °C.
The primary antibodies were PAX6 (BD Pharmingen, 561462, clone O18-1330; 1:300), Nestin (Millipore Sigma, HPA026111-25UL; 1:500), TBR2 (Millipore Sigma, HPA028896-100UL; 1:300), CTIP2 (Abcam, ab18465, clone 25B6; 1:300) and EGFP (Aves, GFP-1010; 1:1,000). Secondary antibodies were goat anti-chicken IgY Alexa Fluor 488 (Thermo Fisher, A-11039), goat anti-rabbit IgG Alexa Fluor 488 (A-11008), goat anti-rat IgG Alexa Fluor 488 (A-11006), goat anti-mouse IgG Alexa Fluor 555 (A-21424), goat anti-rat IgG Alexa Fluor 647 (A-21247), goat anti-rabbit IgG Alexa Fluor 647 (A-21245) and goat anti-rabbit IgG Alexa Fluor 750 (A-21039), all diluted 1:500.
Sections were imaged on a Zeiss LSM 980 confocal microscope. Standard image processing was performed with Adobe Photoshop.
Organoid single-cell RNA sequencing
Cells were collected from 1-month organoids, 2-month organoids and acute-KD organoids. The 1-month sample consisted of 10 organoids pooled into one batch. The 2-month samples comprised 14 organoids collected in two batches: seven on day 60 and seven on day 61. The acute-KD sample consisted of eight organoids pooled into one batch.
Mosaic organoids were cut with spring scissors, rinsed twice in PBS and dissociated with the Neural Tissue Dissociation Kit—Postnatal Neurons (Miltenyi Biotec, 130-094-802), using the enzyme mixes specified for brain tissue. Dissociation was performed gently with pipette tips of decreasing diameter, beginning with wide-orifice tips (Rainin, 30389218) and progressing to standard tips. EGFP-positive cells containing recombined FLICK constructs were isolated by FACS with a BD FACSymphony S6. Transcriptome-wide libraries were made with Chromium Next GEM Single Cell 3′ Reagent Kits v3.1, Dual Index, from 10x Genomics, following user guide CG000316 Rev. A.
FLICK barcode libraries
Full protocols are available at protocols.io. To quantify FLICK constructs in the starting iPSC population used to generate mosaic organoids, RNA was extracted from triplicate samples of 42,000 cells with the Direct-zol RNA Microprep Kit. For cDNA synthesis, 50–250 ng RNA was reverse-transcribed with the SuperScript IV First-Strand Synthesis System (Invitrogen, 18091050) and an oligo(dT)VN primer containing UMIs. Libraries were generated with Q5 Hot Start High-Fidelity 2X Master Mix (NEB, M0494L) and custom primers.
To generate barcode libraries from scRNA-seq libraries, 5 μl of amplified and cleaned cDNA produced through step 2 of the 10x user guide CG000316 Rev. A were used. Barcode-containing cDNA was amplified with Q5 Hot Start High-Fidelity 2X Master Mix and custom primers, cleaned with SPRIselect DNA Size Selection Reagent (Beckman Coulter, B23317) and assessed with TapeStation High Sensitivity D1000 reagents (Agilent, 5067-5603 and 5067-5584).
Alignment and quality control
scRNA-seq reads were aligned to the prebuilt Cell Ranger v9.0.0 hg38 reference with cellranger-count in feature-barcode mode, enabling simultaneous gene-expression and guide-abundance quantification. Introns were excluded (--include-introns=false) to avoid counting partially degraded transcripts targeted by CRISPR–CasRx.
For 2-month samples, CRISPR guide FASTQs were downsampled to 1.25% of reads with seqtk v1.4 to match the sequencing depth of the 1-month CRISPR libraries and reduce background during guide assignment. Other settings were left at default. Cell Ranger assignments were used to retain only cells with exactly one assigned guide.
Long-term and acute-KD samples were processed separately but identically. CellBender v0.3.2 was used to detect and filter ambient RNA contamination, and scrublet v0.2.3 was used for automatic doublet detection and filtering. Subsequent analyses used Seurat v5.0.0. Cells were retained if mitochondrial gene expression was below 20% and if they expressed more than 500 but fewer than 6,000 genes.
Cell-type annotation
Annotation began with NTC cells alone. A control-only Seurat object was normalized with NormalizeData, variable features were identified with FindVariableFeatures, and data were scaled with ScaleData while regressing percent mitochondrial expression, percent ribosomal expression, nCount_RNA and nFeature_RNA. PCA and UMAP were performed with RunPCA and RunUMAP.
Batches were integrated with harmony v1.2.0. Unsupervised clustering used FindNeighbors and FindClusters at resolutions 0.6 and 1.2. Clusters containing fewer than 1,000 cells were removed when they had poor cluster-wide quality metrics, including exceptionally high or low nCount_RNA or high mitochondrial expression. Cell types were assigned using canonical brain marker genes.
A Seurat object containing all cells was then processed with the same normalization, scaling, dimensionality-reduction and integration workflow. Labels were transferred from the control-only object with TransferData and refined using canonical brain-marker expression.
Organoid abundance and differential-expression analyses
The relative abundance of each KD population was measured at day 0, day 30, day 60 and day 61. Day-0 abundance was calculated from bulk RNA-seq libraries using a custom pipeline. Abundance at days 30, 60 and 61 was calculated from scRNA-seq guide assignments generated by Cell Ranger. Each measurement was normalized to the starting day-0 proportion and displayed relative to NTCs from the same time point. Results were plotted as mean ± s.e.m. Repeated-measures one-way ANOVA with Dunnett’s multiple-comparisons test was performed in GraphPad Prism across all long-term samples.
The relative proportion of excitatory neurons (ExNs) and radial glia (RG) was calculated for each KD at days 30, 60 and 61 and normalized to the NTC sample from the same time point. Ordinary one-way ANOVA with Dunnett’s multiple-comparisons test was used across all long-term samples.
Differential expression was assessed between perturbed cells carrying each guide and NTC cells, separately within radial glia, intermediate progenitor cells, ExNs and inhibitory neurons. Seurat FindMarkers was used with logfc.threshold=0, min.pct=0.10 and min.cells.group=3; other parameters were left at default. DEG enrichment was tested with one-sided Fisher’s exact tests and Benjamini–Hochberg correction. The gene universe consisted of genes expressed in both comparisons.
Shared DEGs between organoid cell types were visualized with igraph v2.1.4 using the Fruchterman–Reingold layout algorithm, layout_with_fr.
Regulatory-network analyses
MAGIC
MAGIC v1.191 was used to identify transcription factors and cofactors whose targets were enriched among DEGs from individual perturbations. Target regions were defined as the gene body, from promoter through the end of the final exon, plus 1 kb of flanking sequence on either side. For NPC analyses, the universe was all genes with baseMean greater than 10 in NTCs. For organoid analyses, it was all genes expressed in at least 10% of cells in the relevant cell type, matching the min.pct=0.10 threshold used for differential expression.
REST and CHD8 datasets
REST ChIP-seq data were taken from Table S2 of reference 92. Mouse genes were mapped to human genes using Orthology.eg.db v3.20.0, org.Mm.eg.db v3.20.0 and org.Hs.eg.db v3.20.0. Enrichment was tested with one-sided Fisher’s exact tests, using BrainSpan genes with normalized expression of at least 1 as the universe. The BrainSpan dataset was “RNA-Seq Gencode v10 summarized to genes,” accessed on 6 January 2024 at brainspan.org. Benjamini–Hochberg correction was applied.
CHD8-target enrichment used Supplementary Data 1 from reference 45. The universe was NPC-expressed genes with baseMean greater than 10 in NTCs. One-sided Fisher’s exact tests and Benjamini–Hochberg correction were used; plots show odds ratios and the lower bound of the 95% confidence interval.
ARACNe and VIPER
A gene-regulatory network (GRN) was constructed with ARACNe-AP93 from RNA-seq data for three NTC samples and successful KD samples containing at least 50 DEGs. Candidate regulators were genes expressed in NPCs, defined as baseMean greater than 10 in NTCs, and included curated transcription-factor94 and epigenetic-regulator95 lists. Default parameters and 100 bootstraps were used, and the bootstraps were aggregated into the final network.
VIPER v1.36.096 was used to identify differentially active regulons. Regulon differences between NTCs and KD samples were tested with a t-test, using sample permutations to define the null distribution.
To benchmark prediction, additional ARACNe networks were generated while holding out perturbation samples for five target genes. Each gene regulated at least 250 genes in its second-degree regulon, with ranges of 478–1,219 genes. Predicted positively regulated genes in each held-out second-degree regulon were compared with downregulated DEGs from perturbation of the same regulator using one-sided Fisher’s exact tests. P values were adjusted with the Benjamini–Hochberg method and combined across the five perturbations using Fisher’s method.
PageRank and candidate regulators
The GRN was converted into a graph with igraph v2.1.4, and PageRank scores were calculated with page_rank. Genes were ordered by PageRank and analysed by gene-set enrichment analysis using fgsea v1.32.4. Tested gene sets included SFARI genes, HC-SFARI genes, intellectual-disability genes excluding SFARI genes, and the 50 Molecular Signature Database Hallmark Pathways99 obtained from MSigDB.
VIPER was used to identify regulators whose regulons were significantly differentially active across KDs relative to NTCs. The researchers prioritized 70 regulators whose regulons were significantly enriched for SFARI genes by one-sided Fisher’s exact test with Benjamini–Hochberg correction and also had high PageRank scores by gene-set enrichment analysis with the same correction.
Mean normalized degree for regulator sets and their first-degree regulons was calculated with igraph using mean(degree(graph, normalized=TRUE)). An empirical null distribution was generated from 1 million subnetworks containing randomly selected GRN regulators of the same size. Relative mean normalized degree was the observed value divided by the mean of the corresponding null distribution. One-sided empirical P values were calculated as the fraction of null values at least as large as the observed value, with a detection limit of P = 1 × 10⁻⁶.
Known or predicted protein–protein interactions among the 70 regulators were evaluated with the STRING database graphical interface. The universe was the complete set of candidate regulators: transcription factors94 and epigenetic regulators95 expressed in NPCs at baseMean greater than 10 in NTCs. Other parameters were left at default. Regulator modules were identified by iterative walktrap clustering with igraph v2.1.4 and cluster_walktrap.
Sex-biased expression and autism datasets
Female-biased genes in the neurotypical brain were identified by combining DEG sets from Table S4 of reference 101, genes significantly female-biased in either the UCLA cohort, BrainVar cohort or meta-analysis; reference 102, using the GTEx v8 file GTEx_Analysis_v8_sbgenes.tar.gz for BRNCTXA or BRNCTXB; Table S4 of reference 103, genes female-biased in all assessed human, mouse, rat, dog and macaque brains; and Table S13 of reference 60, genes identified as ubiquitously female-biased.
Processed single-nucleus RNA-seq data from human frontal cortex were obtained from reference 64. Sample sex was verified from XIST and Y-linked gene expression. Because autism has a known male bias, the cohort included only a small number of female samples: one female control, one female participant with idiopathic autism and one female participant with 15q-duplication-associated autism. Downstream analyses therefore focused on 17 male samples.
Cell-type-specific differential expression was tested with Seurat FindMarkers for three comparisons: male controls versus male participants with idiopathic autism; male controls versus male participants with 15q-duplication-associated autism; and male controls versus all male participants with either form of autism. Donor effects were controlled using MAST104. Significant genes had an absolute log2 fold change greater than 0.1 and transcriptome-wide adjusted P < 0.05. Data used to plot sex-differential expression of ZFX came from references 60, 101 and 105–106.
ZFX ChIP-seq targets were obtained from Table S3E of reference 65 and Table S10 of reference 53, the latter representing an integrative analysis of ENCODE ZFX ChIP-seq data and ZFX KD RNA-seq data from reference 65. Enrichment was tested with one-sided Fisher’s exact tests and Benjamini–Hochberg correction. For common ZFX targets from reference 65, the universe was genes expressed in both ChIP-seq cell lines for which RNA-seq data were available, C4-2B and MCF-7. For targets from reference 53, the universe was genes expressed in the corresponding cell type from reference 65.
Software and reporting
The analysis used R v4.3.1 and the R packages DESeq2 v1.42.0, Seurat v5.0.0, igraph v2.1.4, scrublet v0.2.3, harmony v1.2.0, Orthology.eg.db v3.20.0, org.Mm.eg.db v3.20.0, org.Hs.eg.db v3.20.0, VIPER v1.36.0 and fgsea v1.32.4. Other software included Cell Ranger v9.0.0, CellBender v0.3.2, MAGIC v1.1, salmon v1.9, seqtk v1.4 and BD FACSDiva v8.0.3.
Additional information on the research design is available in the Nature Portfolio Reporting Summary linked to the article.
Source: www.nature.com