


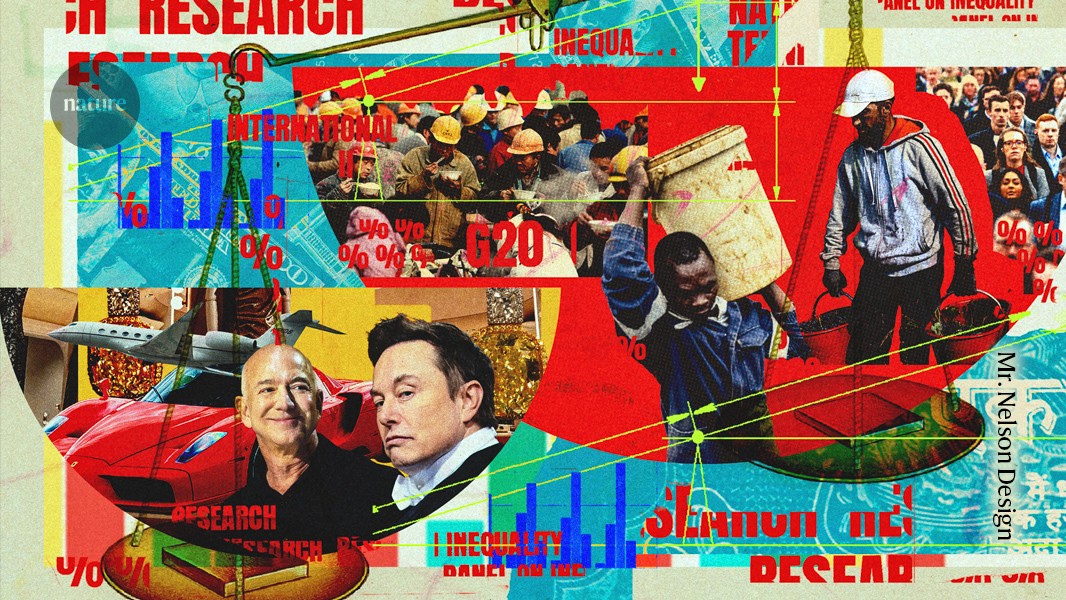
Rising global inequality demands urgent action. The richest 10% of adults worldwide receive more than half (53%) of global income, while the poorest 50% receive just 8%. Wealth is even more concentrated: the richest 10% own approximately three-quarters of the world’s wealth, compared with only 2% owned by the poorest half.1 Nearly two-thirds of people live in countries where inequality is increasing.2
The consequences are well established. A growing body of research links rising income inequality to reduced social mobility, poorer health outcomes and slower economic growth. Unequal access to education, health care, housing and finance shapes people’s opportunities and limits their ability to improve their lives.
Why are the rich so pessimistic? What the numbers say
Despite this evidence, no comprehensive international policy response has been established. One reason is political: inequality creates powerful beneficiaries. Another is practical. The gap between scientific research and policymaking remains unresolved. Evidence about inequality is spread across sectors and institutions, while research on policy effectiveness — including what works, in which contexts and through which mechanisms — is often poorly synthesized and difficult to access.
What is needed is an independent scientific body modelled on the Intergovernmental Panel on Climate Change (IPCC). Such a body could regularly and systematically assess evidence on the scale, nature, causes and consequences of inequality. It could also evaluate policy evidence and synthesize lessons from successful and unsuccessful approaches in different countries.
In 2025, we were invited by South African President Cyril Ramaphosa to join the G20 Ad Hoc Committee of Independent Experts on Global Inequality, chaired by JES. We submitted a report3. Our main recommendation to G20 countries was to establish an International Panel on Inequality (IPI).
Since then, a founding committee, of which we are members, has begun developing the proposal with guidance from South Africa, Brazil, Spain and Norway. United Nations Secretary-General António Guterres has supported the initiative. The African Union unanimously supports it, as do more than 600 economists and inequality experts. Here, we outline the case for the IPI.
Inequality of opportunity
Researchers broadly agree that global inequality is high, that wealth inequality is greater than income inequality, and that both forms of inequality are worsening in many parts of the world. Of the US$280 trillion in new wealth created worldwide between 2000 and 2024, the richest 1% received 41%, while the poorest 50% captured less than 1%.3
Inequality can be measured in relative or absolute terms. Relative inequality is often expressed using the Gini coefficient, which ranges from 0 to 1. A score of 0 means that everyone has the same income or wealth, while a score of 1 means that one person receives everything. The World Bank defines high income inequality as a Gini coefficient above 0.4.
Global relative inequality remains high, although it declined from 0.69 in 1990 to 0.60 in 2022.2 This decrease was mainly driven by rapid income growth in China and other parts of Asia (see “The wealth gap”).

Sources: Top and middle: Ref. 2; bottom: Ref. 3
At the country level, relative inequality has increased in most countries since 1990, and major regional disparities remain. The Gini coefficient is highest in sub-Saharan Africa, at 0.54 in 2022, and in Latin America and the Caribbean, at 0.47. It is lowest in Europe and Central Asia, at 0.32.2 Even countries with historically low inequality, including the Nordic countries, are experiencing rising inequality.
Inequality can also be measured in absolute terms, based on purchasing power. If everyone’s income rises by the same percentage — for example, 5% — relative inequality remains unchanged. However, absolute inequality, measured by the dollar value of the gap between people, increases.
Why can’t the world afford the wealthy?
By this measure, inequality between individuals is increasing worldwide. Between 2000 and 2024, the average wealth of the poorest half of the global population increased by just $585, while the average wealth of the richest 1% rose by $1.3 million.3
The impact on people’s lives is substantial. In Kenya, boys and girls from wealthy families have a one-in-two chance of continuing their education beyond secondary school. For boys and girls from poor families, the chance is one in 40 and one in 100, respectively.3 Countries with high inequality are also seven times more likely to experience democratic erosion, including weakened checks and balances, restricted civil rights, manipulated elections and the introduction of authoritarian practices, than countries with low inequality.3
There is sufficient consensus on these broad findings to justify urgent action. However, effective policymaking requires better and more reliable data, as well as a deeper understanding of the processes and outcomes that create and reinforce inequality.
The IPI plans to address four key areas: the drivers of inequality, its consequences, the policies available to reduce it and the results of those policies.
Measuring income and wealth inequality
Consensus on the broad picture should not be confused with agreement about every aspect of the data. Household surveys remain the main source of information on inequality and poverty, but they tend to underestimate incomes at the top because the wealthiest people are less likely to respond. As a result, standard methods can understate the true scale of inequality.
Researchers have developed methods to correct this bias by combining household surveys with tax records, administrative data and national accounts. However, these approaches give different weight to each source and make different assumptions about missing information. This can produce significantly different estimates of inequality.

Why we need to measure people’s happiness — lessons from a global study
For example, India’s Gini coefficient for 2022 has been estimated at 0.25 by the World Bank,4 0.49 by the United Nations University World Institute for Development Economics Research (UNU-WIDER) in Helsinki,2 and 0.64 by the World Inequality Lab.5 It is impossible to base policy solely on statistics that describe India as one of the world’s least unequal countries — more equal than Sweden — and one of the most unequal at the same time. Policymakers must also consider other indicators, including poverty, malnutrition and the number of billionaires.
The IPI could clarify the strengths and limitations of different measurement approaches and improve the way inequality is measured. It could explain why estimates and trends differ, identify findings that are consistent across methods, show how complementary measures can be combined, and promote greater transparency, harmonization and standardization. Governments, for example, need standardized methods for supplementing survey data to produce more accurate estimates of inequality and top incomes.
Wealth inequality requires particular attention. Wealth is closely linked to power and influence, while inherited wealth can perpetuate inequality across generations. Wealth inequality is generally more pronounced than income inequality, yet wealth data are often weaker. Worldwide, income from wealth remains highly concentrated, with a Gini index of 0.94. Around 80% of the world’s population has zero or near-zero income from wealth.6 Assets may be hidden, underreported or difficult to value, and comparable administrative and tax data are unavailable in many countries.
The IPI could strengthen global efforts to improve wealth inequality data, including through analysis of inheritance and other tax records. It could also help governments develop the tools required to measure wealth more accurately.
Understanding the causes of inequality
Taxes and government transfers to citizens, including welfare programmes, have a major influence on income inequality. Other factors that shape the distribution of market income are also important, including employment, wage-setting systems and access to education and health care.
Income inequality can worsen when people have unequal access to well-paid jobs and income-generating assets. Economic changes, such as the shift from manufacturing to services, can contribute to rising inequality, as can the weakening of trade unions. In many countries, the growing power of corporations and financial markets is also associated with greater inequality.

Informal settlements beside Mumbai’s skyscrapers highlight India’s inequality.Credit: Ludovic Marin/AFP/Getty
Research has also identified lower taxes on investment returns and capital assets, along with increased intergenerational transfers of wealth, as important causes of wealth inequality.7 Using data from the GC Wealth Project, our committee identified accumulated and inherited wealth as key factors that entrench inequality and undermine social mobility, equity and opportunity for low-income groups. An estimated $70 trillion is expected to be transferred to heirs over the next decade,3 increasing the risk that more countries will be shaped by inherited wealth and plutocratic power.
The IPI could advance understanding and build greater scientific consensus about the most important drivers of income and wealth inequality, as well as the reasons inequality is increasing. It could also assess how challenges such as artificial intelligence and climate change affect inequality.
Emerging technologies, particularly artificial intelligence, are likely to transform labour markets and direct more returns towards capital, intellectual property and data. Climate change is already causing the greatest harm to people with the fewest resources to adapt. The transition to a low-carbon economy will affect jobs, prices, public revenues and asset ownership. Geopolitical conflict, debt, trade rules and the structure of international finance also influence inequality.
Tracking the results of inequality policies
Inequality has economic, political and social consequences. A growing body of research links high income inequality to weaker and less sustainable economic growth. Our report3 shows that policies designed to reduce inequality can also support stronger economic performance, challenging long-held assumptions. For example, if monopoly power is a major cause of inequality, policies that limit monopolies may reduce inequality while improving economic outcomes.
Source: www.nature.com